Financial clarity is one of the hardest things to achieve when managing a project. Before schedules are finalized or budgets are approved, leaders need to understand how costs, pricing and sales interact. Break even analysis provides that perspective by showing when a project stops consuming value and starts sustaining itself.
What Is a Break Even Analysis?
A break even analysis is a financial technique used to identify the breakeven point at which total revenue equals total costs. It compares fixed costs and variable costs against sales, price per unit and cost per unit to determine the number of units sold required to avoid a profit loss. By using contribution margin, unit contribution margin and contribution margin ratio, the analysis shows how each sale contributes toward covering costs.
Break even analysis is a flexible financial tool that applies far beyond a single use case. Organizations use it across products, services, projects and strategic initiatives to test assumptions, compare options and manage risk. From early planning to ongoing review, it adapts to different industries, cost structures and sales models without losing relevance or clarity for leaders and teams alike.
Within project management, break even analysis plays a strategic role in evaluating feasibility and financial risk. It helps project managers assess whether expected sales volume can realistically cover fixed and variable costs, validate pricing assumptions and understand how changes in total revenue affect outcomes. This insight supports better planning, clearer stakeholder discussions and more informed go or no-go decisions.
ProjectManager has built-in tools to make a break even analysis simple and stress-free. Our integration with Acumatica provides a two-way connection between project and ERP systems to sync operational and financial data. Our Gantt chart also provides a live look into resource costs, making it easy to see how schedule changes impact your cost projections. Get started with a free 30-day trial.

Break Even Analysis Formula
The break even analysis formula translates cost and pricing data into a clear financial threshold. It shows how many units must be sold for total revenue to fully cover total costs, helping managers understand the relationship between fixed costs, variable costs, sales volume and financial viability before profits appear.
- Fixed costs: Expenses that remain constant regardless of units sold.
- Variable costs: Costs that change directly with production or sales volume.
- Price per unit: The amount charged for each unit sold.
- Cost per unit: The variable cost associated with producing one unit.
- Unit contribution margin: Revenue per unit minus variable cost per unit.
Break Even Point (Units) = Fixed Costs ÷ (Price per Unit − Cost per Unit)

Get your free
Break Even Analysis Template
Use this free Break Even Analysis Template to manage your projects better.
Get the Template
Who Is Responsible for Break Even Analysis?
Break even analysis is a shared responsibility that sits between business leadership and project execution. Strategic teams focus on pricing, sales and financial targets, while project management translates those assumptions into cost structures, schedules and delivery constraints. Only by combining both perspectives can organizations produce realistic, decision-ready break even insights.
- Executive leadership: Sets profitability expectations, approves pricing strategy and uses break even results to decide whether a project aligns with broader business objectives and acceptable financial risk.
- Finance managers: Calculate fixed costs, variable costs and contribution margin figures, ensuring assumptions are accurate and consistent with accounting standards and historical financial performance.
- Strategic planning teams: Analyze sales volume scenarios, total revenue targets and margin ratio impacts to assess long-term viability and competitive positioning.
- Sales leadership: Provides realistic units sold forecasts, validates price per unit assumptions and confirms whether projected sales targets are achievable in current market conditions.
- Project managers: Translate financial assumptions into project budgets, timelines and resource plans, ensuring delivery constraints align with the breakeven point expectations.
- Cost estimators: Define cost per unit and variable cost drivers, refining estimates as scope, materials or labor assumptions change during planning.
- Program or portfolio managers: Compare break even outcomes across multiple projects to prioritize investments and balance financial exposure at an organizational level.
- Operations managers: Assess whether operational capacity, staffing and processes can support the required sales volume without inflating total costs beyond break even thresholds.
When to Conduct a Break Even Analysis
Timing matters just as much as accuracy when applying break even analysis. Organizations rely on it at moments where financial commitments increase and uncertainty narrows available options. Whether shaping strategy or refining execution, this analysis helps leaders understand how costs, pricing and sales expectations interact before decisions become difficult or expensive to reverse.
- Launching a new product or service
- Evaluating the financial viability of a new project
- Setting or adjusting pricing strategies
- Comparing alternative project delivery approaches
- Assessing the impact of increased fixed costs
- Analyzing changes in variable costs or cost per unit
- Planning sales volume targets and revenue goals
- Deciding whether to scale operations or production
- Reviewing project performance after scope or cost changes
- Supporting go/no-go investment decisions
Related: 12 Free Business Planning Templates for Excel & Word
Why Is a Break Even Analysis Important? Key Benefits
Understanding where financial balance is achieved gives organizations a powerful decision-making advantage. Break even analysis helps businesses of all sizes evaluate risk, clarify financial expectations and avoid committing resources blindly. By revealing how costs, pricing and sales interact, it supports smarter planning, more confident investment decisions and stronger alignment between strategy and execution across projects, products and operations.
- Clarifies financial viability: Shows whether projected sales can realistically cover total costs before profits are expected.
- Supports informed decision-making: Provides concrete data for go/no-go, pricing and investment choices.
- Improves cost awareness: Highlights the impact of fixed and variable costs on overall performance.
- Reduces financial risk: Identifies break points early, helping organizations avoid unprofitable commitments.
- Aligns strategy and execution: Connects business goals with project-level cost and delivery planning.
- Enhances forecasting accuracy: Strengthens revenue and sales volume projections with realistic assumptions.
How to Do a Break Even Analysis
Executing a break even analysis requires more than plugging numbers into a formula. The process combines financial inputs, realistic assumptions and project context to reveal when costs are recovered and decisions shift from risk containment toward sustainable performance over time.
1. Define the Project Scope
Start by defining the product or project scope clearly. Identify what is being sold, over what period and under which assumptions, ensuring the analysis reflects a realistic launch, delivery model and operational boundaries rather than abstract financial averages alone, theoretical.
2. Identify Fixed Costs
List all fixed costs associated with the project. Include expenses that remain unchanged regardless of sales volume, such as development, salaries, marketing commitments or infrastructure, to establish the baseline financial threshold that must be recovered before any profit can exist.
3. Determine Variable Costs per Unit
Determine variable costs on a per-unit basis. Focus on expenses that increase with each unit sold, such as materials, support or transaction fees, so cost per unit accurately reflects the true marginal cost of delivery for each additional sale made.
4. Set the Price per Unit
Set a realistic price per unit based on market conditions. Pricing should align with customer expectations, competitive positioning and value perception, as even small price changes can significantly shift contribution margin and the breakeven point across projected sales volumes.
5. Calculate the Unit Contribution Margin
Calculate the unit contribution margin using price and variable cost data. This figure shows how much each unit sold contributes toward covering fixed costs and is the foundation for determining the break even point within the defined project financial structure.
6. Calculate the Break Even Point
Apply the break even formula to calculate the required sales volume. Dividing fixed costs by the unit contribution margin reveals how many units must be sold before total revenue equals total costs under current assumptions, pricing, costs and demand conditions modeled.
7. Analyze Results and Scenarios
Review results and test alternative scenarios. Adjust pricing, costs or sales assumptions to understand sensitivity, identify risk and support informed decisions before committing resources or finalizing the project business case and aligning expectations across stakeholders, strategy, execution timelines and funding.
Related: 20 Best Resource Management Software of 2026 (Free & Paid)
Break Even Analysis Template
Conducting a break even analysis for a business idea or a project can be overwhelming, especially for beginners, which is why we’ve created a free break even analysis template for Excel, which automates the calculations required to implement the break even analysis formula. Simply enter the variables and the Excel formulas will help you calculate the profitability of your initiative.
Break Even Analysis Example
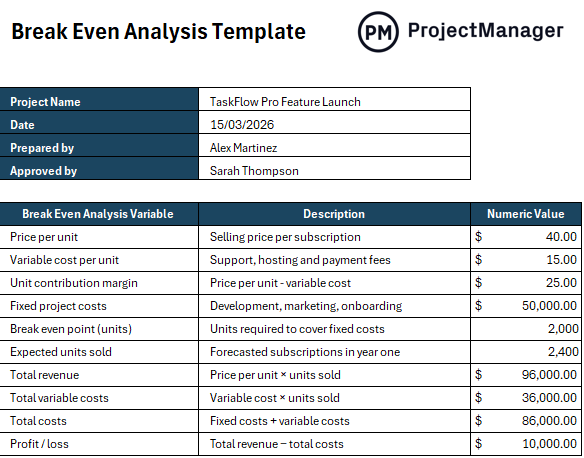
Company XYZ plans to launch a new subscription-based software feature and must evaluate its financial feasibility before moving forward. To do this, the organization conducts a break even analysis to understand how pricing, costs and sales volume interact. Fixed project costs include development, marketing and onboarding efforts, while variable costs are tied to customer support and platform usage.
By calculating the unit contribution margin and identifying the breakeven point, management can estimate how many subscriptions must be sold to cover total costs. This analysis helps decision-makers assess risk, validate assumptions and determine whether demand justifies proceeding with the product launch.
| Item | Description | Sample Data |
|---|---|---|
| Project name | New SaaS Feature Launch | TaskFlow Pro |
| Price per unit | Selling price per subscription | 40 |
| Variable cost per unit | Support, hosting and payment fees | 15 |
| Unit contribution margin | Price per unit minus variable cost | 25 |
| Fixed project costs | Development, marketing, onboarding | 50,000 |
| Break even point (units) | Units required to cover fixed costs | 2,000 |
| Expected units sold | Forecasted subscriptions in year one | 2,400 |
| Total revenue | Price per unit × units sold | 96,000 |
| Total variable costs | Variable cost × units sold | 36,000 |
| Total costs | Fixed costs + variable costs | 86,000 |
| Profit/loss | Total revenue − total costs | 10,000 |
Free Related Business and Project Management Templates
We’ve created over 100 free business and project management templates for Excel, Word and Google Sheets. Here are some that can help when conducting a break even analysis.
Cost-Benefit Analysis Template
This template helps organizations compare expected benefits against associated costs, making it easier to evaluate value, prioritize initiatives and support objective decision-making before committing resources to a project.
Feasibility Study Template
Use this template to assess technical, financial and operational feasibility, ensuring proposed projects are realistic, aligned with strategic goals and capable of delivering expected outcomes within defined constraints.
Cost Breakdown Template
This template organizes project costs into clear categories, improving visibility into spending drivers, supporting accurate estimates and helping teams monitor cost performance throughout the project lifecycle.
How ProjectManager Helps Deliver Profitable Projects
Utilize a combination of ProjectManager’s built-in resource management features to gather data and construct an accurate break even model. Enter your planned expenses and update them with actuals to see how close you are to your expected breakeven point.
Integrate with Acumatica to Sync Financial Data
ProjectManager’s Acumatica integration is another key way to deliver profitable projects. As the primary use for Acumatica is for finance and accounting teams, executives, department leaders and subcontractors, it’s the ideal platform to oversee customizable budget reports. Use the integration to manage finances, oversee projects with complex schedules, understand resource allocations and more. Watch the video below to learn more.
Custom Resource-Driven Reports
Stakeholders want to be kept in the loop of how projects are playing out, and custom reports are a great way to do so. In a few clicks, you can produce reports that combine costs, resource usage and cash flow data. To take reporting to the next level, use AI Project Insights to analyze and contextualize your project data.

Related Content
- Project Cost Estimation: How to Estimate Project Cost
- Cost-Benefit Analysis: A Quick Guide with Examples
- What Is a Cost Baseline in Project Management?
- What Is a Feasibility Study? How to Conduct One
- Feasibility Report in Project Management
ProjectManager is award-winning software that helps you plan, manage and track resources in real time. We empower teams on a collaborative platform with task and resource management features to keep everyone working together more productively. Get started with ProjectManager today for free.
