An automated project dashboard with meaningful insights
![]()
Live data
View updates in real time, monitor key metrics and keep everything on track.
![]()
Total visibility
Easy-to-read charts update automatically for total project transparency.
![]()
Issue management
Spot issues before they become serious and make adjustments.
![]()
Works instantly
No complicated set up. Create a project, update tasks and it works at once.
![]()
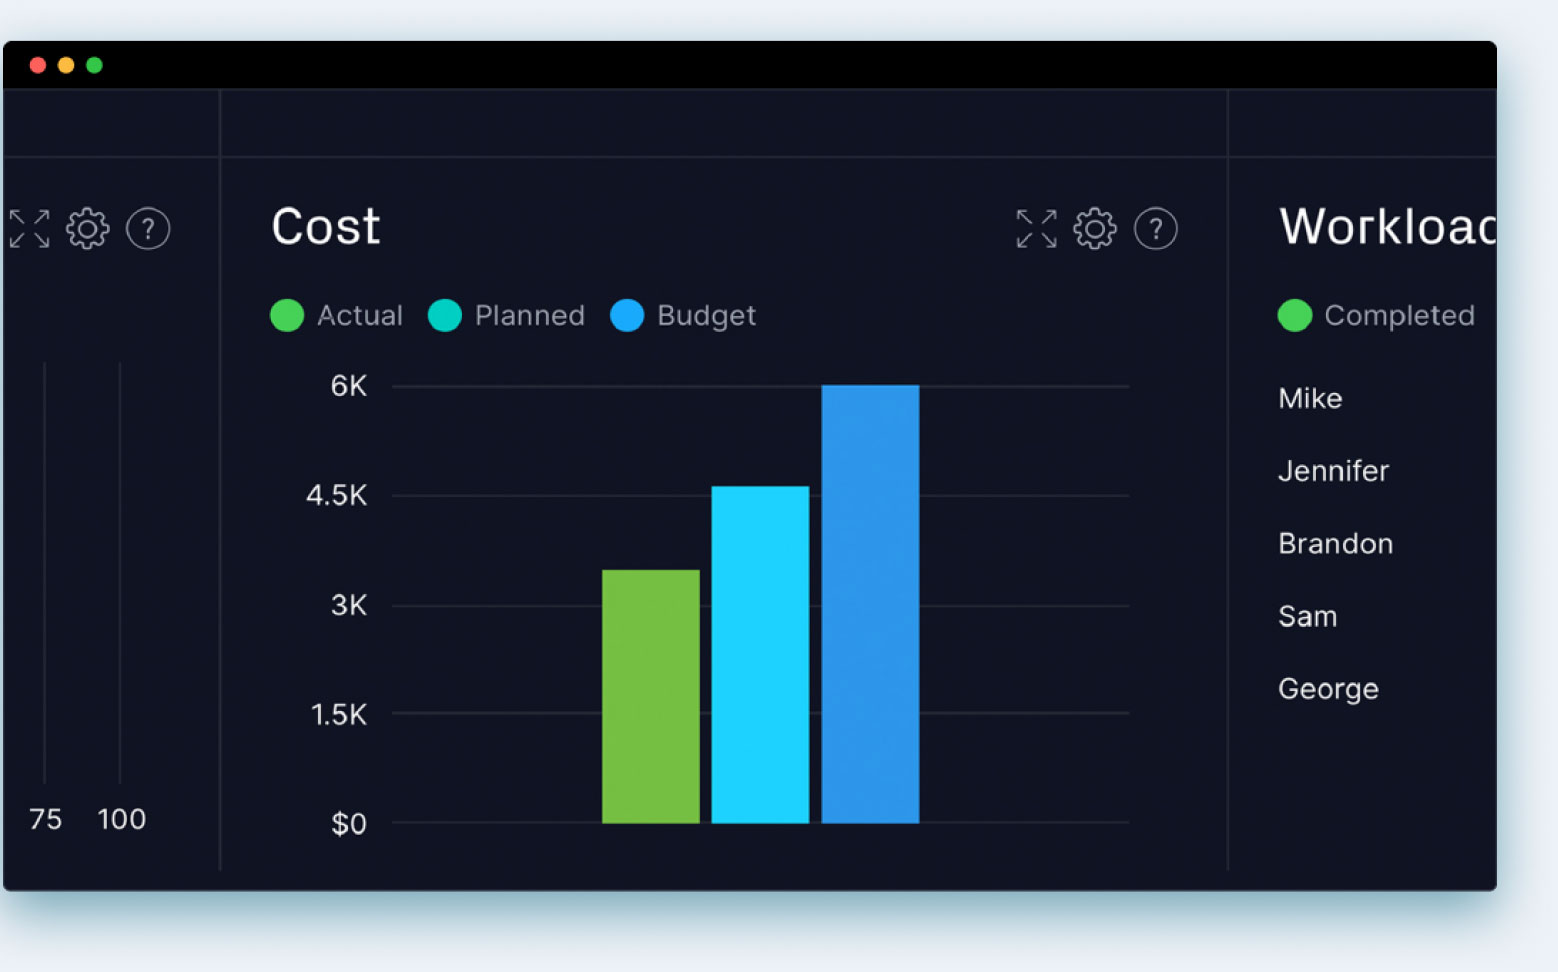
Cost tracking
Compare your budget, planned costs and actual costs on one panel.
![]()
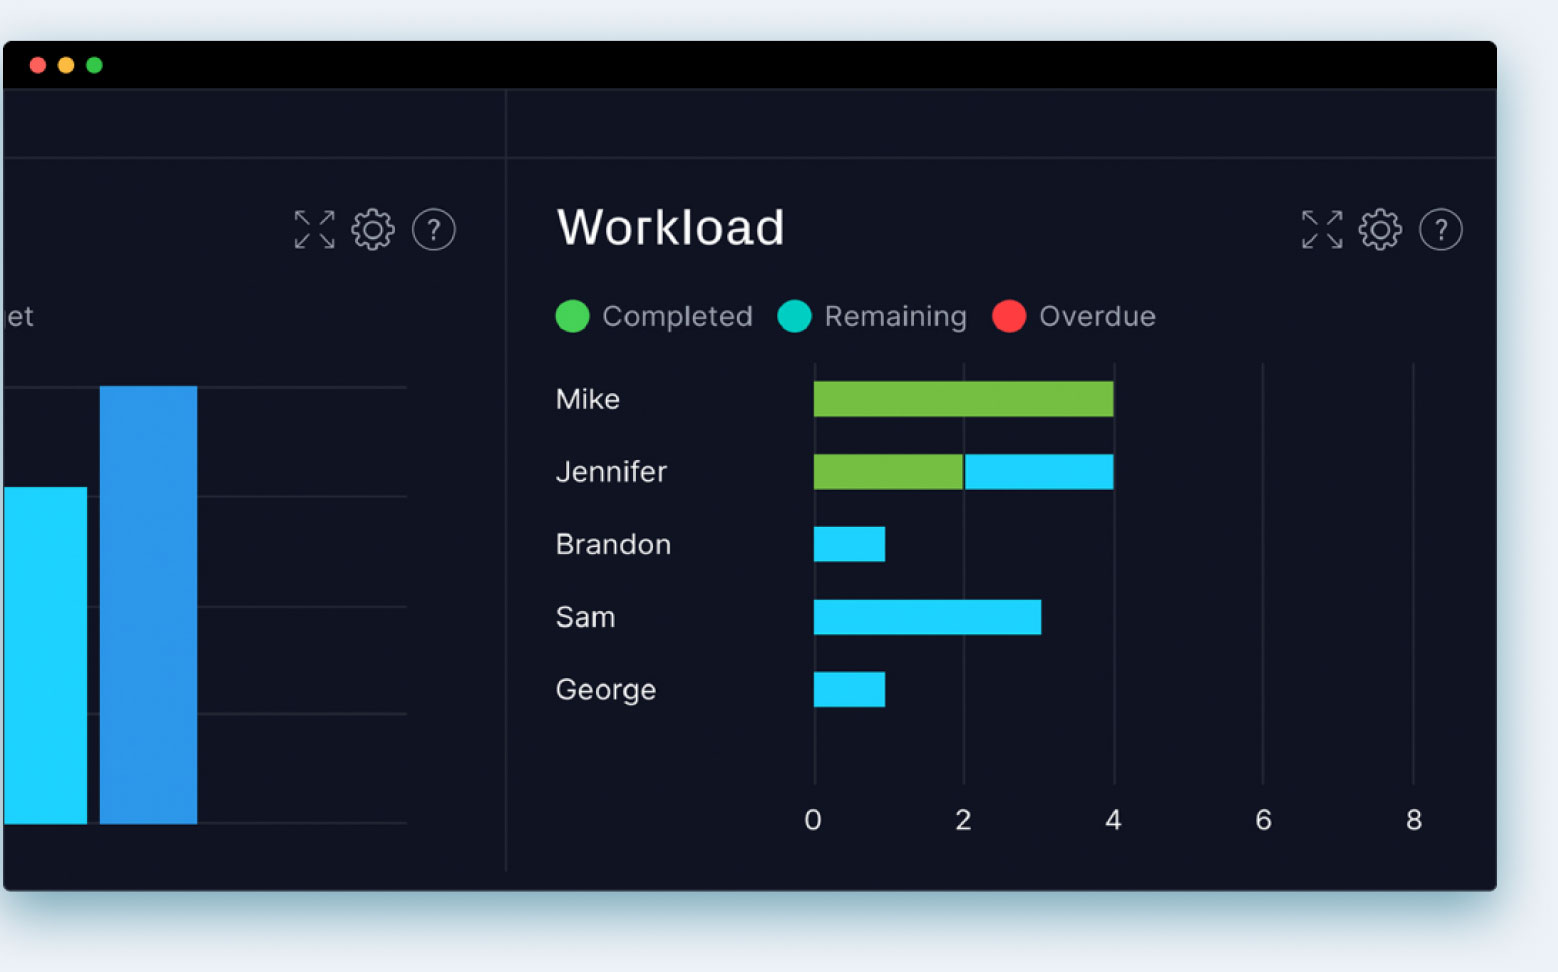
Workload analysis
See which team members have incomplete or overdue tasks.
![]()
Slippage reports
Understand if your project is ahead, behind or on schedule.
![]()
Print and share
Print the dashboard or share online. No more manual status updates.
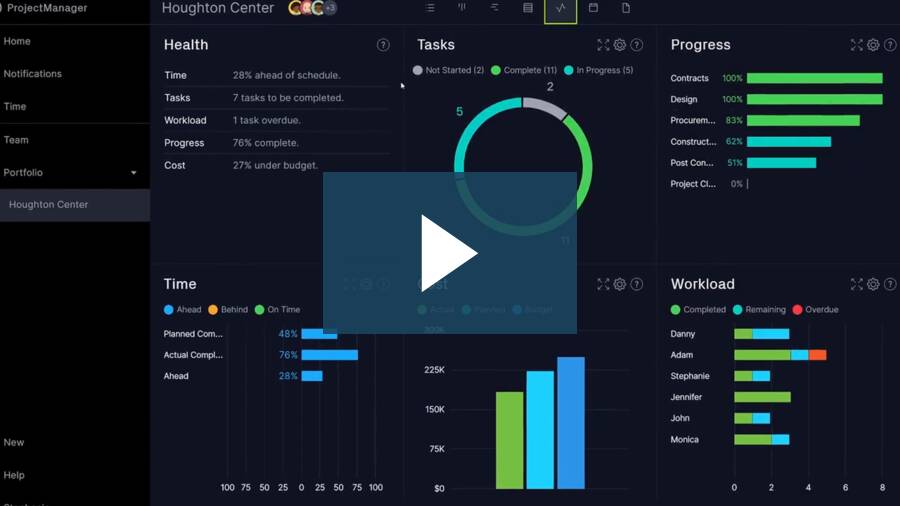
Get real-time dashboard tools
Our project dashboard feature provides you with real-time data and business intelligence from all your projects. Dashboard widgets let you monitor tasks, teams, costs, health and more.
- View progress and task status
- Monitor key metrics of all your projects
- Easy setup and customization

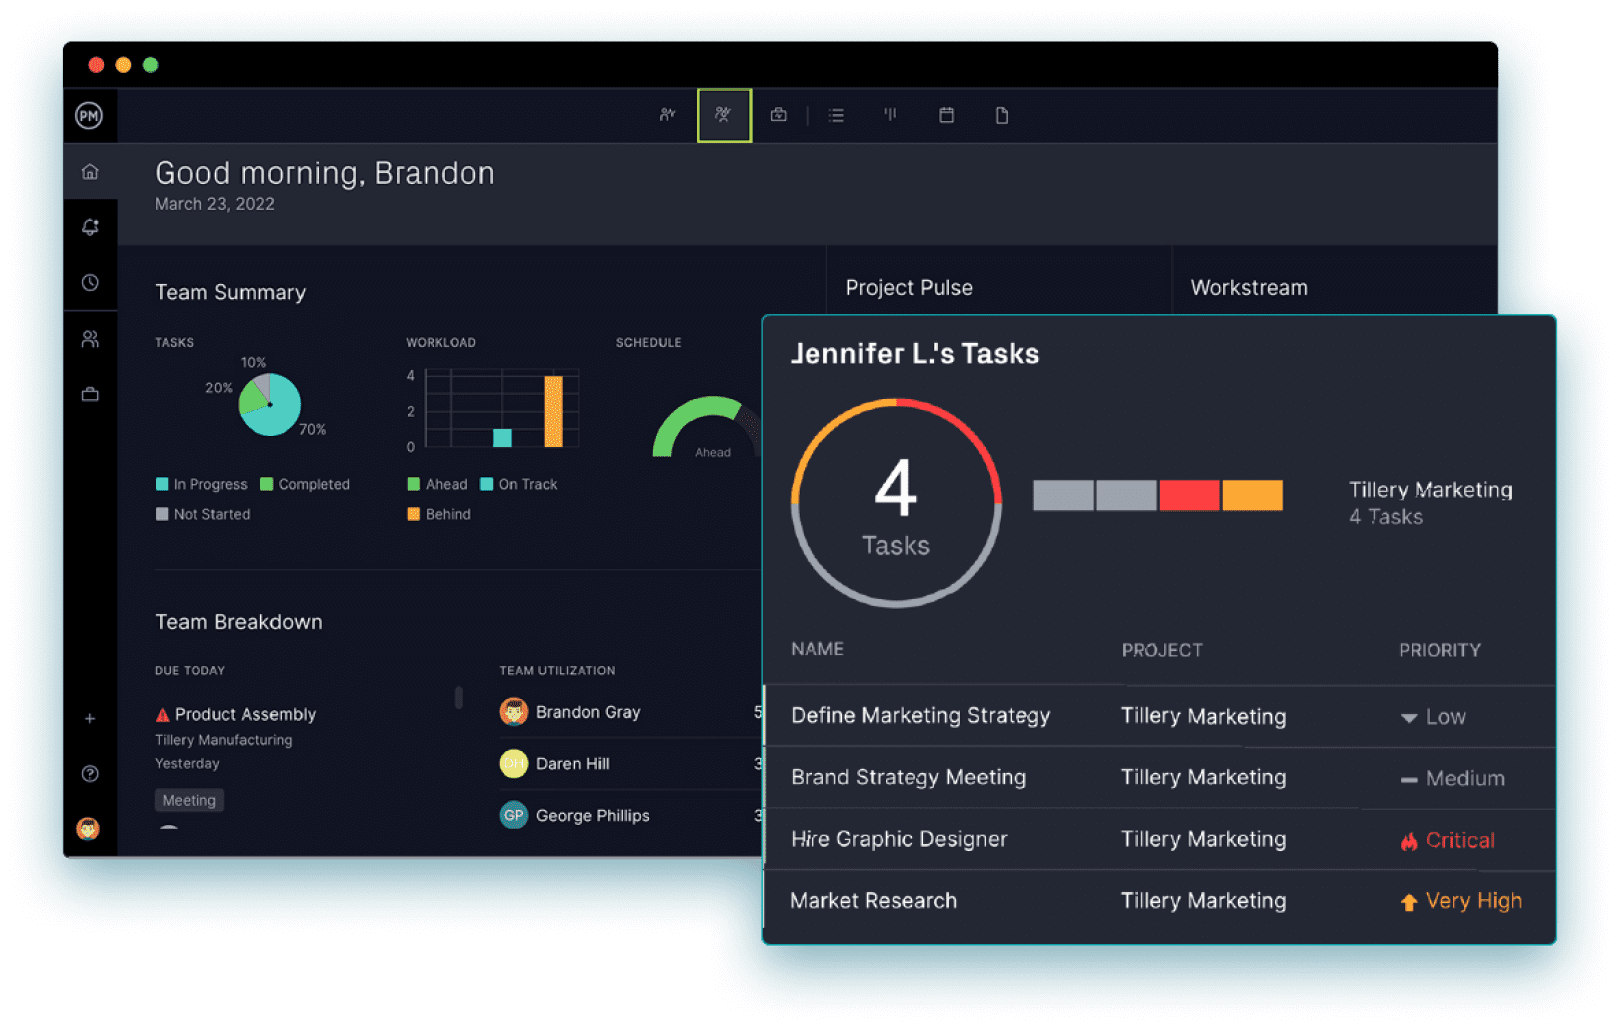
Track all your tasks in one view
The project dashboard updates instantly when tasks, teams and projects make progress, so you always know if you’re on track. Say goodbye to complex spreadsheets and manual reporting.
- Get instant updates on your team’s progress
- Stay on schedule and keep on target
- View team workload
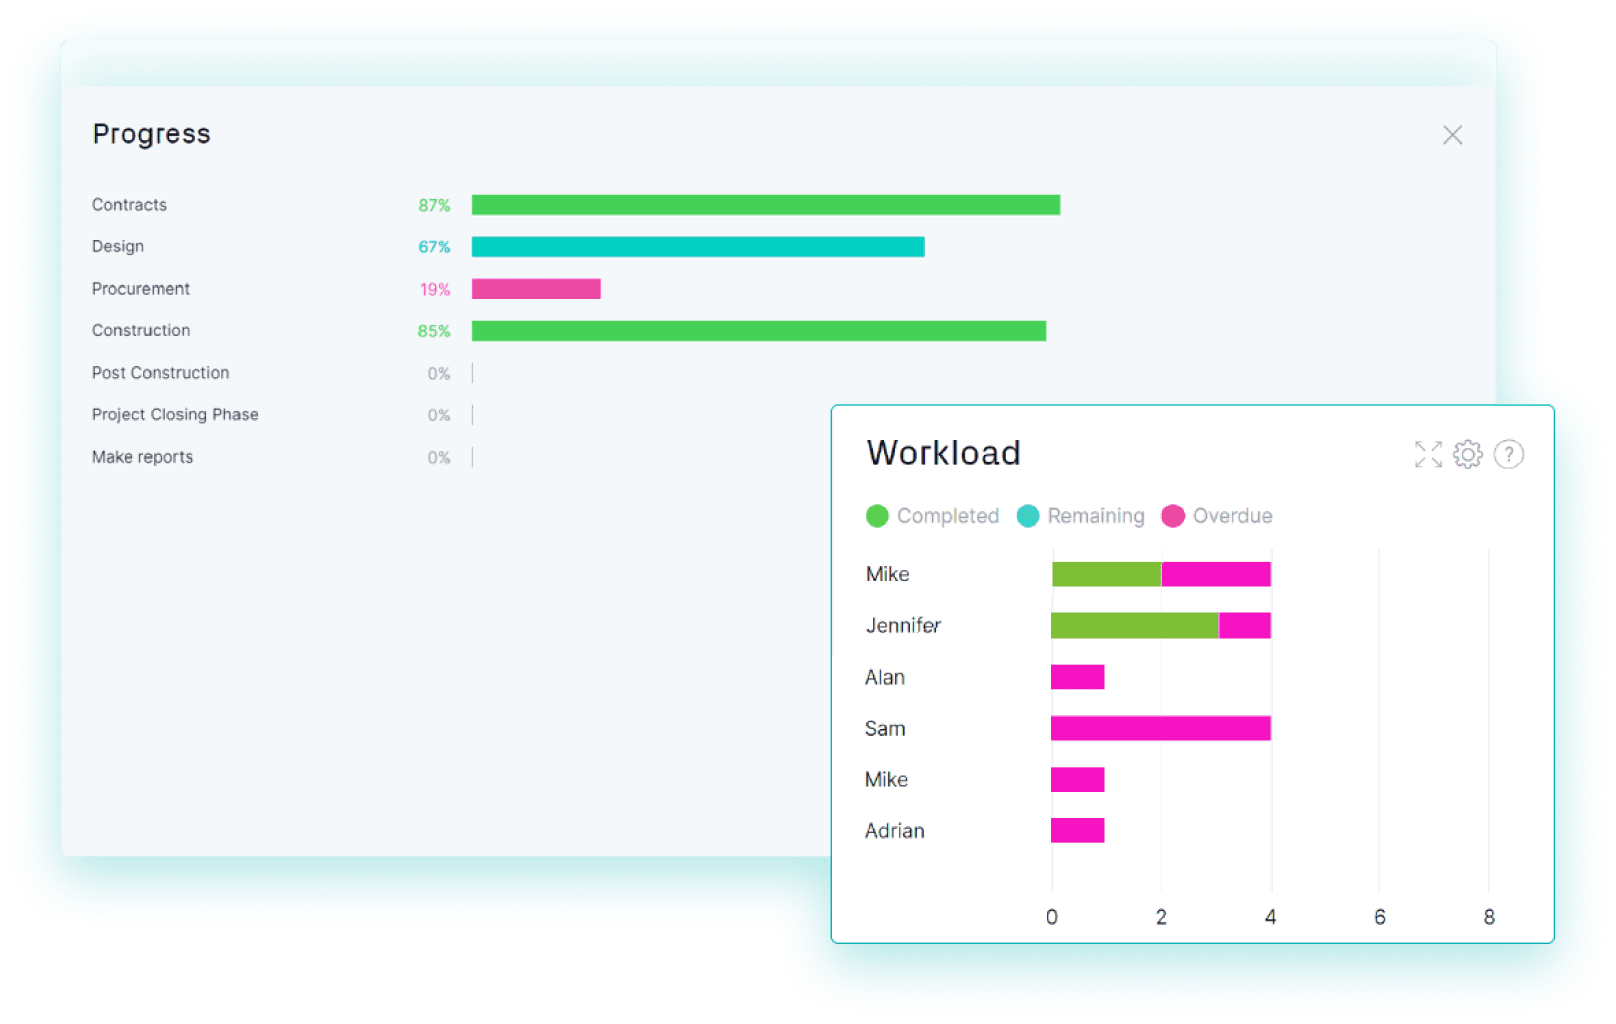
View your team’s workload
Our dashboard’s workload widget gives you a window into each team member’s progress, so you can easily monitor how much work they have completed according to their schedule.
- Keep track with red, green and yellow color coding
- See the amount of time your team spends on tasks
- View variance between planned and actual progress
One view for your entire portfolio
With Overview Dashboards, you can group similar projects in your portfolio together to get a high-level view of them all in a single dashboard.
- Keep track of your portfolio from a single dashboard
- Quickly see which projects are ahead or behind
- Dig deeper into individual projects for more detail
Dashboard tools for busy managers
Custom filters
Create filters for your dashboards to see what you need.
Print out hardcopies and distribute to stakeholders.
Program dashboards
Create program dashboards that collect specific projects.
Custom colors
Choose the look that suits you and your analysis.
Track all views
All views feed into the project dashboard.
Instant set up
No set up required. Works immediately for your project.
Expandable tiles
Expand specific metrics to look closer at the data.
Shareable dashboards
Share your dashboard with anyone on the team for alignment.
Key features of our project dashboards
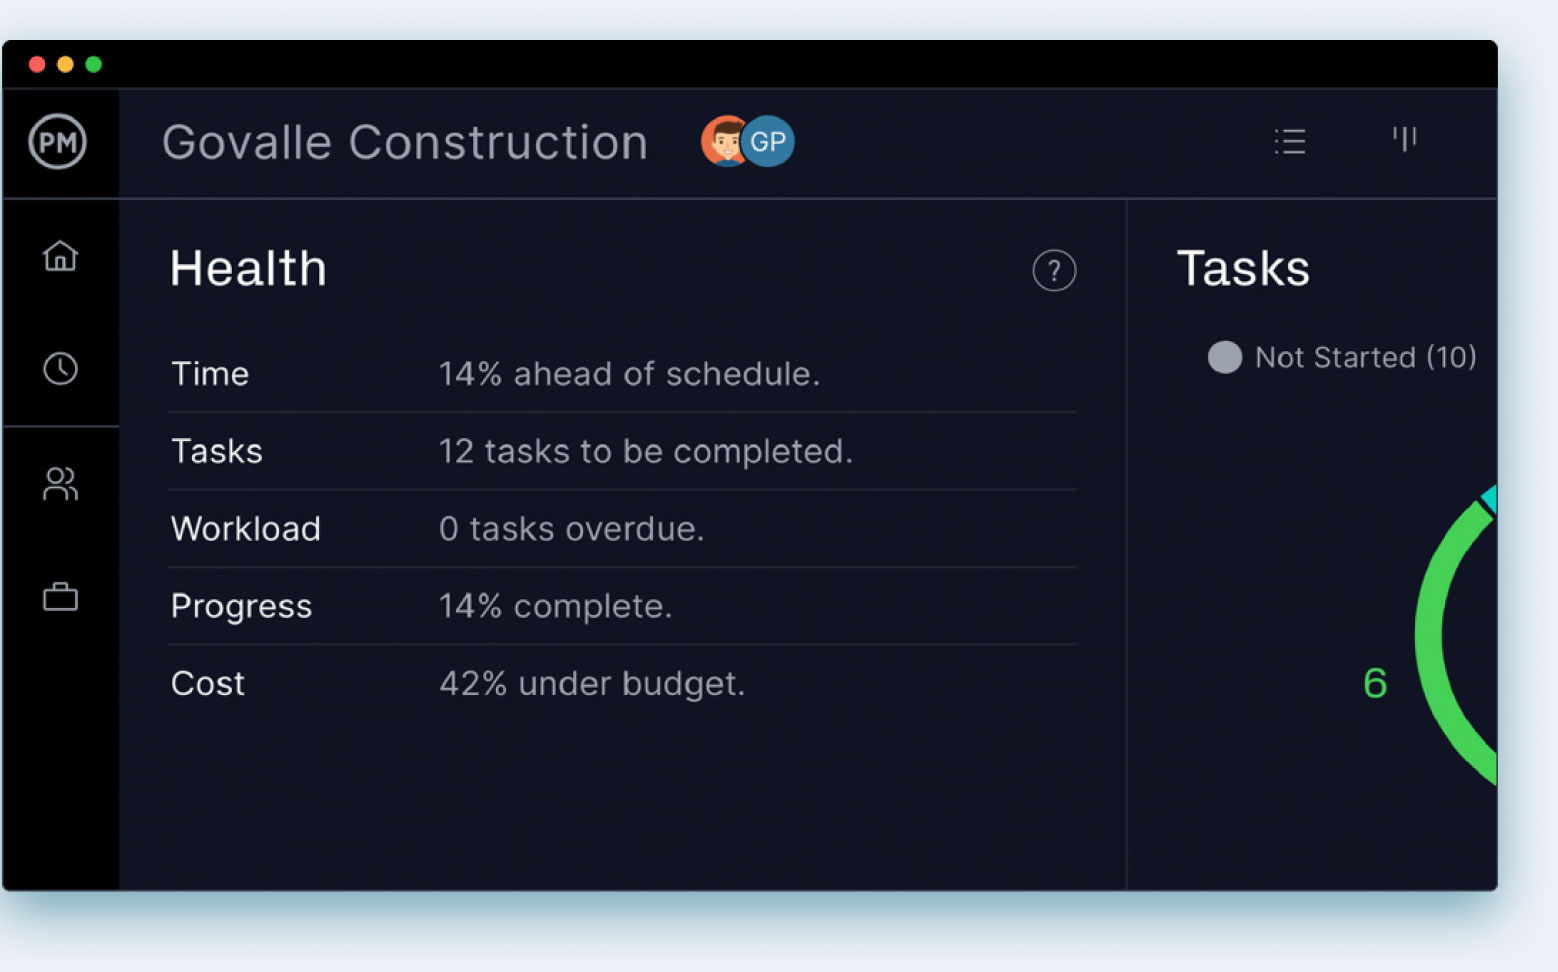
Get a dashboard overview
See the overall health of your project in one place. All five dashboard metrics are summarized here. Check the time, tasks, workload, progress and cost of your project and know instantly if you’re on schedule.
Track project tasks
Track all of your tasks with our color-coded chart. You can easily see which tasks are started, in progress or complete. Get a quick overview of how much work you have left.
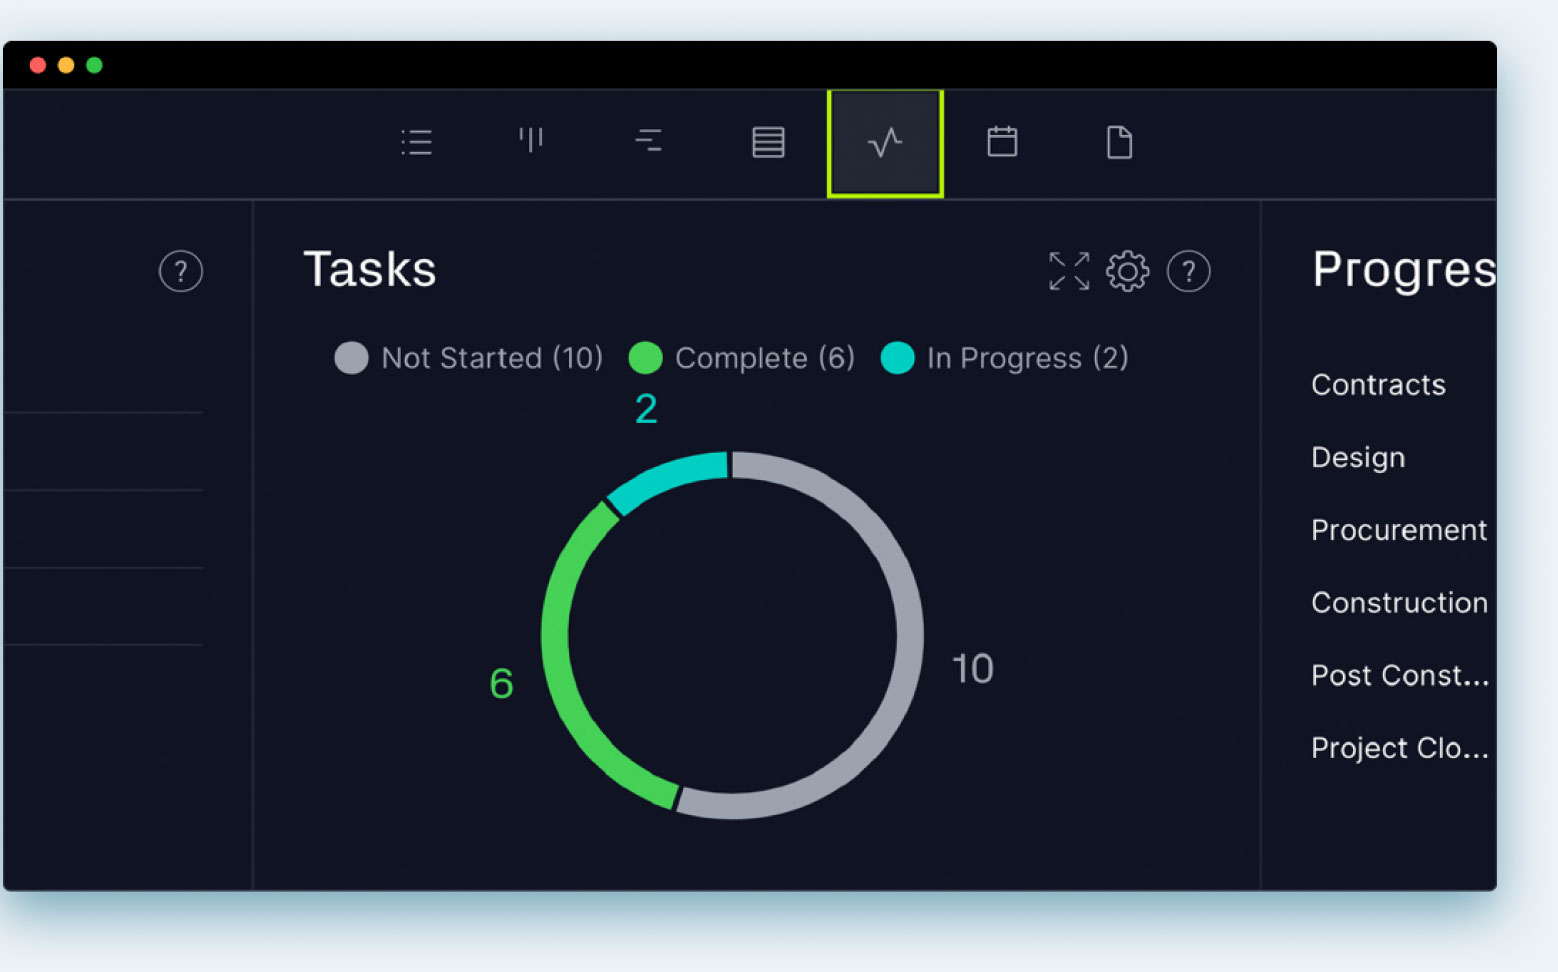
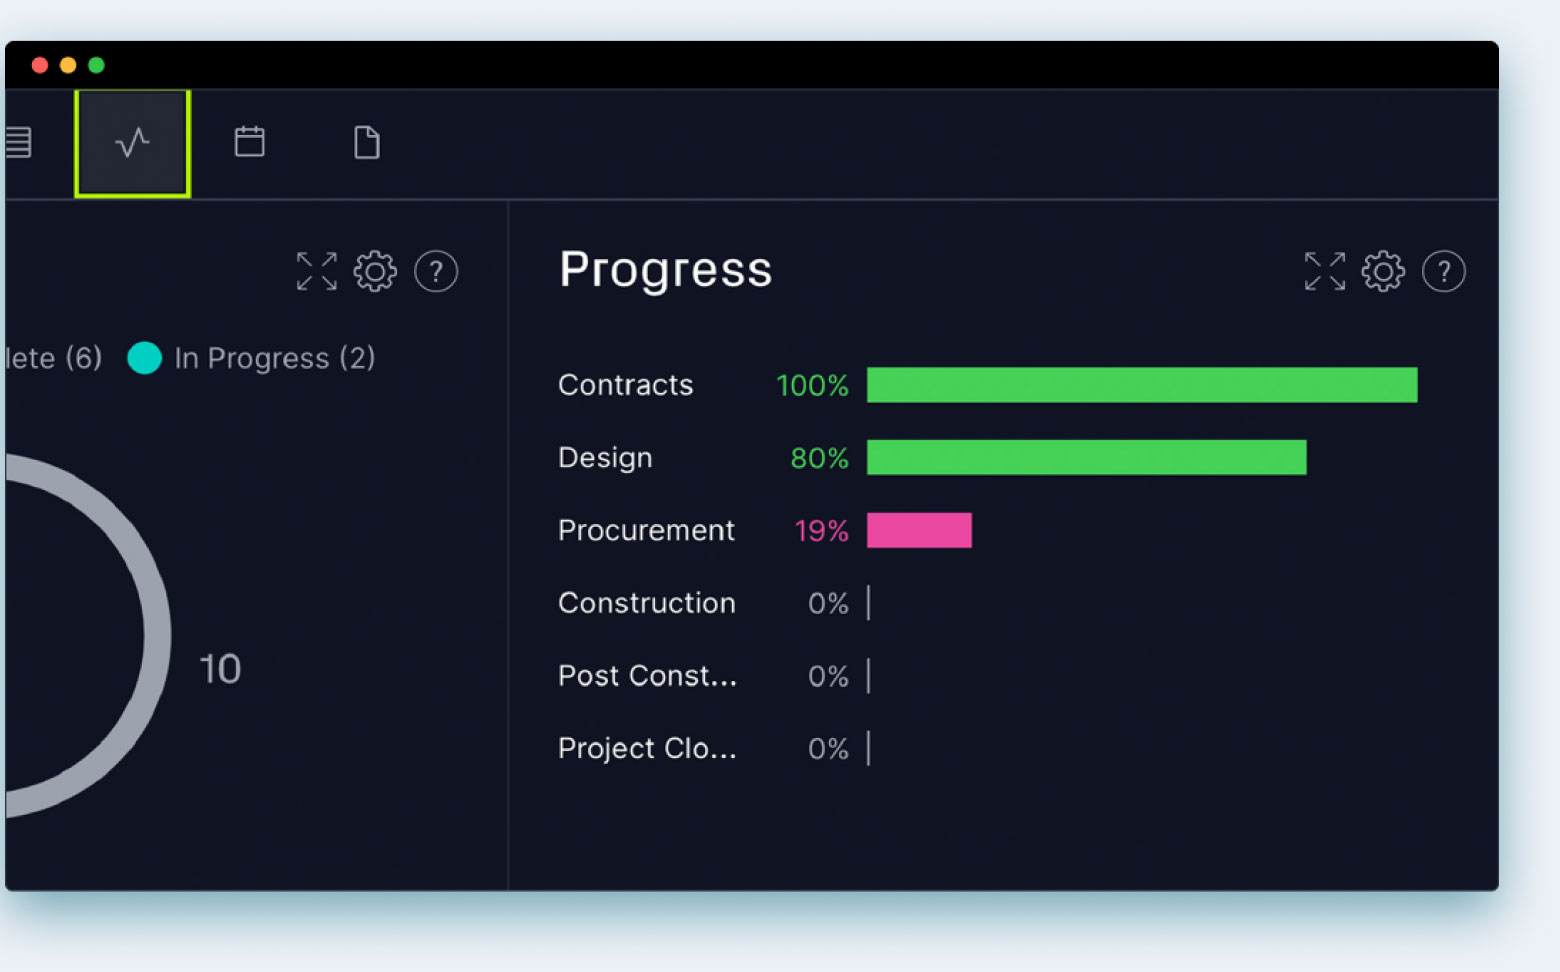
See your percent complete
Know what percentage of your tasks are done, and which ones are holding you up. If you add summary tasks on our Gantt chart, they’ll show up here, too.
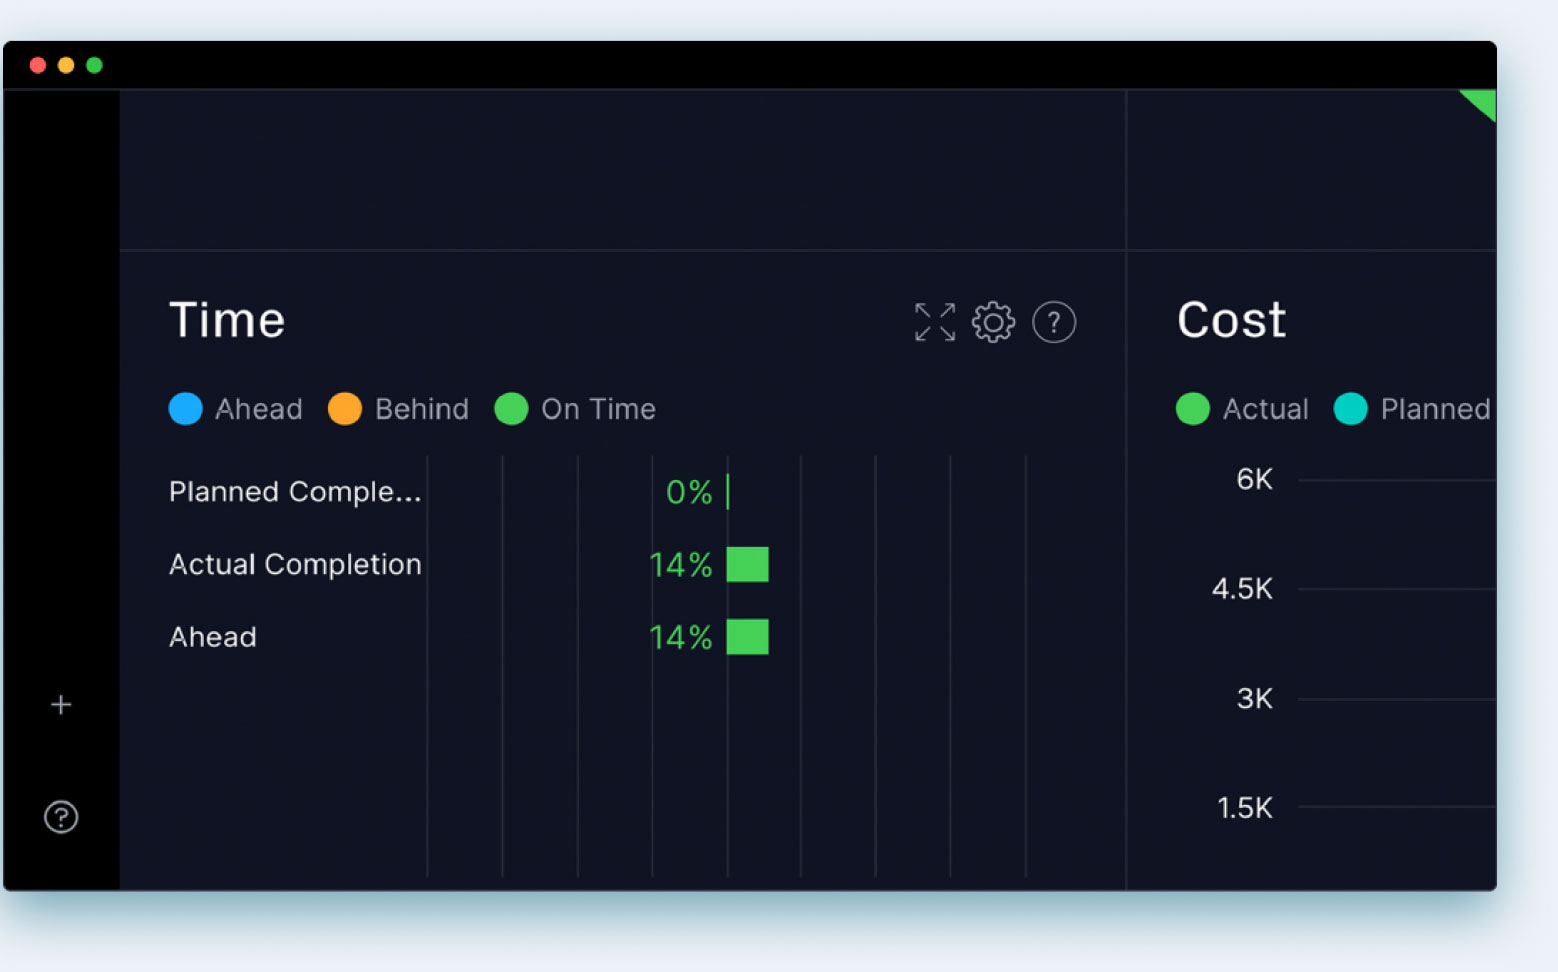
Ahead or behind schedule
See if your schedule is moving forward as planned or running behind. The time chart measures the percentage complete for your whole project, making it easy to avoid scope creep.
Monitor your team’s work
Assigned tasks are shown as completed, remaining and overdue by color on the workload graph. The data is based on the percentage complete for each task.
Make sure you’re on budget
Compare your planned costs against your actual costs with the cost graph. Your budget is a baseline set against what you spend executing the project, so you’re aware of your expenditure.

Integrate with over 1,000 business & project management apps

Add Google links to tasks for easy collaboration. Plus, sync to Google Drive & Google Calendars via Zapier.

Microsoft
Seamless importing and round-tripping of Microsoft Project plans, Excel files and CSV files.

Zapier
Keep the data flowing when you connect with Salesforce via our Zapier integration.


Powerful for managers. Flexible for teams.
Trusted by 35,000+ users worldwide.

“The reporting feature is outstanding – lets you personalize the reporting, and export it.”

“It has an excellent price if we think about all the functions that ProjectManager has.”

“I feel good about recommending ProjectManager because of the people you have in support”
Start your free 30-day trial
Deliver faster, collaborate better and innovate more effectively without the high price tag or months-long implementation required by other products.