Project dashboards provide a clear, real-time overview of a project’s progress, performance and key metrics in one centralized location. It helps project managers and stakeholders quickly assess whether the project is on track by visualizing data such as timelines, budgets, resource allocation and task completion rates. By simplifying complex information into easily digestible visuals like charts and graphs, dashboards enable faster decision-making, improve communication across teams and enhance transparency throughout the project lifecycle.
Many teams use Microsoft products to manage their projects, but does Microsoft Planner have a dashboard? The Microsoft Planner dashboard helps teams get a visual sense of progress, workloads and priorities across projects.
What Is Microsoft Planner?
Microsoft Planner is a task management tool that helps teams organize, track and collaborate on projects. It allows users to create plans, assign tasks, set due dates and monitor progress through visual boards and charts. Integrated with Microsoft 365, Planner makes it easy to share updates, attach files, and communicate within teams, promoting better coordination and productivity.
Does Microsoft Planner Have a Dashboard?
Many people wonder whether Microsoft Planner has a dashboard view. After all, dashboards are essential project management tools, providing a real-time visual summary of a project’s status. They help teams quickly understand progress, performance and potential issues.
Most valuable project management software includes some sort of dashboard functionality. Dashboards are key for helping project managers monitor goals, make informed decisions and communicate updates to stakeholders.
Short Answer: Yes, Microsoft Planner Has a Dashboard
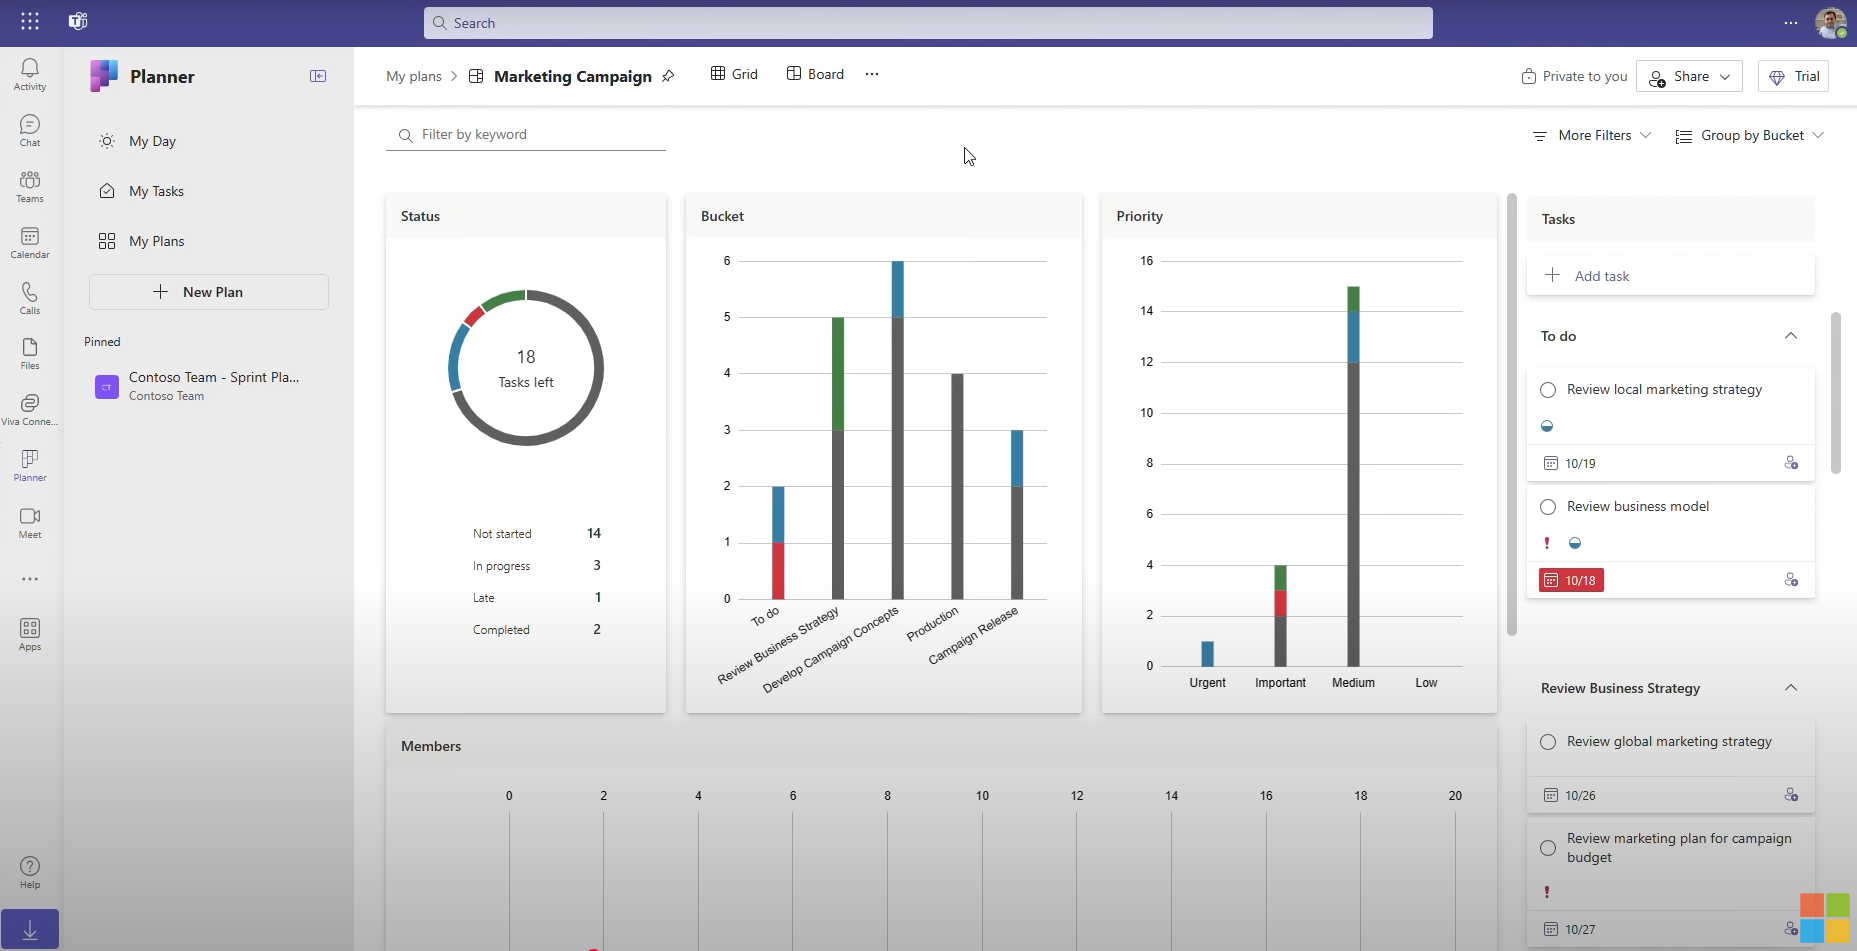
Microsoft Planner does have a dashboard, although it is technically called “Charts” in their software. It provides a visual summary of key metrics like task status and overdue items. With it, managers can see which tasks are in progress, which are falling behind and which have been completed, giving them the clarity they need to make adjustments quickly. The tool’s color-coded cards and buckets make it easy to scan for updates, review key deadlines and understand how work is distributed among team members.
Beyond its visuals, the Microsoft Planner dashboard simplifies how teams stay aligned on shared goals. Whether planning short sprints or tracking department-wide initiatives, it offers a central space to manage collaboration and accountability.
Long Answer: Microsoft Planner’s Dashboard Lacks Key Project Management Features
While Planner’s dashboard provides helpful overviews, many teams eventually need more flexibility, deeper reporting and broader integration to manage multiple projects efficiently—especially as their workloads and demands expand.
The Microsoft Planner dashboard gives a quick overview, but it’s limited in its ability to drill into complex metrics or handle multiple projects simultaneously. It’s best suited for simple task tracking rather than advanced portfolio oversight. For larger teams or organizations managing layered workflows, Planner’s dashboard lacks customization, automated reporting and integration depth, which makes it difficult to generate comprehensive insights across departments or cross-functional initiatives.
What Is the Microsoft Planner Dashboard View?
Microsoft Planner technically has a dashboard-style view via Charts, but if you’re looking for a comprehensive, organization-wide dashboard, you’ll be left looking for an alternative. Purchasing additional tools or dealing with integrations is frustrating, time-consuming and expensive.
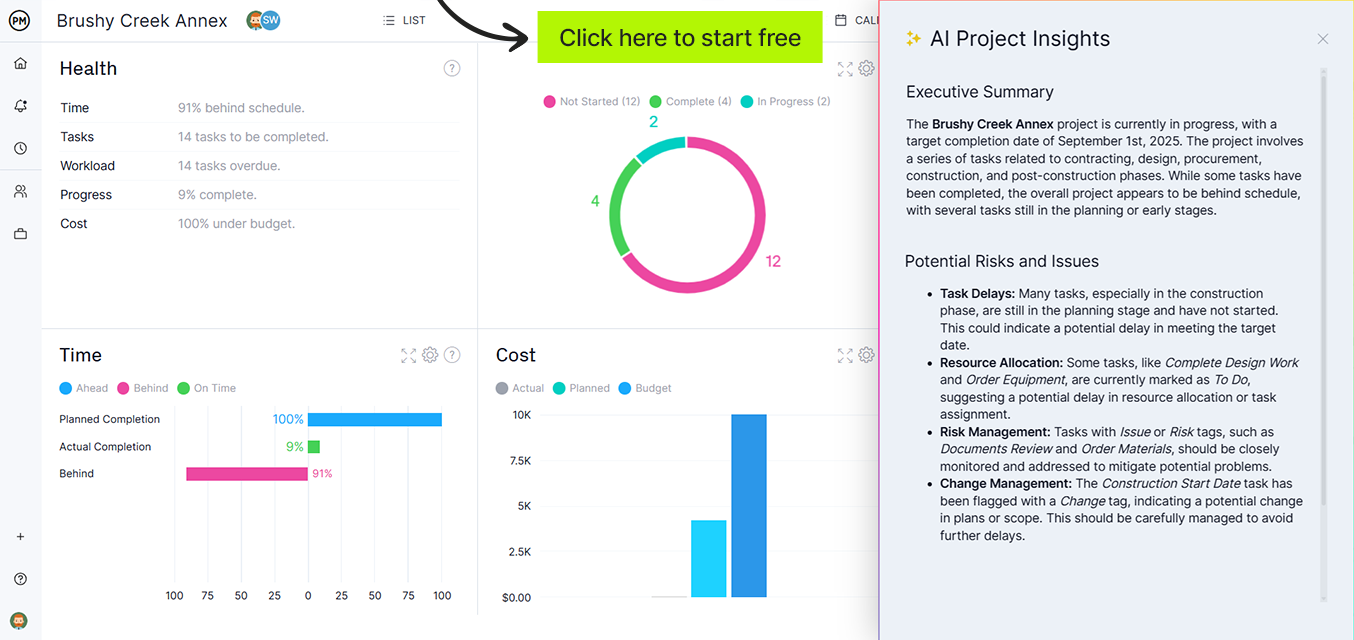
ProjectManager’s dashboard, by comparison, offers live data analytics that update instantly as teams log time, complete tasks or adjust resources. It features multiple project views such as Gantt, sheet, list and kanban, all feeding real-time data into dynamic charts that track cost, workload, time and task progress. Users can set baselines, forecast trends and generate automated reports powered by AI to provide a summary and recommendations. There is also a seamless Power BI integration. Because ProjectManager imports Microsoft Planner files directly, teams can upgrade to richer insights without losing prior work. Get started with ProjectManager today for free.
Microsoft Planner Dashboard View Key Features
Now that we know what metrics are being monitored, let’s explore the features associated with the Microsoft Planner dashboard. They’re listed as follows.
- Visual Task Overview (Basic & Premium): Provides a quick visual summary of all plans and their task progress using color-coded charts.
- Built-In Charts (Basic & Premium): Includes pie and bar charts showing task distribution by status, bucket or assignee.
- Filter & Grouping Options (Basic & Premium): Allows filtering by user, due date, priority or label to focus on specific workloads.
- Integration with Microsoft 365 (Basic & Premium): Fully integrated with Teams, Outlook, To Do and Loop for consistent project visibility.
- Real-Time Updates (Basic & Premium): Instantly reflects changes made by team members across the workspace.
- Advanced Reporting via Power BI (Premium only): Enables deeper analytics and cross-plan reporting through Power BI datasets.
- Portfolio View (Premium only): Displays multiple plans in one dashboard, allowing managers to compare progress across projects.
- Timeline & Dependencies (Premium only): Adds schedule insights and visual task dependencies not available in the Basic version.
Microsoft Planner Dashboard for Project Management Limitations
Although the Microsoft Planner dashboard offers useful visual tracking, it has limitations that make it less effective for advanced project management. Large teams or complex projects may require more powerful tools for analytics and reporting. Below are some of the main drawbacks of using the Microsoft Planner dashboard for project management.
- Lacks detailed reporting and analytics features
- Does not track dependencies between tasks
- Limited customization for dashboard views
- Cannot display data from multiple plans at once
- Offers no resource workload visualization
- Performance slows with large data sets
- Provides minimal export or sharing options
- Not ideal for long-term strategic tracking
Related: 5 Free Excel Dashboard Templates
How to Make a Microsoft Planner Dashboard with ProjectManager
Microsoft Planner users looking for a dashboard with dynamic features can instead use ProjectManager. First, sign up for a free 30-day trial. There’s no credit card required, and you get plenty of time to explore the software.
1. Export for Microsoft Planner Project
First, navigate to the board view in Microsoft Planner and export the plan as an Excel spreadsheet, CSV or MPP file. This captures all task data, deadlines and assignments so they are ready to import into ProjectManager.
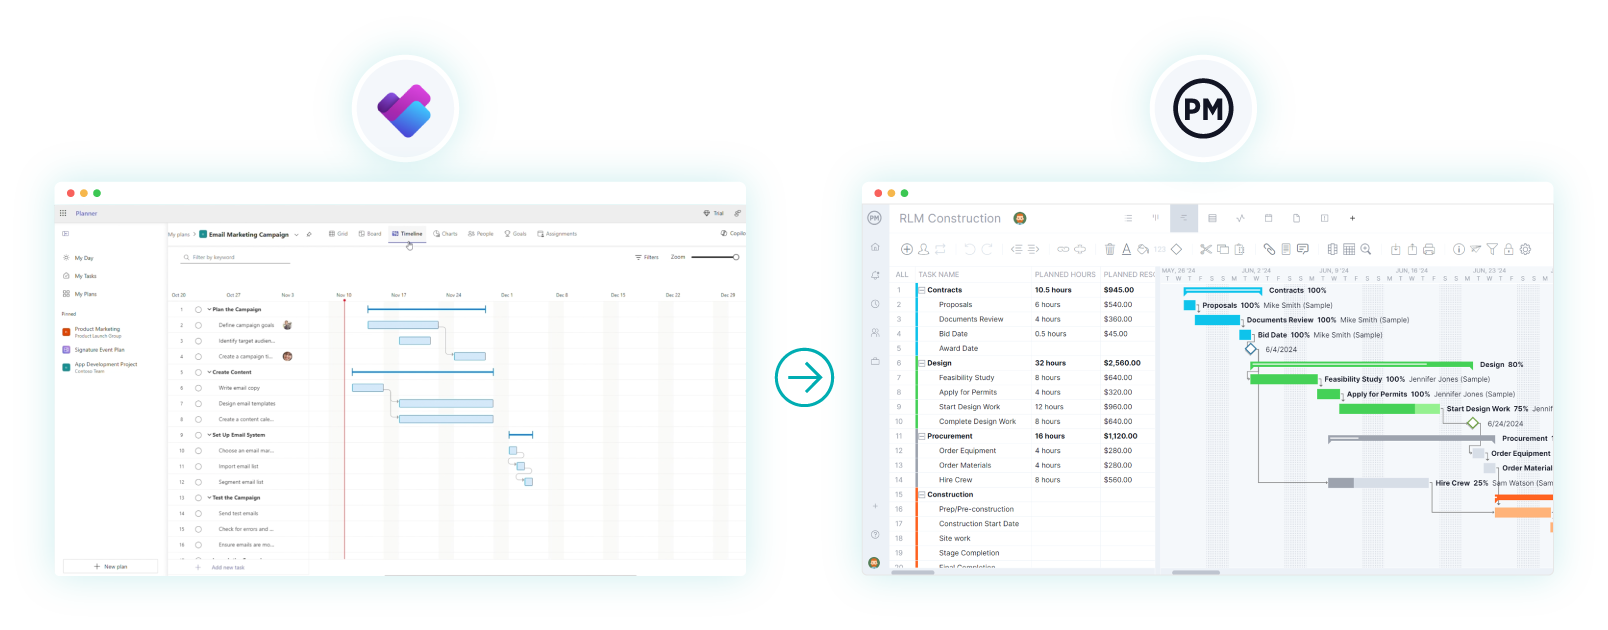
2. Select the File to Import
Open ProjectManager and navigate to the Gantt chart and click the import icon. A popup will appear where you can select the file you exported from Microsoft Planner. Choose your Excel, CSV or MPP file to continue.

3. Choose Import Options
Decide if you want to add the imported data to a project that exists or create a new one altogether. If adding the data to an existing project, select which one and choose whether to keep or replace the current project data.
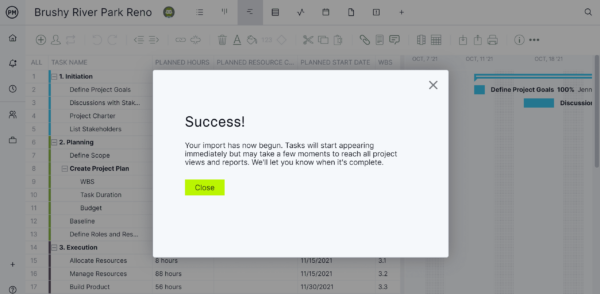
4. Import the Data Into ProjectManager
The next step is specifying whether you want to import all project information or only the task list. Choose your selection and click “next” to start the import process.
5. Customize Your Microsoft Planner Dashboard
Once the import is ready, your dashboard is ready to use. You can view the imported data in any of our project views and add more data to ensure your team is aligned on progress.
Free Project Dashboard Template
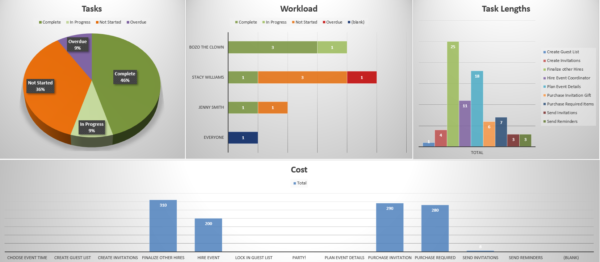
Want to try a dashboard before buying one? Download our free Excel-based project dashboard template. It’s designed to provide a comprehensive overview of your project’s status. This template allows you to track key performance indicators (KPIs) such as task progress, workload distribution and budget adherence. Visual aids like pie charts and bar graphs enable project managers to quickly assess their project health and make informed decisions. The dashboard is structured to capture essential data points, ensuring that all critical project aspects are monitored effectively.
While the Excel template offers a static snapshot of project metrics, ProjectManager’s online platform enhances this by providing real-time data updates. By uploading your Excel data into ProjectManager, you can leverage dynamic dashboards that automatically refresh as project details change.
This integration allows for continuous monitoring and more agile project management, ensuring that you’re always working with the most current information. For those seeking a more interactive and up-to-date project tracking experience, set up a free 30-day trial (no credit card necessary) and transitioning from the Excel template to ProjectManager’s platform can offer significant advantages.
What Does the Microsoft Planner Dashboard Show?
If you’re still interested in the Microsoft Planner dashboard, then it’s important to understand what metrics it tracks when managing projects. Below is a list of what users see when they open the tool.
- Task Status Overview (Basic & Premium): A pie chart showing how many tasks are Not started, In progress, or Completed.
- Task Distribution (Basic & Premium): Visual breakdowns by bucket, assignee, or label to understand task allocation.
- Due Date Insights (Basic & Premium): Highlights overdue, upcoming and completed tasks to track schedule performance.
- Individual Workload View (Basic & Premium): Displays each team member’s assigned tasks and their completion progress.
- Plan Progress Summary (Basic & Premium): Shows the percentage of tasks completed per plan.
- Cross-Project Portfolio Summary (Premium only): Aggregates data from multiple plans into a single executive-level dashboard.
- Power BI Integration View (Premium only): Connects data to Power BI dashboards for customizable reporting and trend analysis.
ProjectManager’s Project, Team and Portfolio Dashboards Are Better Than the Microsoft Planner Dashboard
ProjectManager offers live dashboards that automatically collect and display project data in real time, giving managers instant visibility into performance. Unlike the Microsoft Planner dashboard, which provides only basic task visuals, our dashboards track key metrics such as task progress, budget health and team performance across multiple projects. This unified view helps project leaders make informed decisions faster, ensuring every phase of work stays aligned with goals and deadlines.
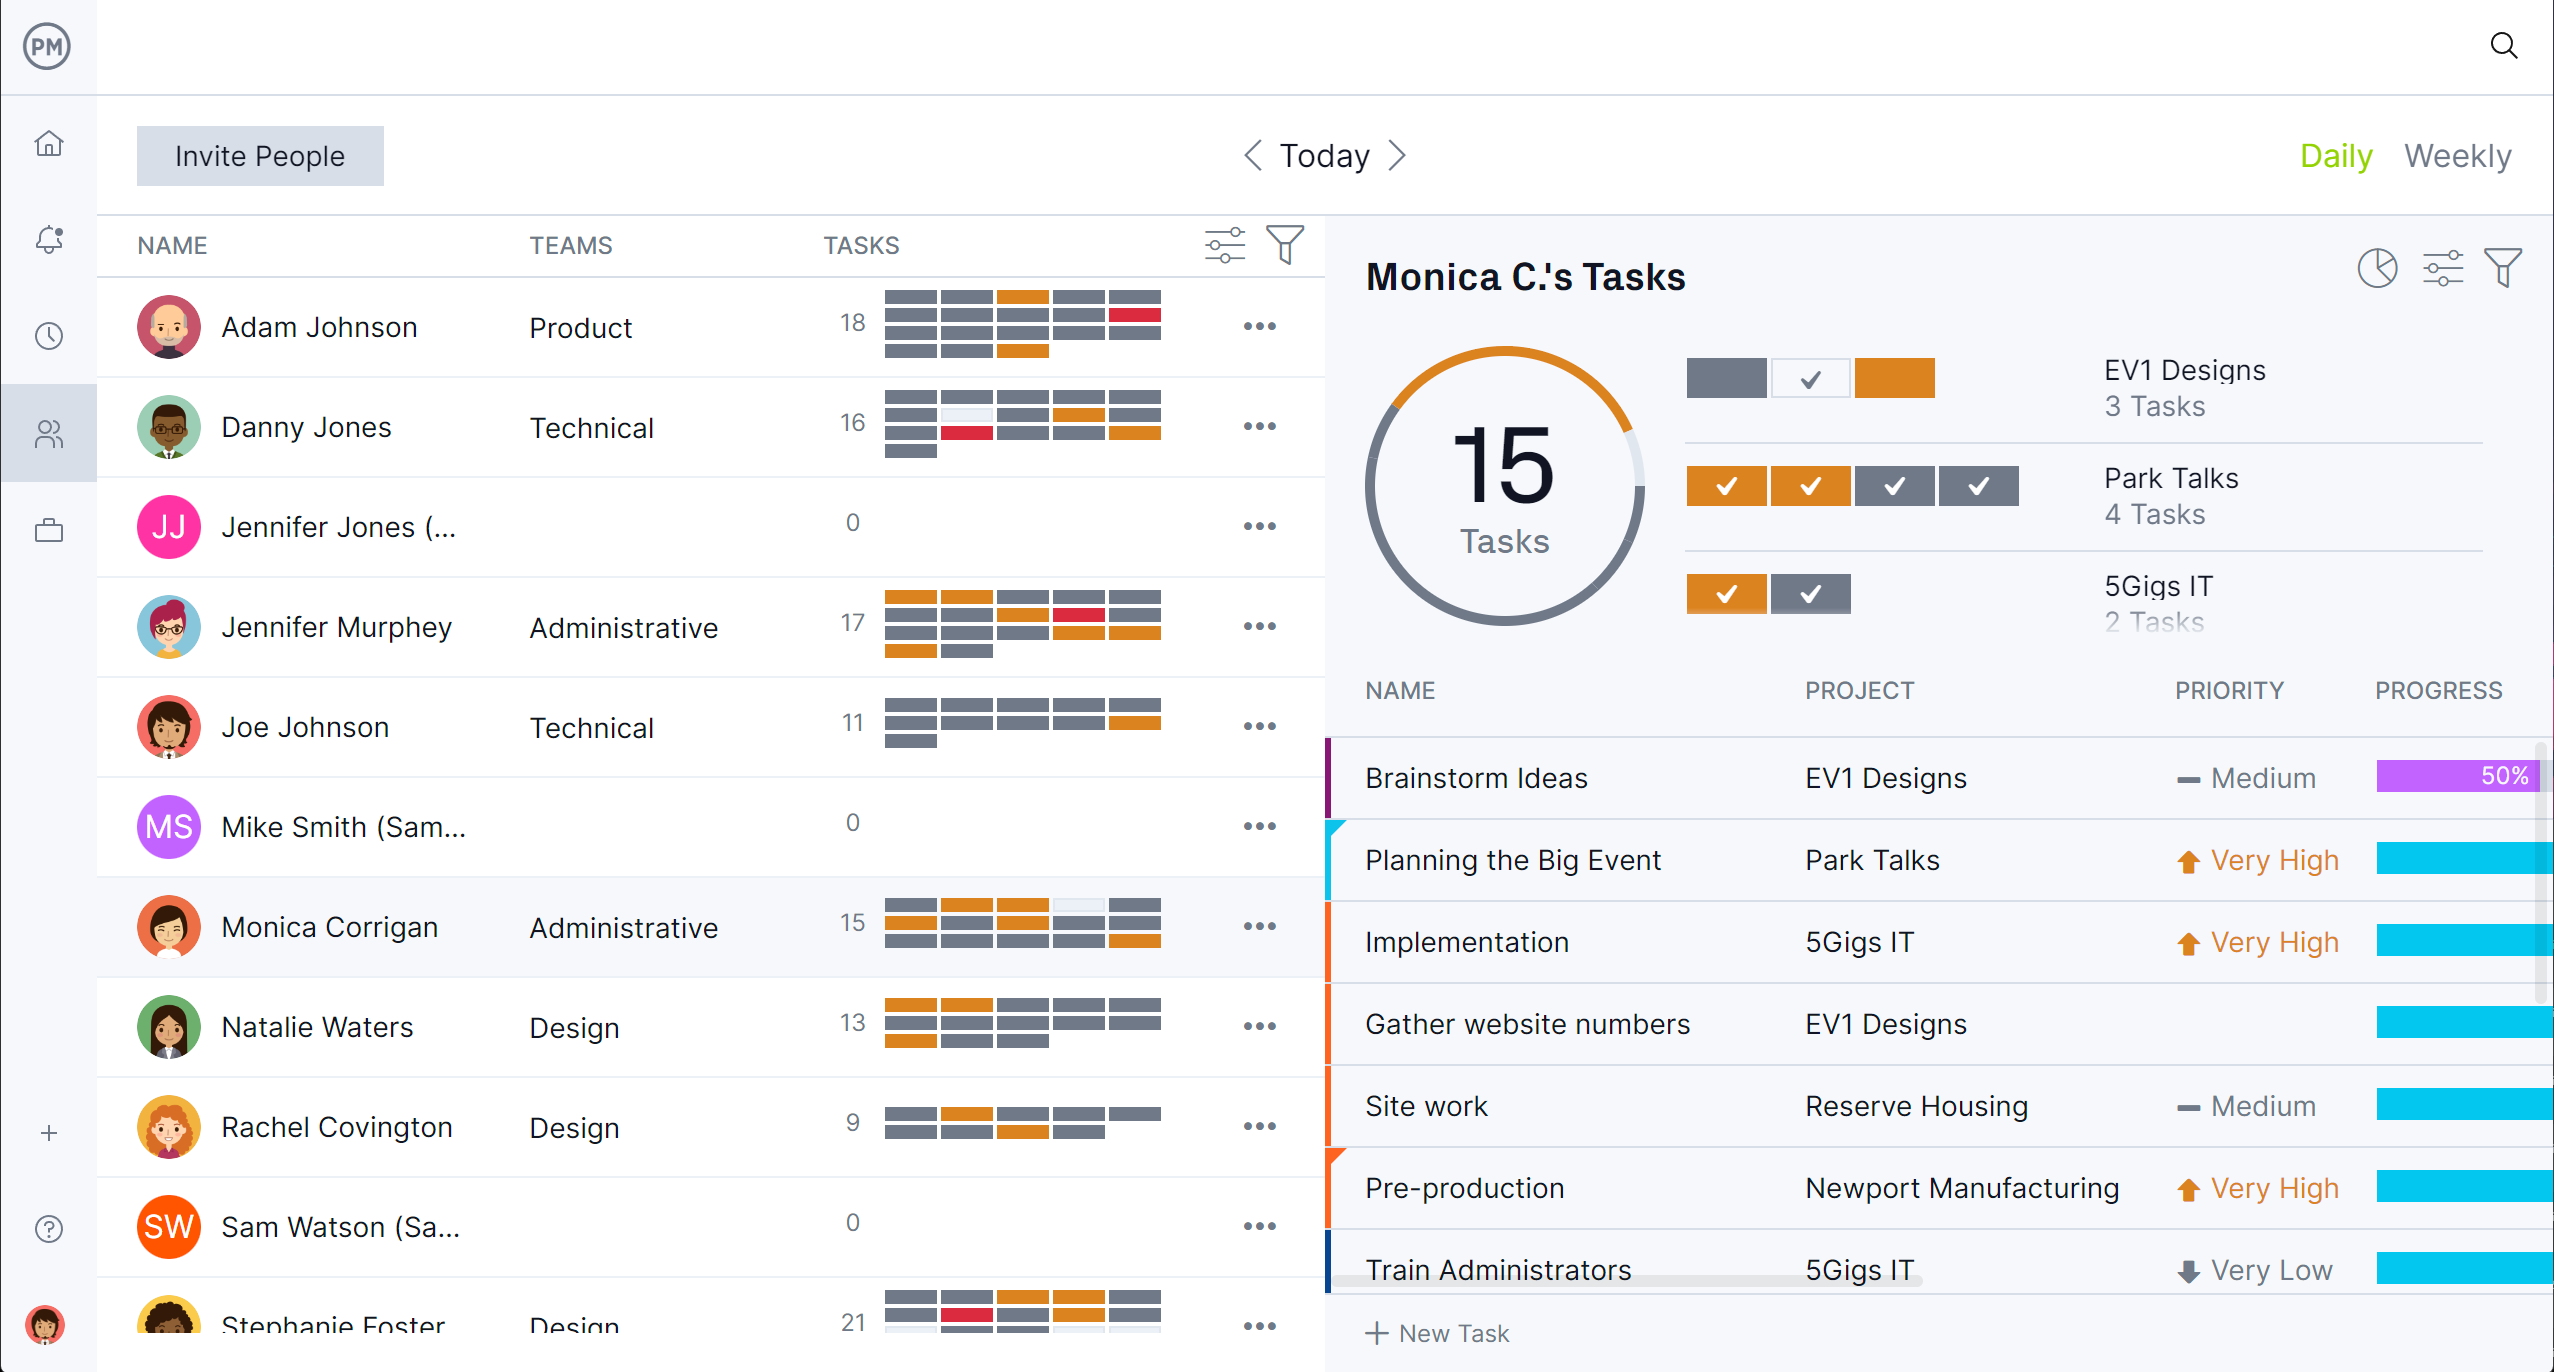
Visualize the Workload of Team Members in Real Time
With ProjectManager, managers can see exactly who is overloaded and who has capacity using color-coded workload charts and team dashboards. This feature makes it easy to reassign tasks or balance workloads to avoid burnout. The platform supports resource forecasting, helping teams plan and optimize efficiency across departments, something the Microsoft Planner dashboard doesn’t provide at the same level of depth or clarity.
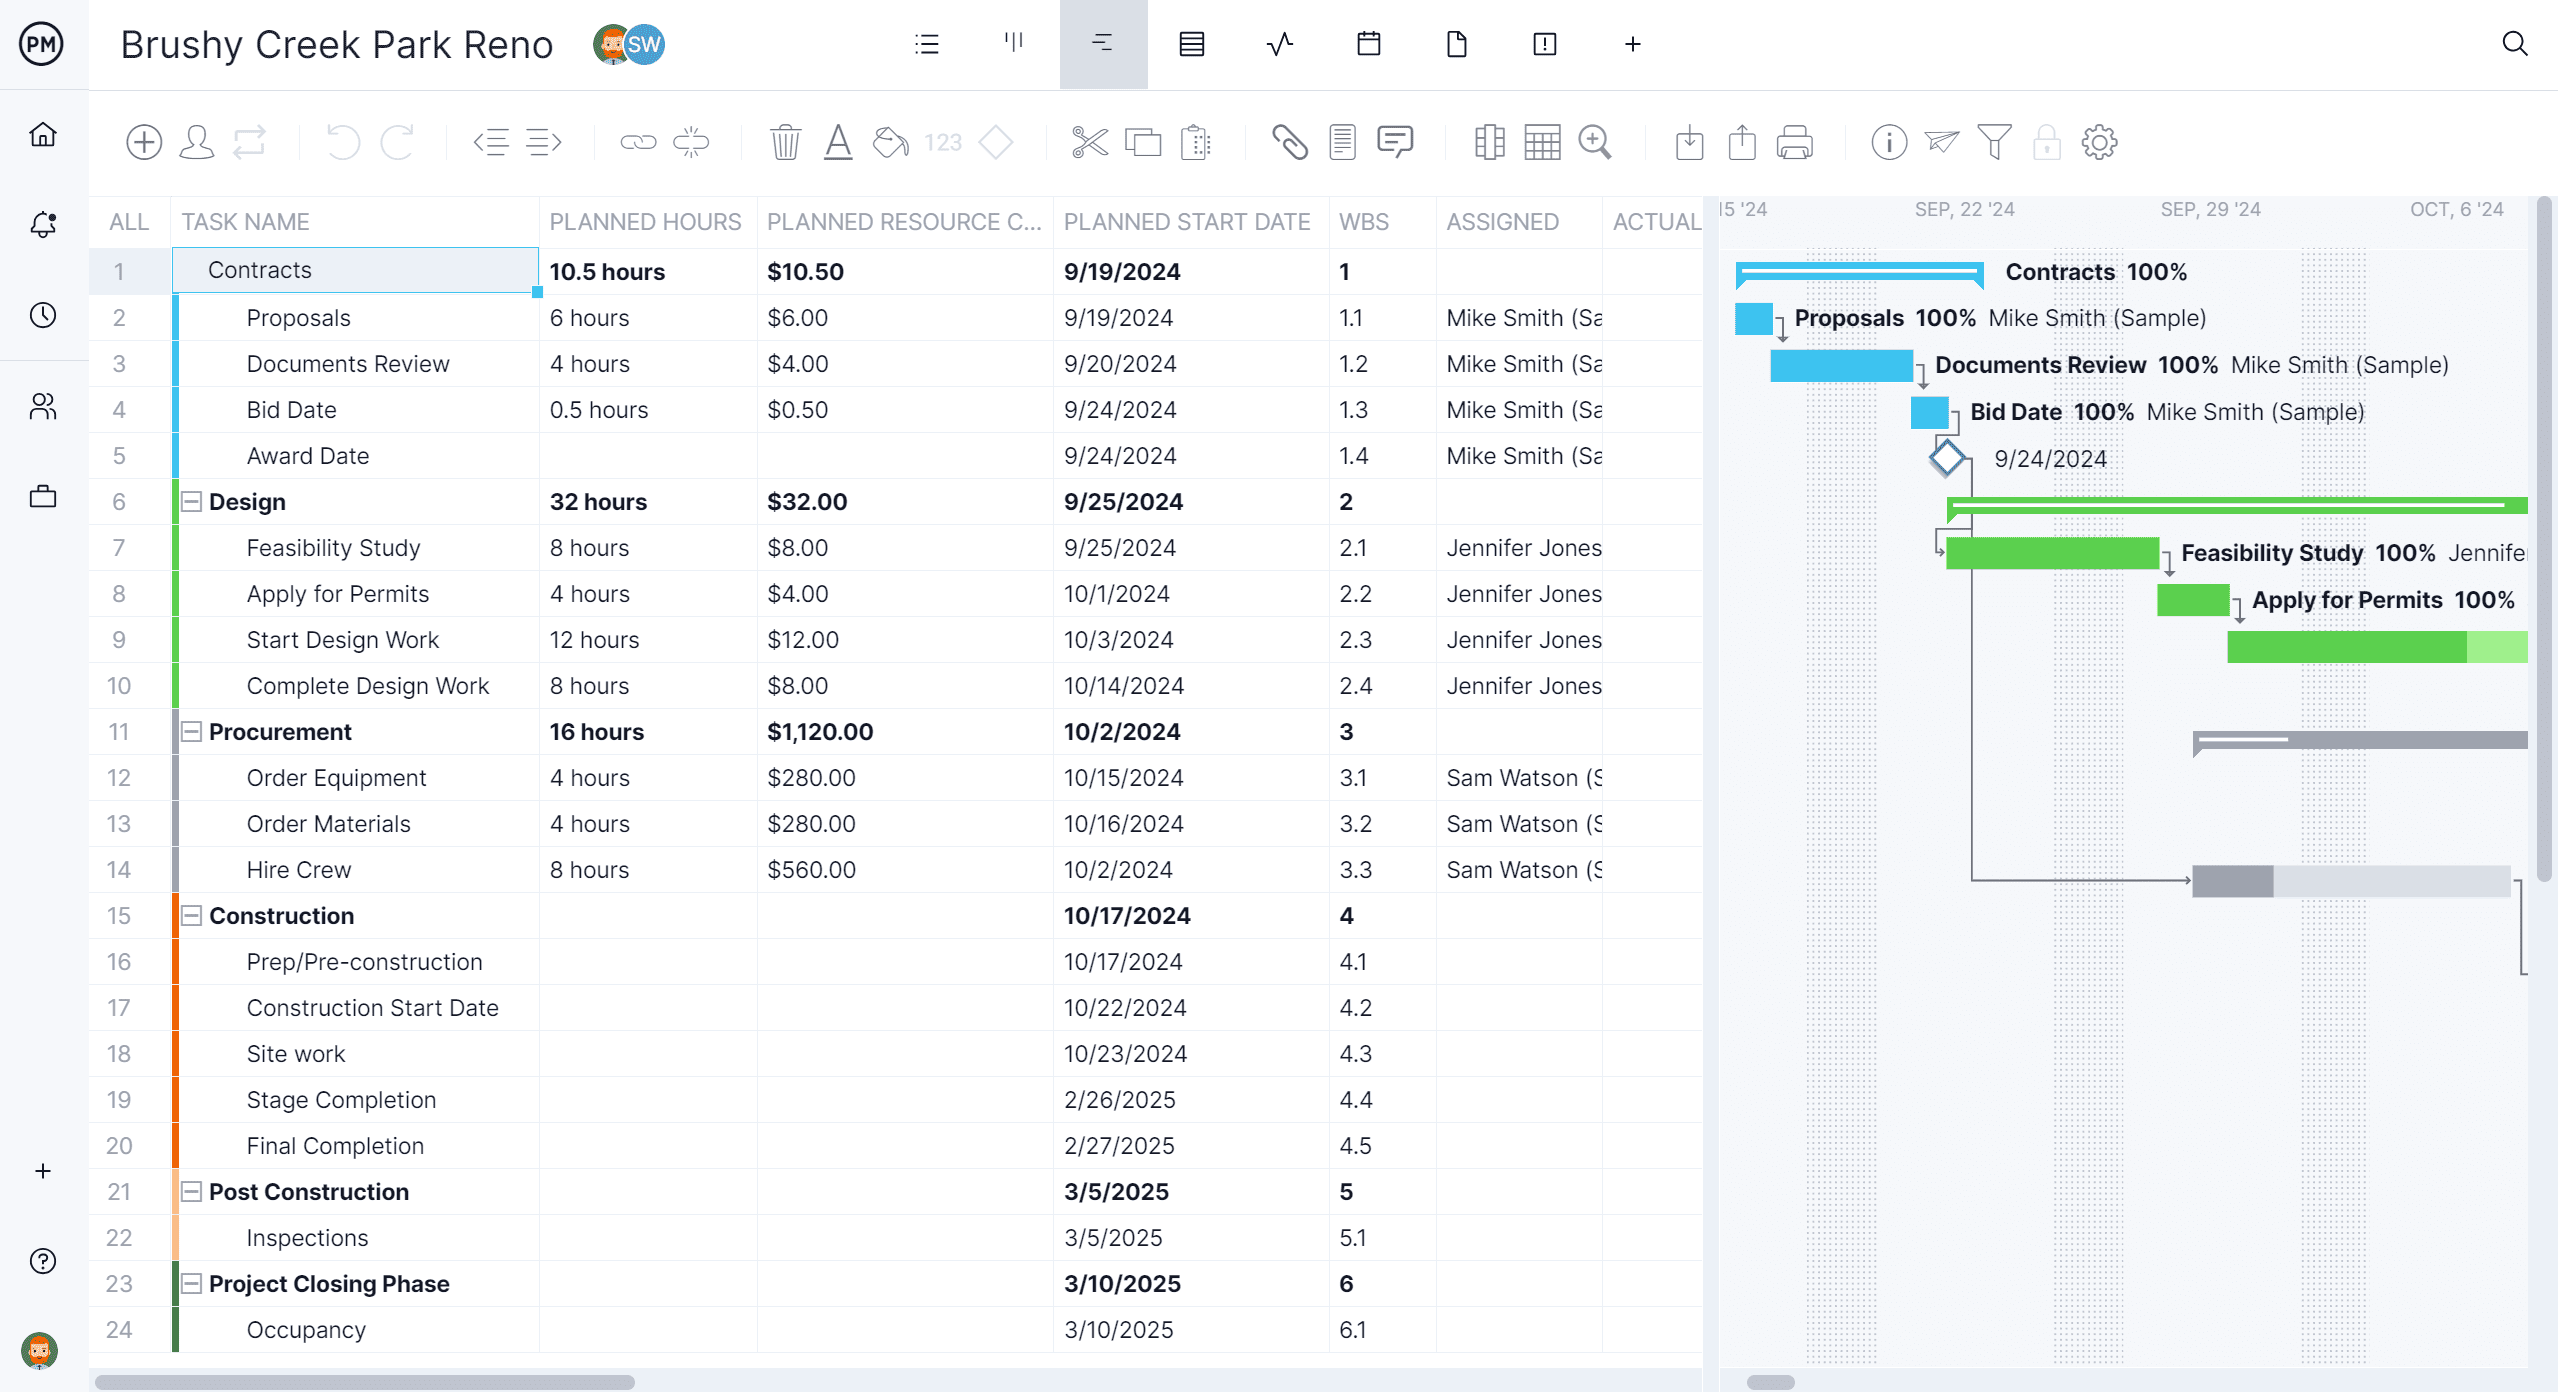
Plan on Gantt Charts and Track Costs with Timesheets and Project Reports
ProjectManager’s integrated timesheets and AI-powered reports give users precise insight into labor costs, project expenses, and financial performance. Every hour logged automatically feeds into reports and dashboards, providing real-time cost tracking without manual updates.
Managers can monitor spending, compare planned versus actual costs, and identify financial risks early. This starts by scheduling tasks, resources and costs on robust Gantt charts that link dependencies, filter for the critical path and set a baseline to track progress in real time.
Pros of Using the Microsoft Planner Dashboard for Project Management
The Microsoft Planner dashboard gives teams a visual way to monitor progress, track performance and manage workloads. It consolidates key project data into one place, helping managers identify bottlenecks and prioritize tasks efficiently. Here are the main advantages of using the Microsoft Planner dashboard for project management.
- Provides a quick visual overview of team performance
- Displays task status and progress at a glance
- Helps managers identify overdue or at-risk tasks easily
- Improves accountability with assigned task visibility
- Integrates well with Microsoft Teams and Outlook
- Encourages team collaboration through shared dashboards
- Allows filtering and grouping tasks by status or owner
- Supports real-time updates for accurate tracking
Microsoft Planner Dashboard FAQs
The Microsoft Planner dashboard raises common questions about its capabilities, compatibility and pricing. While it offers basic visualizations for tasks and timelines, it has limitations compared to more advanced project management tools.
Can You Open MPP Files Using the Microsoft Planner Dashboard Feature?
No, the Microsoft Planner dashboard cannot open or edit MPP files. MPP is a proprietary Microsoft Project format, so users need Project Online or Project Professional to view these files. Planner is limited to its own tasks and projects within Microsoft 365.
Is Microsoft Planner Dashboard Free?
Yes, Microsoft Planner is included with most Microsoft 365 business subscriptions, so there is no additional cost. However, it requires a paid Microsoft 365 plan to access the dashboard feature, and some advanced integrations may need higher-tier subscriptions.
What Is the Difference Between Microsoft Planner Basic and Microsoft Planner Premium?
Planner Basic provides core task management and timeline views, while Planner Premium adds enhanced reporting, workflow automation, and larger storage capacity. Premium is designed for teams requiring more advanced oversight, though it still lacks advanced resource management and customizable dashboards compared to professional project management software.
Related Microsoft Planner Content
There’s more than the Microsoft Planner dashboard. For readers who are curious what this replacement for Microsoft Project is all about can check out the links below. Some articles review the product, its Gantt chart and much more.
- How to Use Microsoft Planner: A Quick Guide
- Microsoft Planner Gantt Chart: How to Make a Gantt Chart In Microsoft Planner
- 11 Best Microsoft Planner Alternatives of 2025 (Free & Paid)
- Microsoft Planner Timeline: Key Features, Pros & Cons
- What Is Microsoft Planner Premium? Uses, Features and Pricing
- Microsoft Planner vs. Project: In-Depth Software Comparison
ProjectManager is online project and portfolio management software that connects teams, whether they’re in the office or out in the field. They can share files, comment at the task level and stay updated with email and in-app notifications. Get started with ProjectManager today for free.
