Planning is the bedrock of project management. As you execute the needed tasks, you’ll reach your objective by producing the final deliverable. One of the most basic yet critical tools for doing this is the Gantt chart.
Many use Microsoft products to organize and manage their work. But does Microsoft Planner have a Gantt chart? It’s not that you can’t get things done without a Gantt chart, but a Microsoft Planner Gantt chart would be an essential tool for any large, complex project.
What Is Microsoft Planner?
Before we discuss a Microsoft Planner Gantt chart, let’s take a moment to understand the product. Microsoft Planner is part of the larger suite of tools offered by Microsoft in its Microsoft 365 family of productivity software. It’s specifically designed to help with work management.
As the name suggests, Microsoft Planner allows you to plan tasks and manage small projects. It helps you assign tasks and organize their timeframes, such as setting deadlines. The tool is used for team communication and files can be shared among the team members.
Microsoft Planner has the advantage of seamlessly integrating with the suite of tools offered in MS 365 such as Outlook, SharePoint, Teams and other tools. It can be used for agile projects by organizing tasks by topic in a task list that resembles a kanban board. There’s a calendar to view your schedule and a dashboard to track your work.
Does Microsoft Planner Have a Gantt Chart?
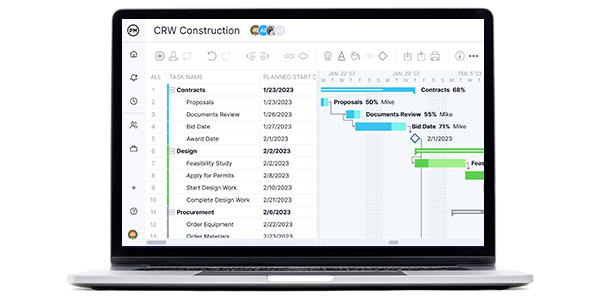
But the question we’ve all been waiting for is, does Microsoft Planner have a Gantt chart? A Gantt chart is an essential project management tool. It looks like a spreadsheet on one side where tasks, duration, resources, costs and more are collected. On the right side, that data populates a timeline to show the project visually. Gantt charts are used to manage more traditional projects that are managed within a waterfall methodology. But even if the project team is working in an agile environment, more often than not, other departments and management are using a Gantt chart to manage the project.
Almost every project management software worth its price will have a Gantt chart of some level of functionality. There will likely be other tools, such as the task list seen in the Microsoft Planner or kanban boards, calendars, etc. The more project views available, the more project teams across departments will have the flexibility to collaborate on the project.
Short Answer: No, Microsoft Planner Doesn’t Have Gantt Charts. It Offers a Lightweight “Timeline” View Instead.
It’s a massive shortcoming that Microsoft Planner doesn’t have a built-in Gantt chart feature. Microsoft will try and convince you that a Gantt chart is easily made with the Microsoft Planner Premium version, also known as Planner Premium (Plan 1) but this isn’t the case. What MS Planner Premium really offers is a timeline view, a tool that mimics a Gantt chart and has a few Gantt-like features like task dependencies and milestones, but lacks advanced project scheduling features.
But don’t worry. ProjectManager, an award-winning project management software, has built-in Gantt charts that are ready to work when you are. Our Gantt charts go beyond the capacity of run-of-the-mill Gantt chart software. You can easily link all four types of task dependencies, filter for the critical path and set a baseline. Now you can track your planned effort against your actual effort in real time to stay on schedule. You can even import seamless import MPP and Excel files. Get started with ProjectManager today for free.
If you’re committed to making a Gantt chart with Planner, unfortunately, there aren’t easy add-ons or plugins that Microsoft Planner has to help you with creating a Gantt chart, besides the timeline view that comes with Microsoft Planner Premium. The workaround for the offer is to leave the app and build a Gantt chart on a spreadsheet. Have you ever tried to build a Gantt chart on a spreadsheet? It’s very involved, takes a lot of time and only results in a static document that’s hard to edit and share. It’s enough to turn you away from Gantt charts forever.
How to Make a Microsoft Planner Gantt Chart With ProjectManager
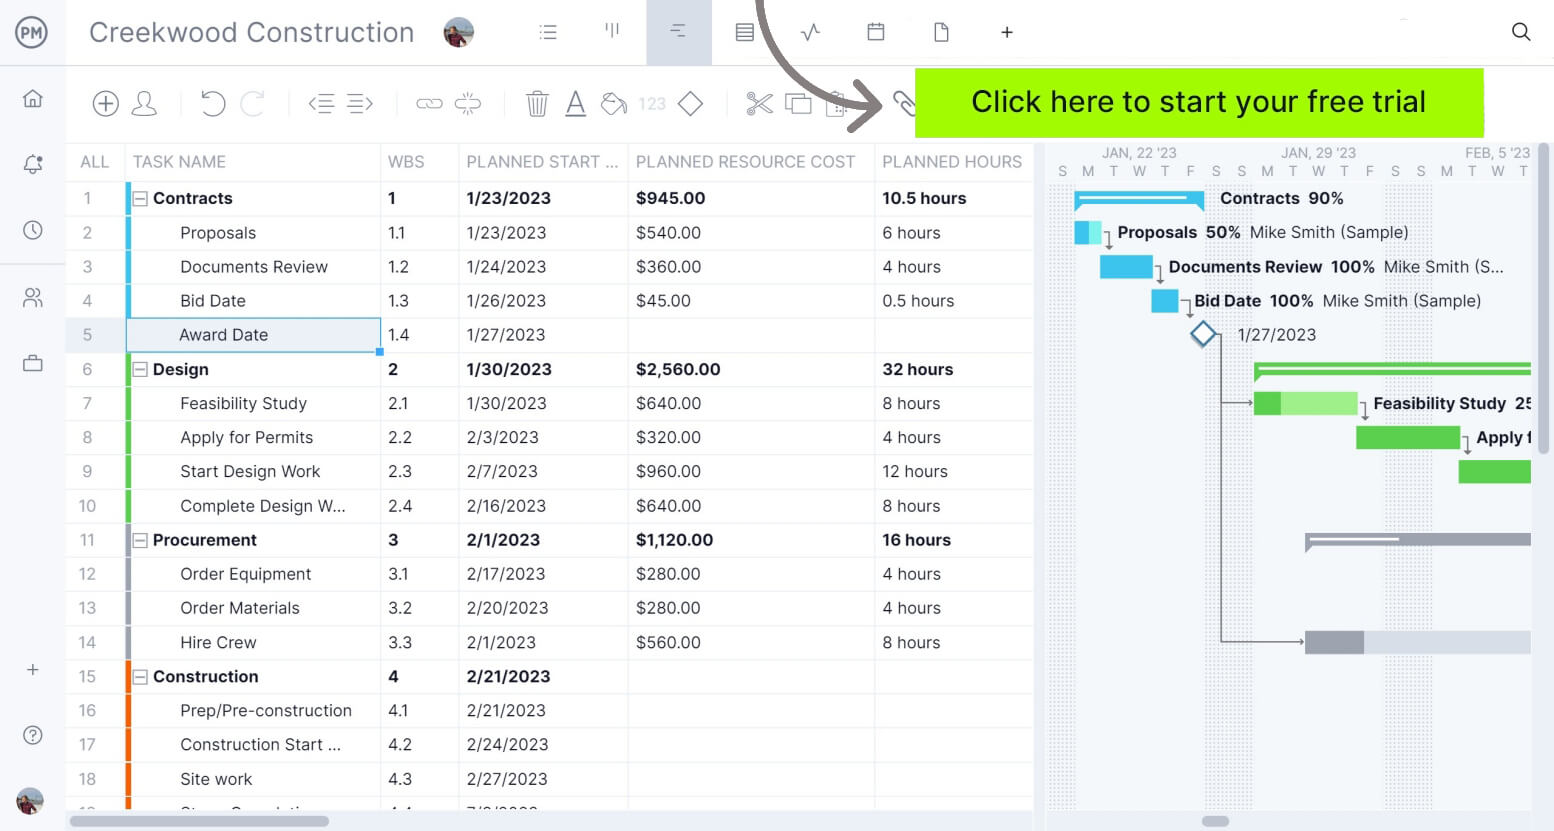
If you’re using Microsoft Planner and you want to make a Gantt chart, there’s a way to do it. First, you have to sign up for a free trial with ProjectManager. There’s no credit card needed. You get 30 days to play around with our project management and Gantt chart software.
1. Use ProjectManager to Export Your Microsoft Planner Project as an Excel, CSV or MPP File
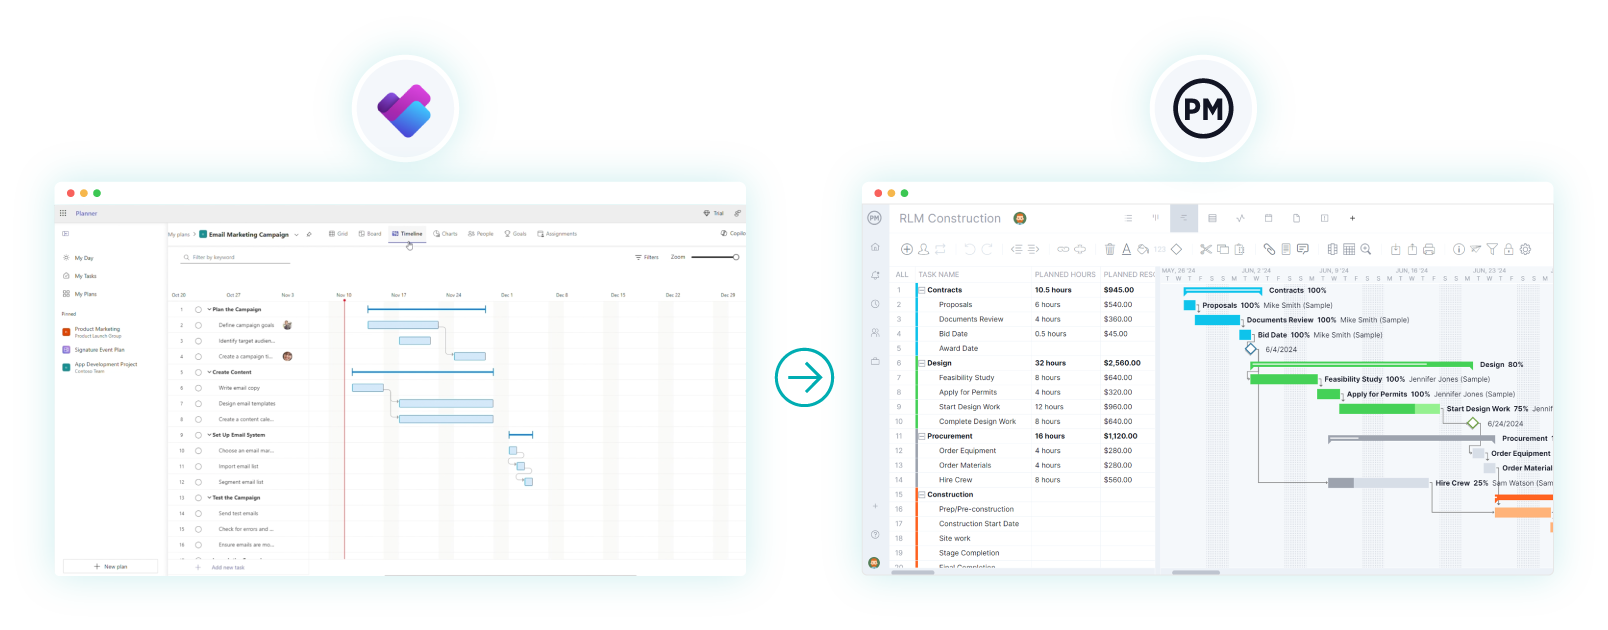
Go to the board view in Microsoft Planner. Here, you can export your plan as an Excel spreadsheet, CSV or MPP file. It’ll hold all your data and be ready for importing into ProjectManager and viewing on our Gantt chart.
2. Choose the Excel, CSV or MPP File You’d Like to Import
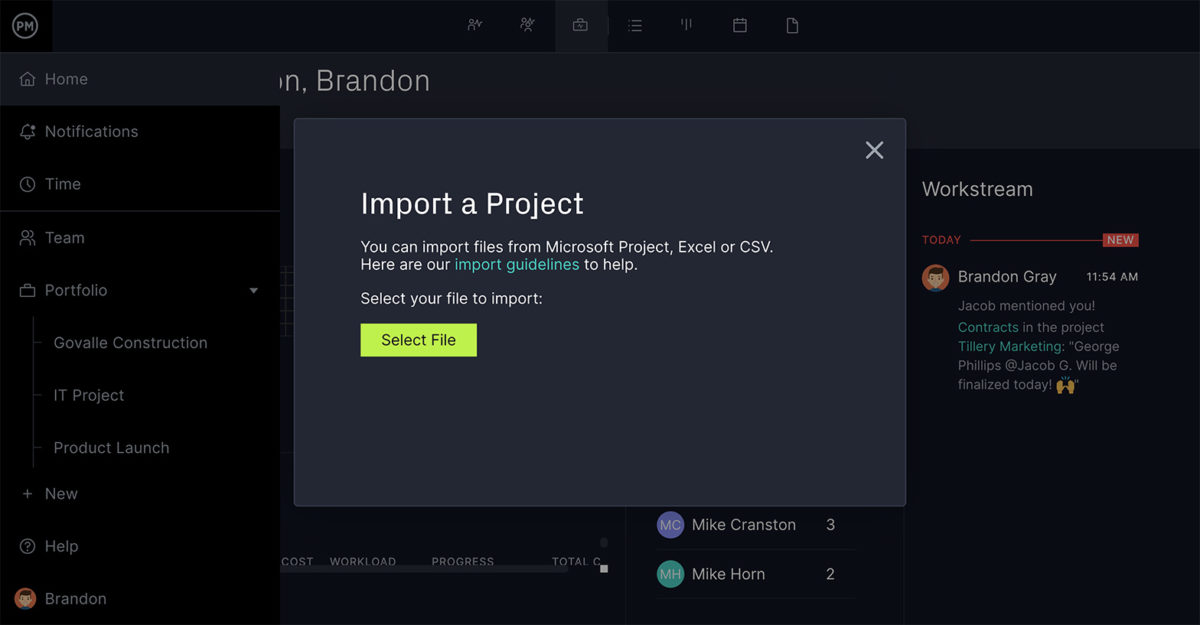
On the Gantt chart project view in ProjectManager, you’ll see an import icon. Click it and a popup window will ask you which file you want to import. Choose the Microsoft Planner file you exported.
3. Select Options
The next step is when you choose to add it to an existing project you have on ProjectManager or as a new project. If you’re adding to a project, choose which one and decide whether to keep or delete the existing data.
4. Import Into ProjectManager
Now you’ll want to choose the data to import. A popup window will ask if you want to import all the data or only the task list. Make your choice and click next.
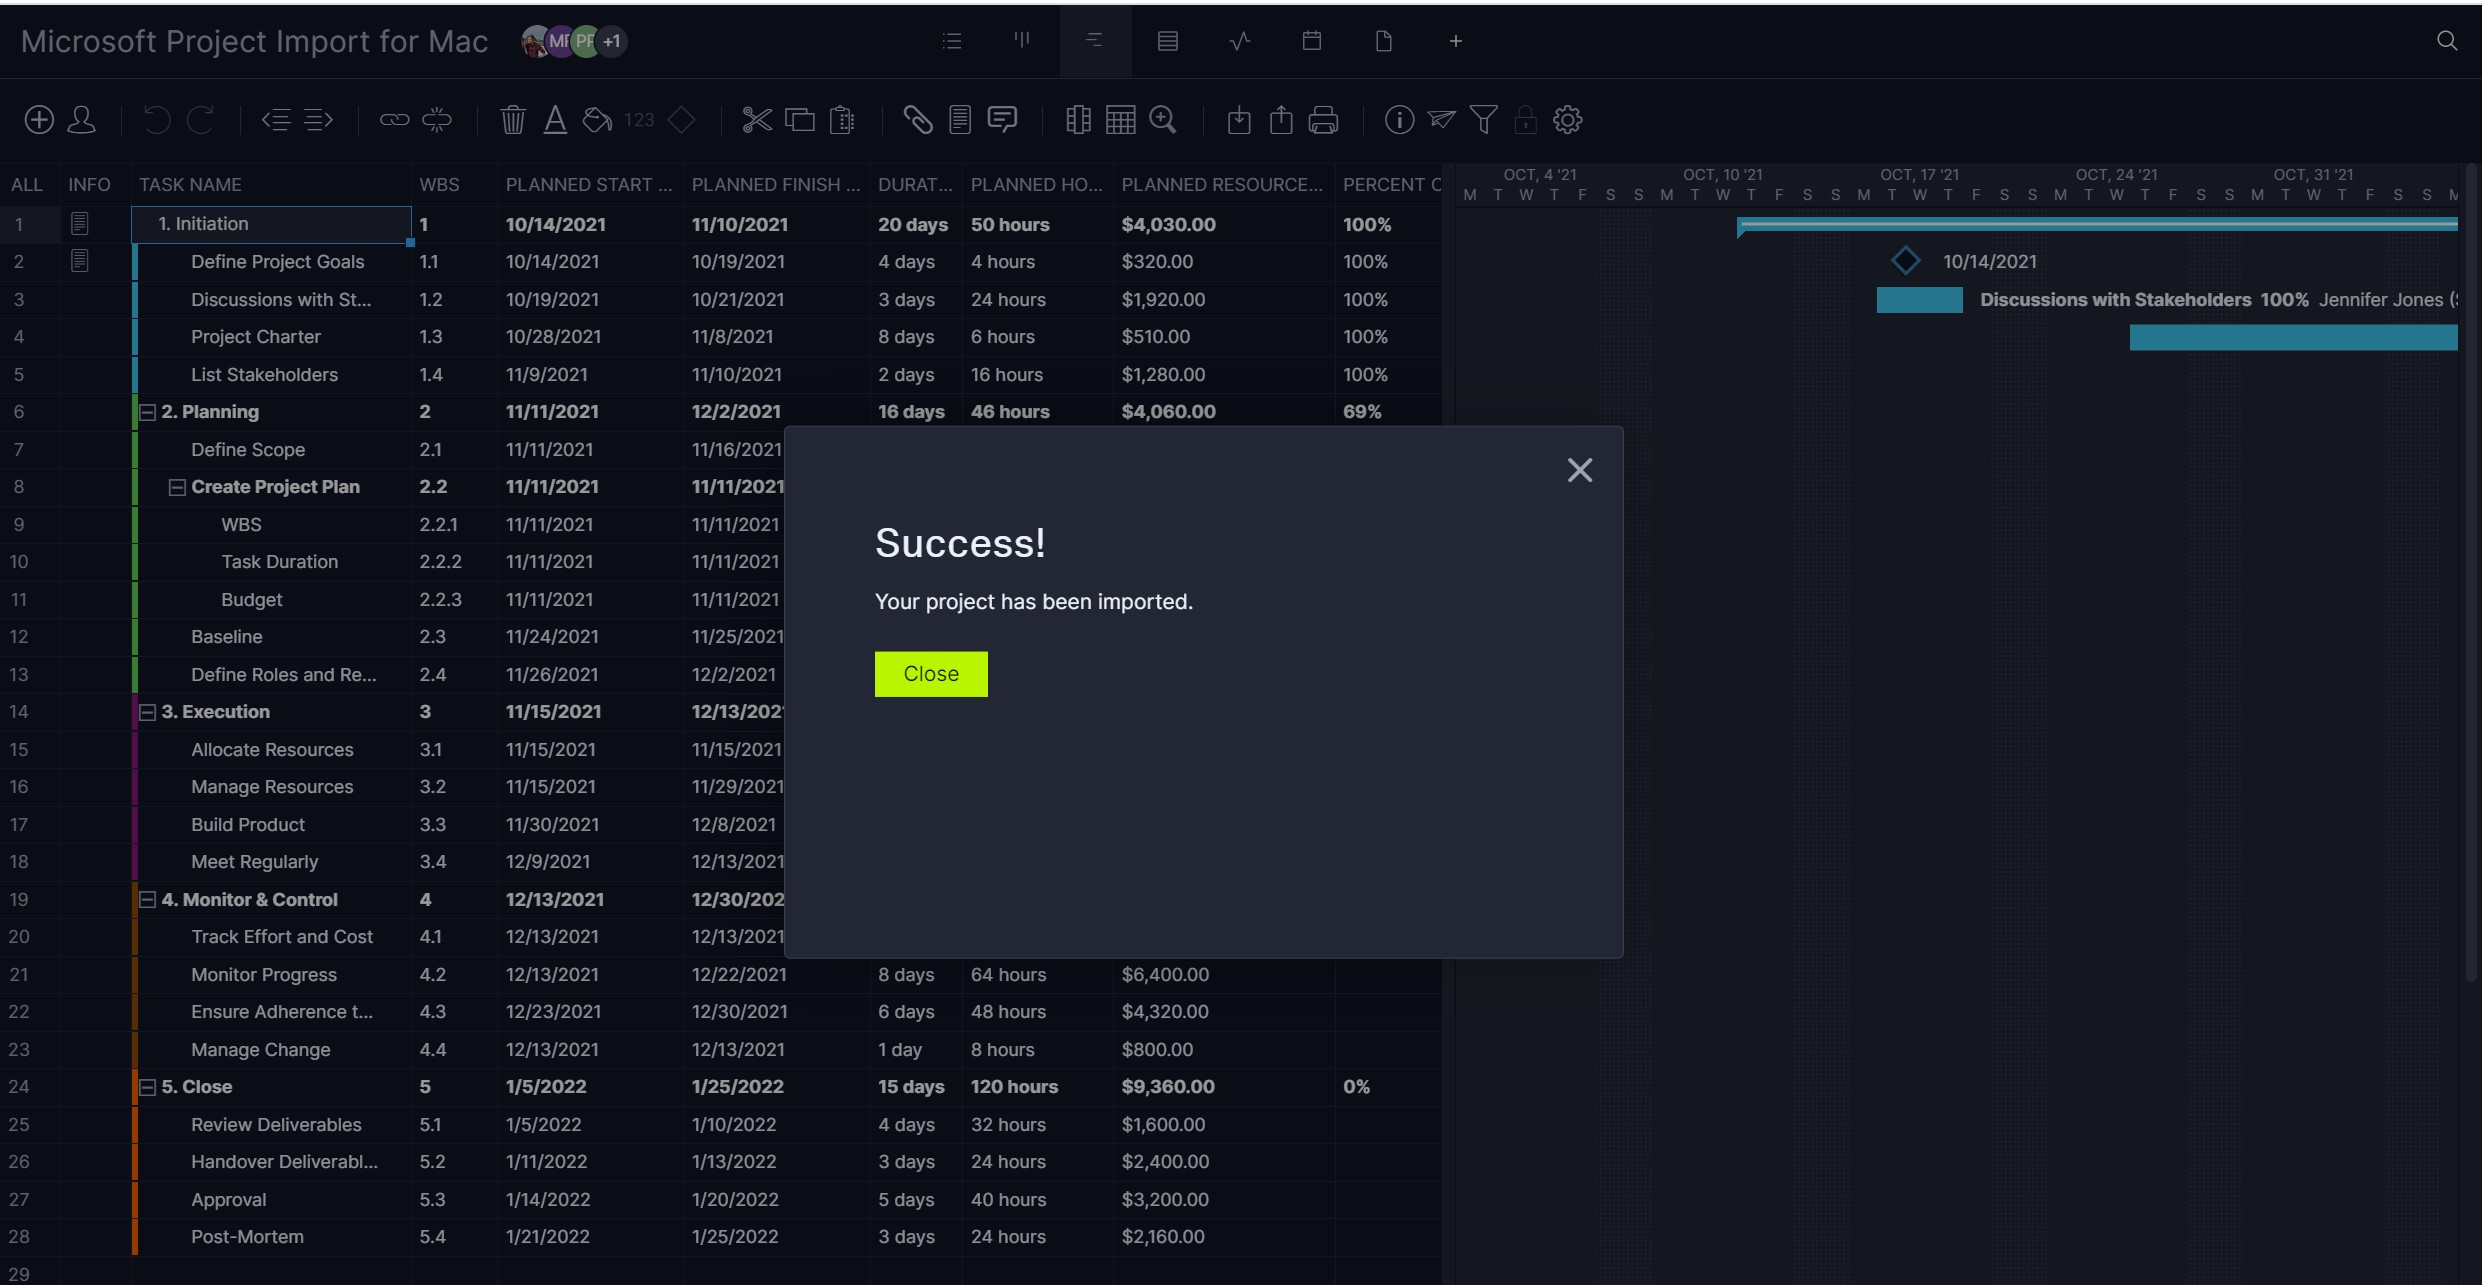
5. Customize Your Microsoft Planner Gantt Chart With ProjectManager
When you see the success window, you’re ready to manage your Gantt chart. You can add tasks, link tasks, indent and outdent, color phases and add dependencies, milestones, cost and resources.
Free Gantt Chart Template
Not ready to get started with a Microsoft Planner Gantt chart? Maybe you can start by using our free Gantt chart template for Excel. It will allow you to create a project timeline with ease. Simply enter your project tasks, their due dates and duration and the template will automatically create a Gantt chart for your project.
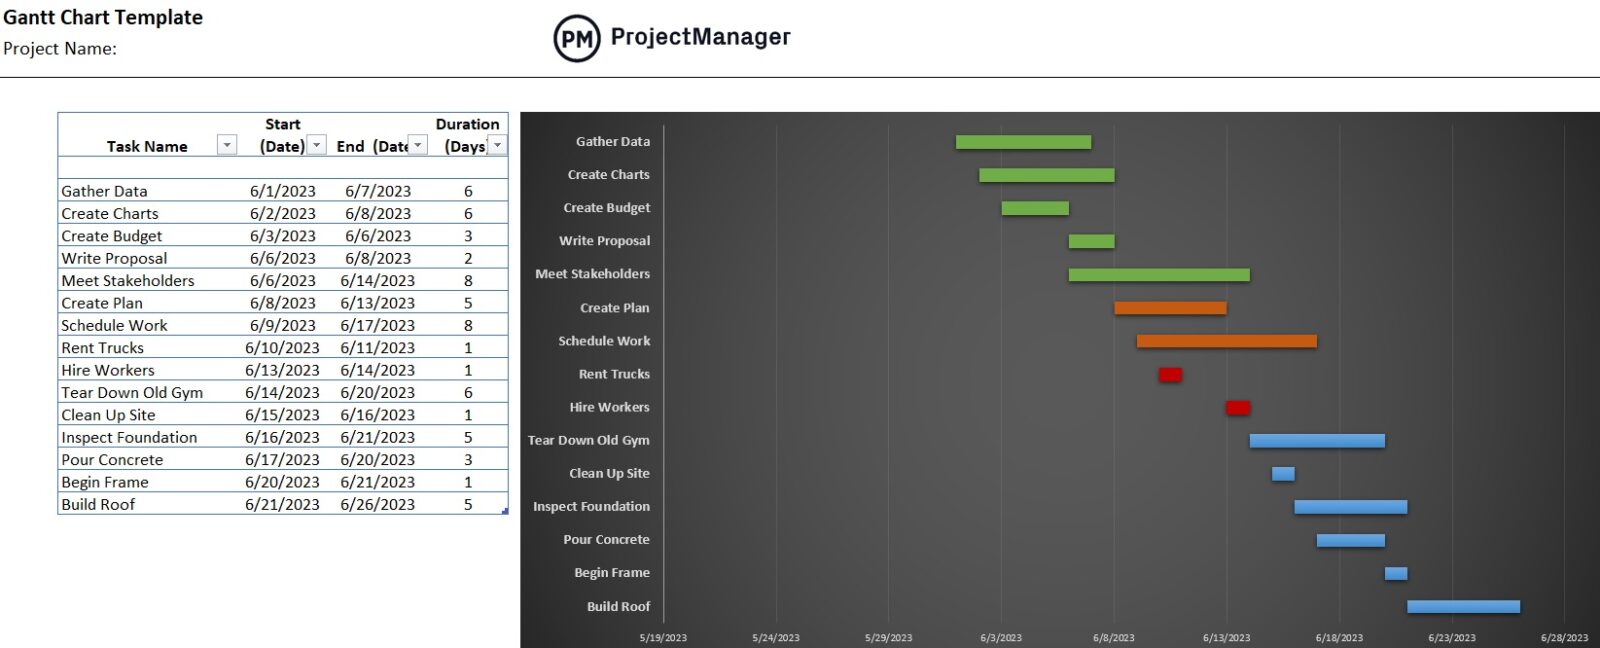
One advantage of this free Gantt chart template for Excel is that it’s compatible with Microsoft Planner and ProjectManager. So you can import the data from this template into ProjectManager and use its superior project planning, scheduling and tracking tools.
Microsoft Planner Gantt Chart FAQs
Microsoft Planner is a simple task management tool included with Microsoft 365, but many users wonder whether it supports advanced project scheduling features like Gantt charts. This FAQ explores how Planner handles timelines, dependencies, integrations, and costs—highlighting its limitations compared to full project management software such as Microsoft Project.
What is a Gantt chart in Microsoft Planner?
Microsoft Planner doesn’t offer a true Gantt chart view. Its “Schedule” view provides a basic calendar layout, showing task start and due dates, but it lacks dependencies, milestones, and timeline scaling. For complex projects requiring visualization of overlapping tasks and progress tracking, users must integrate with other Microsoft tools or use external Gantt chart software.
Can I Create Task Dependencies Using a Microsoft Planner Gantt Chart?
Planner doesn’t support task dependencies, critical path tracking, or automated timelines. Tasks can be scheduled individually with due dates, but you can’t link them or visualize sequential relationships. This makes managing interdependent projects difficult. To enable dependencies, users need to switch to Microsoft Project for the Web or Project Online, both offering true Gantt functionality.
Does the Microsoft Planner Gantt Chart Integrate with Microsoft Project?
Direct integration between Planner and Microsoft Project is limited. Although both tools exist within the Microsoft 365 ecosystem, Planner tasks can’t automatically sync into Project’s Gantt view. Workarounds like Power Automate flows or manual exports are required, which adds complexity and reduces real-time visibility—undermining the seamless integration expected between Microsoft’s planning products.
How Much Does the Microsoft Planner Gantt Chart Feature Cost?
Microsoft Planner is included with most Microsoft 365 business and enterprise plans at no additional cost. However, its Gantt chart capabilities remain locked behind higher-tier subscriptions like Project Plan 3 or Project Plan 5. These premium plans introduce advanced scheduling, dependencies, and reporting tools—features unavailable to standard Planner users relying on basic task visualization.
Microsoft Planner Basic Pricing Plans
The version included in most Microsoft 365 subscriptions. Good for lightweight task management. Starts from $6 to $22 per user per month, billed annually. Price varies depending on the Microsoft 365 subscription.
- Microsoft 365 Business Basic: $6.00/user/month, billed annually
- Microsoft 365 Business Standard: $12.50/user/month, billed annually
- Microsoft 365 Business Premium: $22.00/user/month, billed annually
- Microsoft 365 Apps for Business: $8.25/user/month, billed annually
Microsoft Planner Premium Pricing Plans
The next level up, for users or teams needing more advanced project management features.
- Planner Plan 1: $10/user/month, billed annually
- Planner and Project Plan 3: $30/user/month, billed annually
- Planner and Project Plan 5: $55/user/month, billed annually
For more detailed information about each of these Microsoft Planner plans and the features that are available for each pricing tier, visit our Microsoft Planner blog.
How to Use Your Microsoft Planner Gantt Chart in ProjectManager
Now that you’re using a real Gantt chart, it’s time to take a tour of the tool and learn what you can do with it. ProjectManager gives you control over your project that Microsoft Planner can only dream of.
Related: Best Gantt Chart Software: Free & Paid Options Ranked
There’s a reason our software has won awards for best project management software. Our Gantt chart goes beyond even what a decent Gantt chart software can do and, on top of that, you can track progress and performance, manage tasks, resources and risk, collaborate and so much more.
But let’s first focus on the Gantt chart and its capabilities. Here’s a short list of what ProjectManager can do when you import your Microsoft Planner into our Gantt chart software.
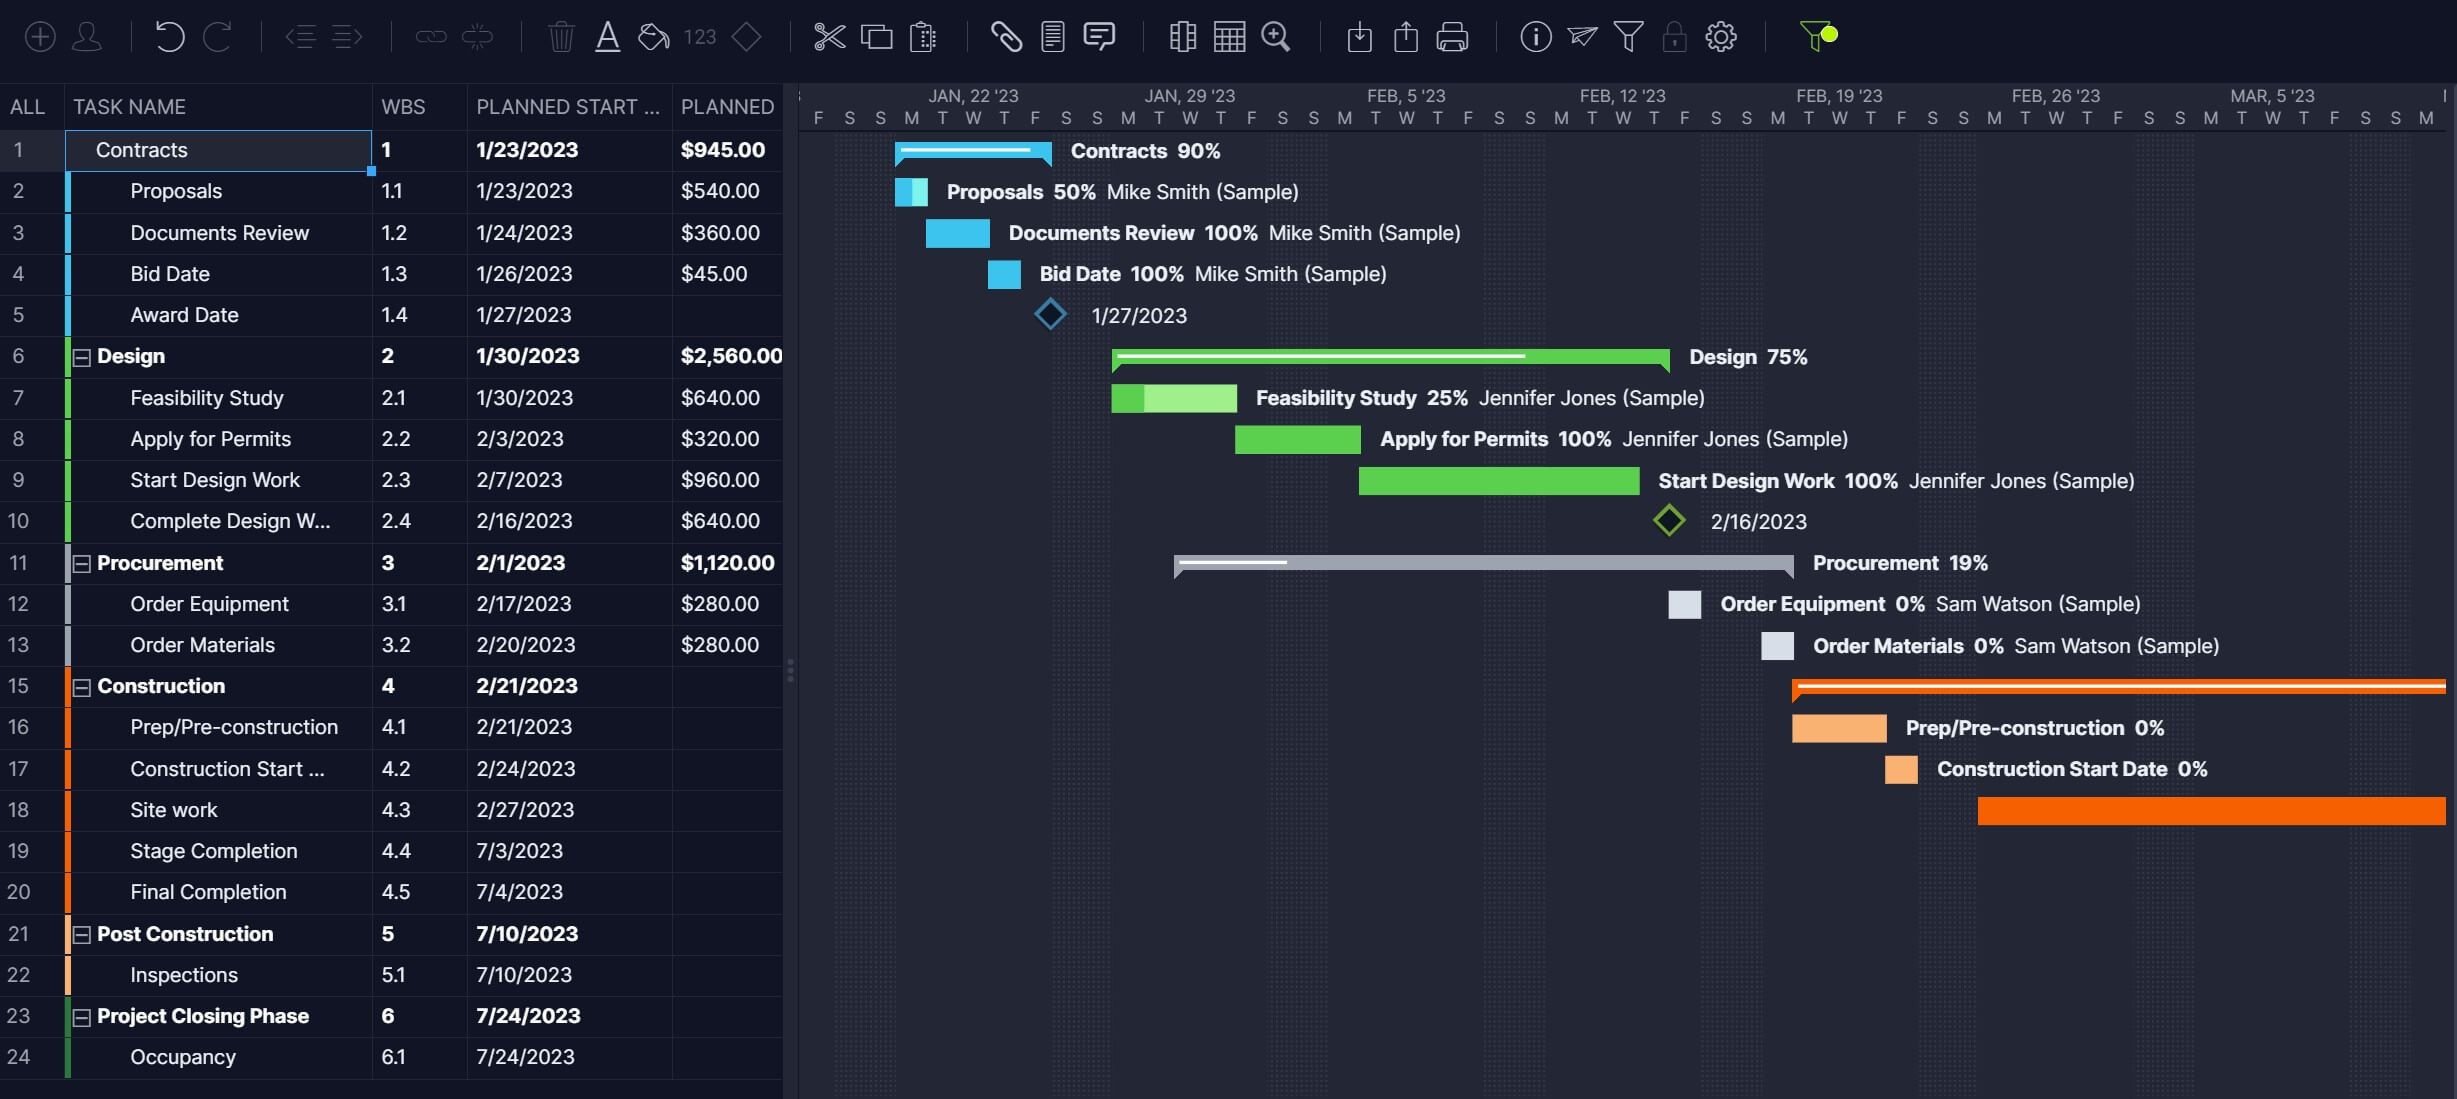
Set Milestones for Your Progress
Milestones are important dates, such as when one phase ends and another begins. They can also be used to indicate the delivery of important information, such as the project plan. To create a milestone, use the diamond icon to indicate where one lands on the Gantt chart timeline. Milestones not only divide the project into manageable parts, but they provide a way to track progress. Make sure to celebrate milestones to boost team morale.

Filter By Priority, Dependency and Tags
The difference between our Gantt chart and the one Microsoft Planner asks you to build on a spreadsheet is night and day. We give you full control over all the data, allowing you to filter your Gantt chart easily to see dependencies, priorities, tags and more. We also make it easy to link all four types of task dependencies. Just drag one to another and it’s done. You can also filter for the critical path. Try doing that on an Excel spreadsheet.
Our Gantt Chart Is All Yours
If you’ve used other Gantt charts in the past, you might think poorly about them. Yes, they’re important project management tools, but do they have to be so difficult to use? Our Gantt charts are simple to use. Drag-and-drop tasks to change due dates or start dates and it’s done. We automatically update the related tasks. If you’re having trouble getting started, use one of our many industry-specific templates to get a headstart. There isn’t a better or easier-to-use Gantt chart on the market.
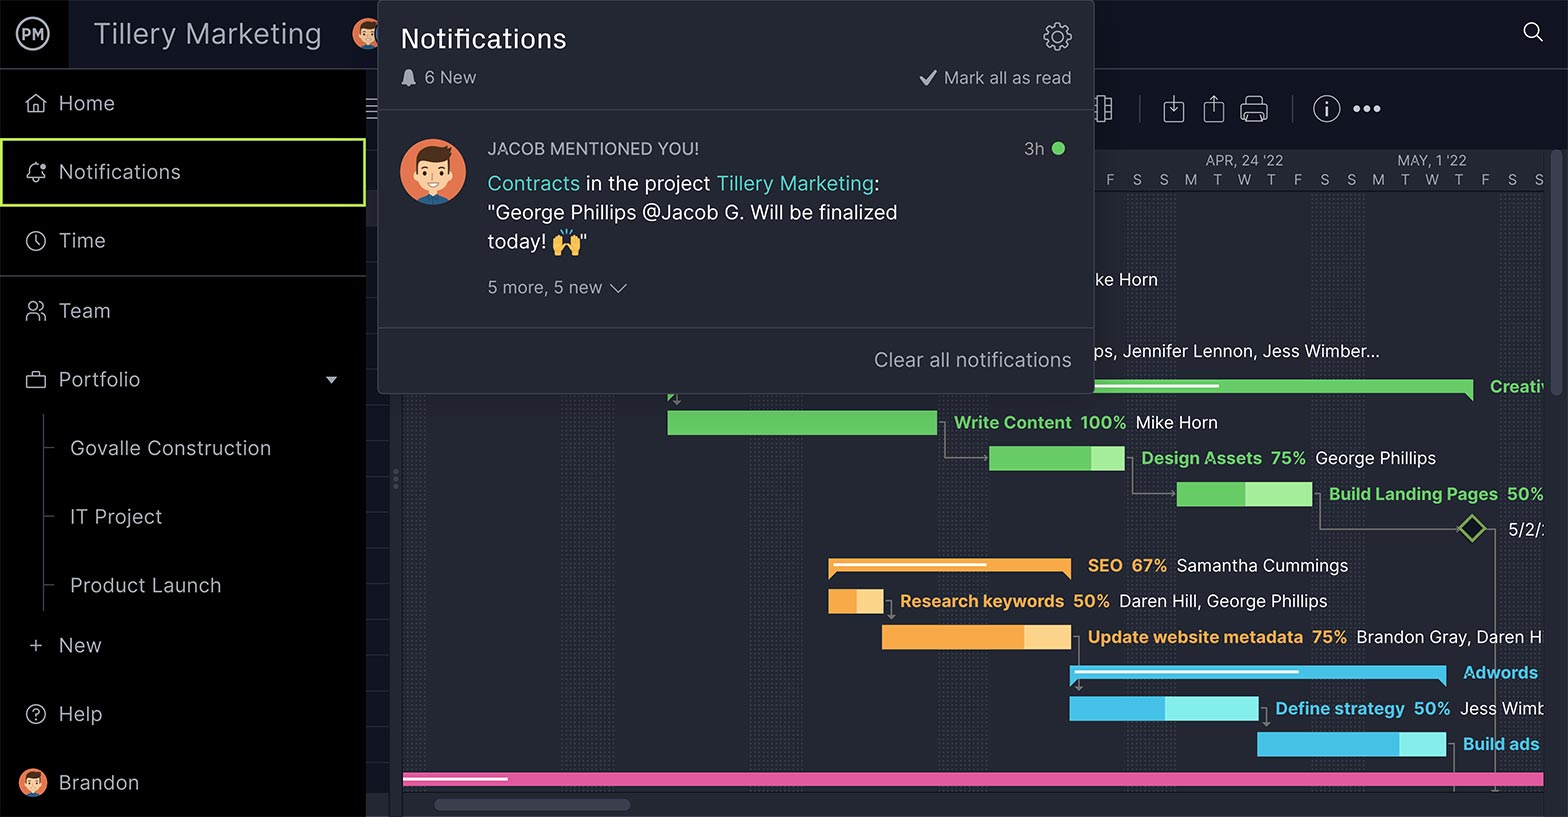
Get Notified of Progress
Another benefit of using our Gantt chart over a spreadsheet is that you can stay updated in real time if there are changes to the project schedule. If a task is updated or commented on and you’re assigned to it, you get instant notification, both by email and with an alert inside ProjectManager, if you don’t want to stop working.
Other Project Management Features from ProjectManager
As important as a Gantt chart is when managing a project, it’s only one of many project tools that every project manager and their team should have in their toolbox. ProjectManager understands the importance of diversifying and that different teams and departments use different tools.
That’s why we offer multiple project views, such as task lists, calendars and other project management features that work in conjunction with our Gantt charts to give you more control over your project. Here are just a few examples.
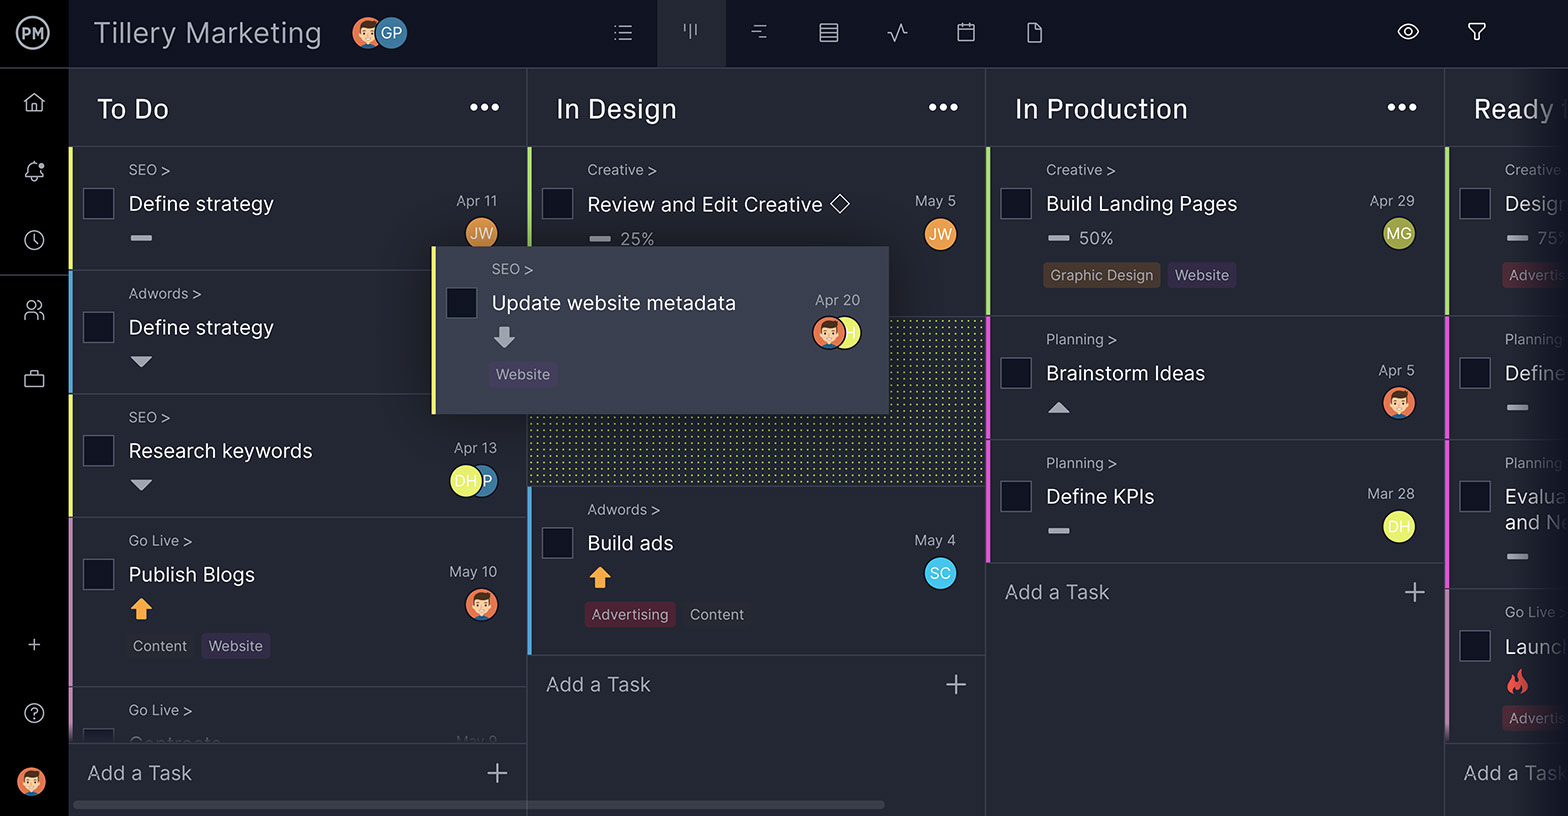
Kanban Boards
A kanban board is a project tool that visualizes workflow by breaking up your production cycle into columns on which tasks are represented by cards. The cards carry task information, such as deadlines, percentage complete, and tags. With our software, you can attach documents and images. As the cards move through the sprint, they’re dragged and dropped into the next column. Our software can automate this process, giving task approval to managers to ensure quality. This allows teams to manage their backlog and collaborate on sprints, while project managers get visibility into their work. If they see a roadblock, they can reallocate resources to avoid delays.
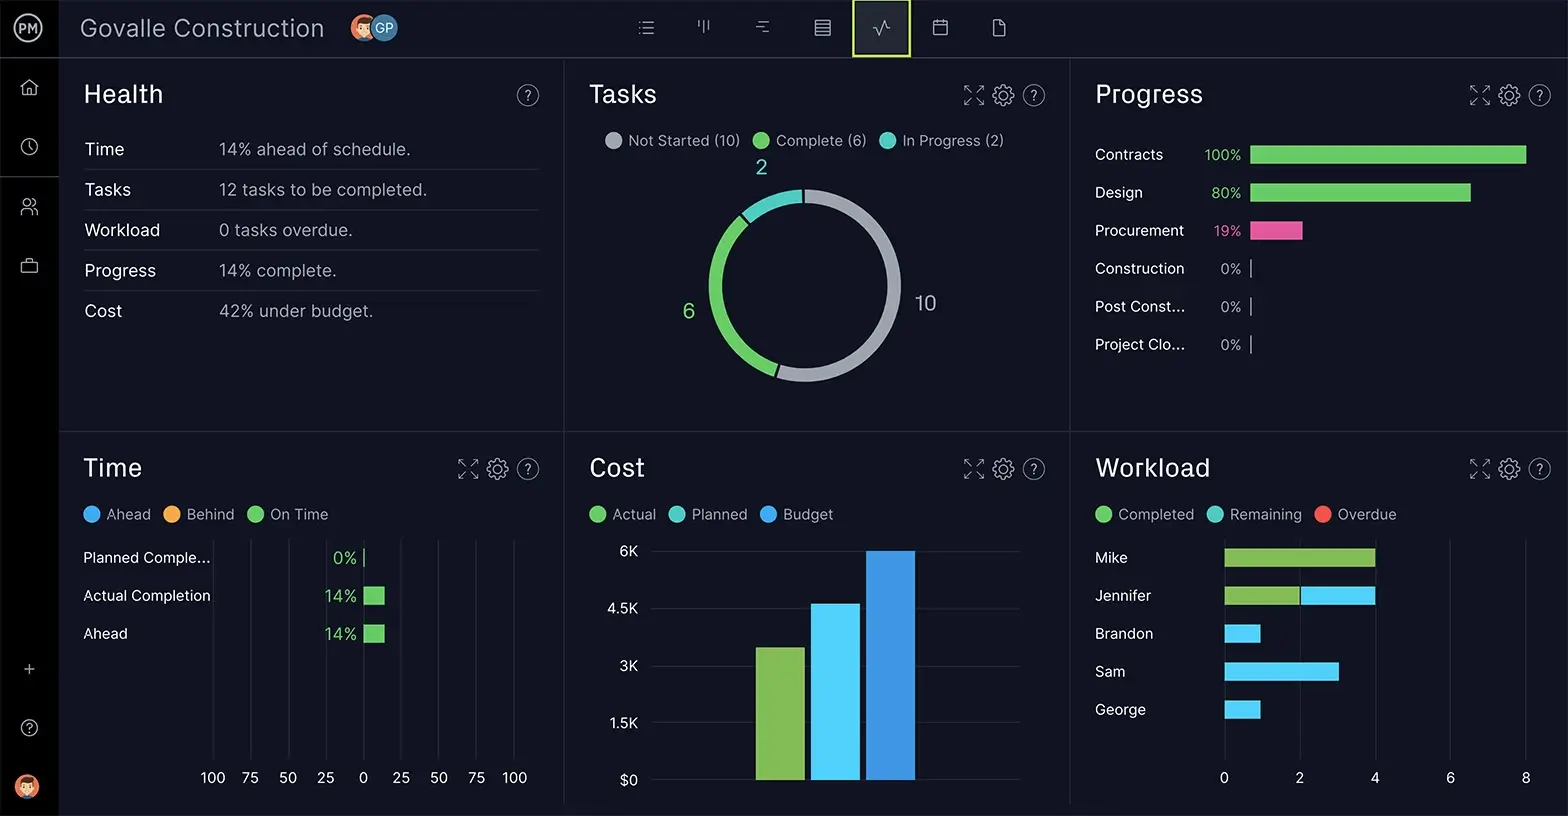
Real-Time Dashboard
When you set a baseline on the Gantt chart, it allows project managers to chart the project variance. That is, you can now compare your planned effort against your actual effort. This data is shared throughout the software, including on the real-time dashboard, which has easy-to-read graphs and charts that track costs, time, workload and much more. Simply toggle to the dashboard when you want a high-level view of the project’s progress and performance. Unlike other software, there’s no time-consuming and complicated configuration required. It’s ready to work when you are.
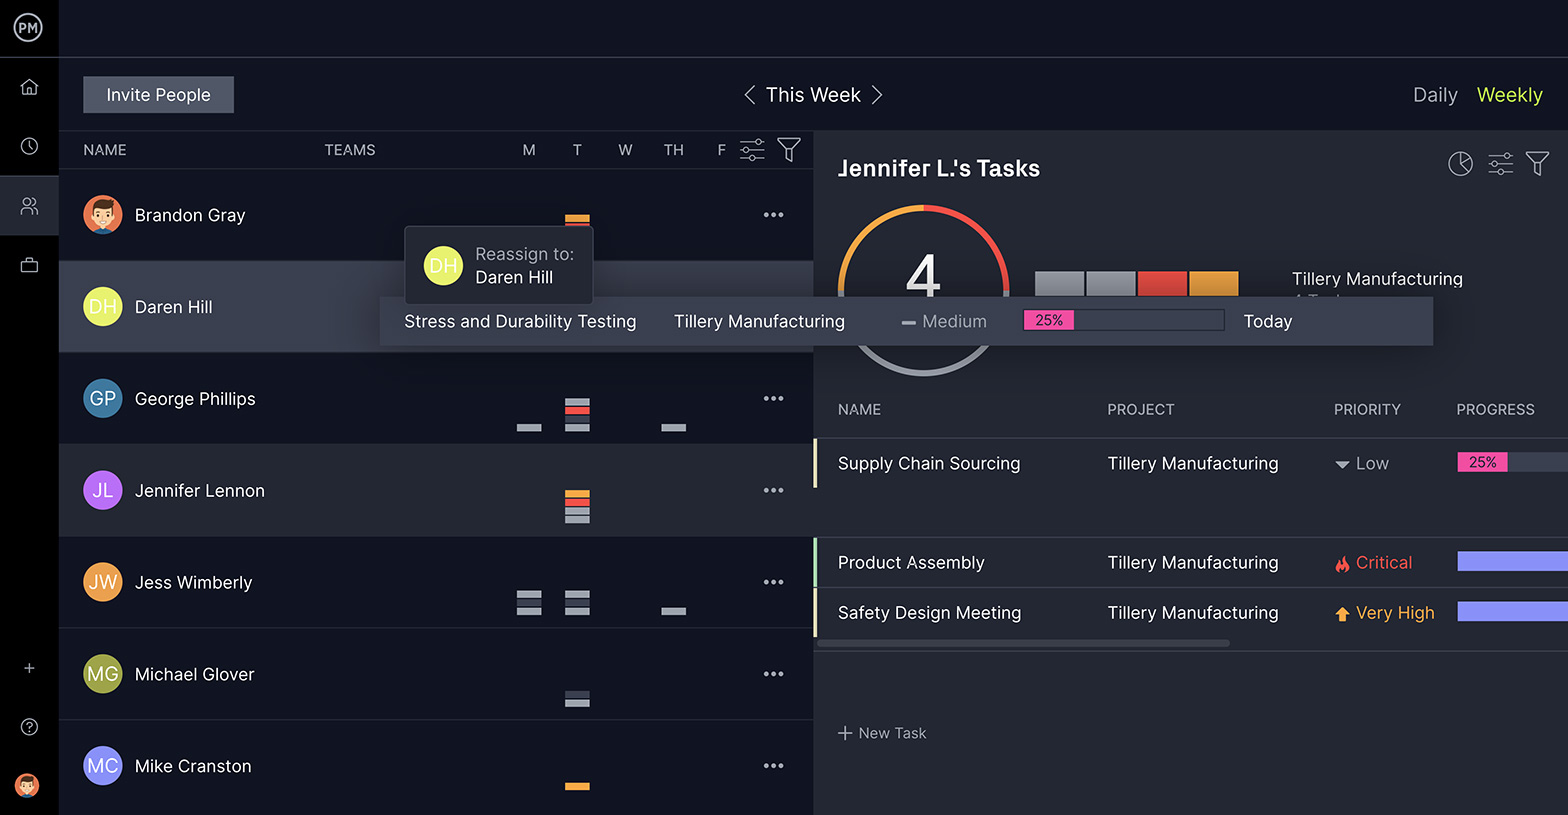
Team Management
Giving your team the right tools and having a way to monitor the project is only part of project management. You need a way to manage your team and ensure they’re working at capacity to stay as productive as possible. When you open the team management page in our software, you get visibility into the team’s workload. You can see your team’s assigned tasks assigned and their progress. There’s a color-coded workload chart that makes it easy to see who’s overallocated and you can balance the workload right from that page. We also have secure timesheets that streamline payroll and give project managers visibility into where each team member is in terms of completing their tasks.
Related Microsoft Planner Content
- Best Microsoft Project Alternatives
- Best Microsoft Planner Alternatives
- Microsoft Project vs. Microsoft Planner: In-Depth Comparison
- Microsoft Project Online: Pros, Cons and Free Alternatives
- Microsoft Project Viewer – How to View & Edit MPP Files Online
- MPP File Extension: What Is It & How to Open It
- Microsoft Project for Mac: How to Run MS Project Files on Your Mac
- Diagramme de Gantt du Planificateur Microsoft: avantages et inconvénients
- Microsoft Planner Gantt-Diagramm: Wie man ein Gantt-Diagramm in Microsoft Planner erstellt
- Diagrama de Gantt de Microsoft Planner
ProjectManager does what Microsoft Planner can’t. Our online software is a true project management tool that helps you plan, manage and track your work in real time. Manage risk, resources and tasks with our robust features. See why teams from Avis, Nestle and Siemens use our software to deliver successful projects. Get started with ProjectManager today for free.
