- What Is a PERT Chart?
- When Should I Use a PERT Chart?
- How Does a PERT Chart Work?
- How to Make a PERT Chart in 4 Steps
- PERT Chart Example
- Advantages of Using PERT Charts for Project Management
- Disdvantages of Using PERT Charts for Project Management
- PERT Chart vs Gantt Chart
- Must-Have Features of PERT Chart Software
- Free Project Management Templates to Help with PERT
- PERT Chart FAQs
- PERT Chart Video
- ProjectManager is Better than PERT Charts
- PERT Chart Resources
What Is a PERT Chart?
A PERT chart is a network diagram that allows project managers to create project schedules. They’re used in the Program Evaluation Review Technique (PERT) to represent a project timeline, estimate the duration of tasks, identify task dependencies and find the critical path of a project.
PERT charts are used by project managers to create realistic schedules by coordinating tasks and estimating their duration by assigning three time estimates for each; optimistic, most likely and pessimistic. This makes PERT charts useful when planning projects where the duration of activities is uncertain.
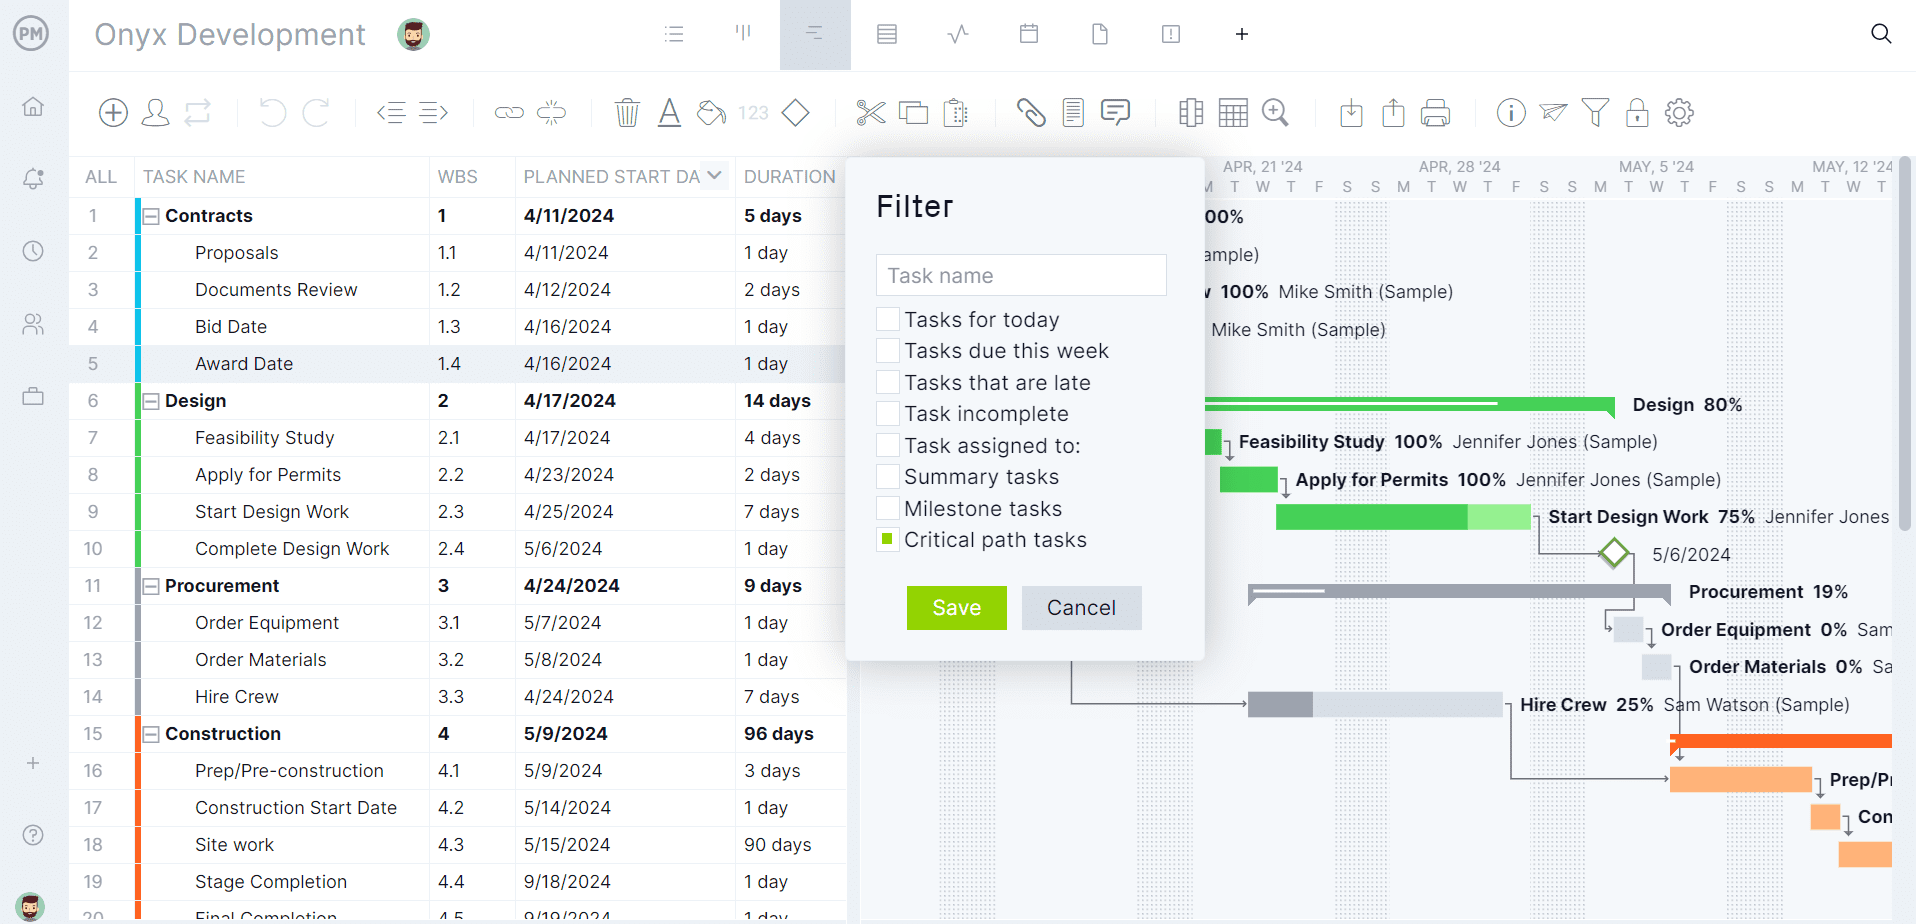
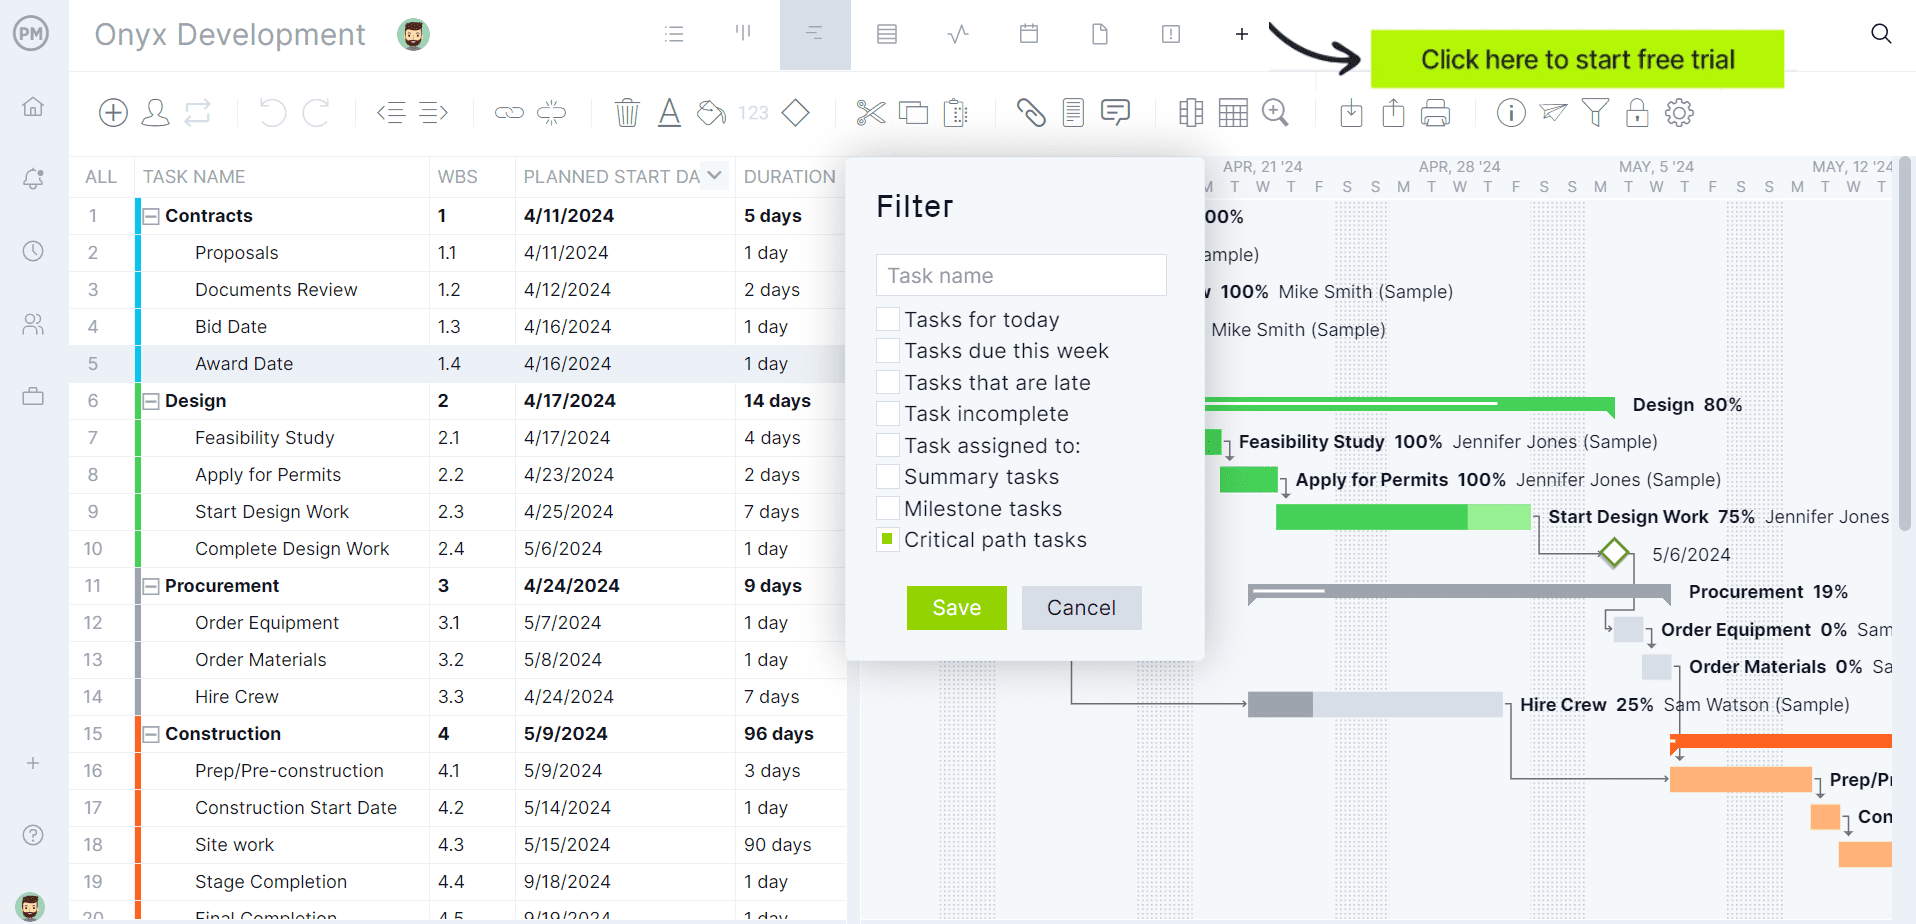
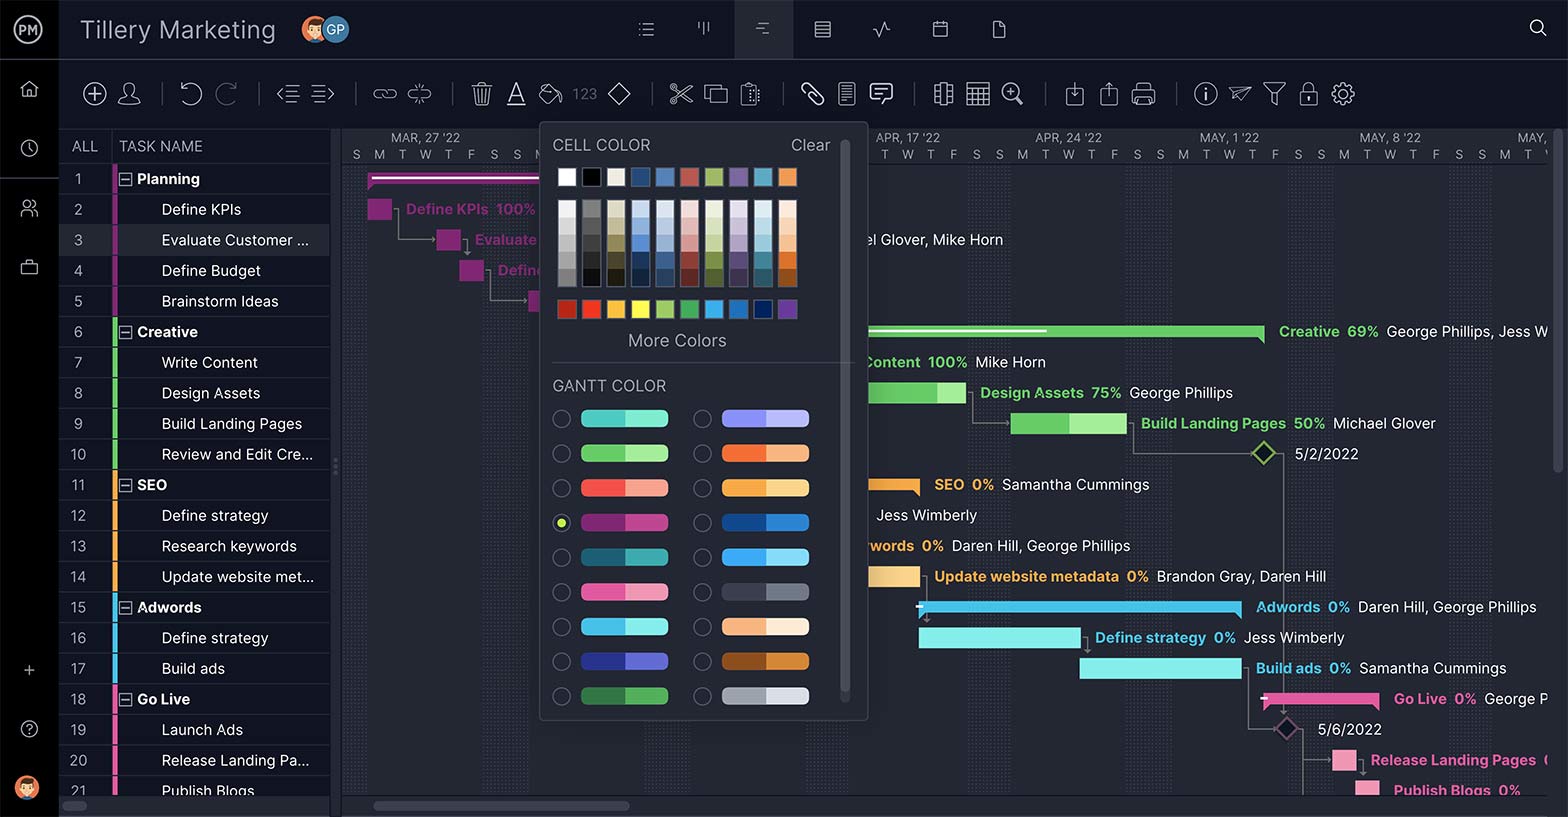
PERT charts are more powerful when combined with online project management software such as ProjectManager. ProjectManager has Gantt charts, kanban boards and task lists so you can plan, schedule and track your projects. Make dynamic project schedules that update in real time as your team completes their tasks. Get started for free.
When Should I Use a PERT Chart?
Use PERT charts during the planning phase of a project. They can help you determine the project’s critical path and the ideal time to start or finish tasks, which allows you to know which tasks need to be prioritized when creating your project schedule.
As noted, PERT charts show the dependent tasks in your project. These are tasks that can’t start or finish until another task starts or finishes. Knowing which tasks are dependent helps you prevent delays by planning ahead to make sure these dependent tasks are scheduled in the order they need to be completed.
Get your free
PERT Chart Template
Use this free PERT Chart Template for Excel to manage your projects better.
Also, when planning a project, having an accurate forecast of its duration is crucial for resource scheduling. The PERT chart is a tool that can help you estimate the amount of time you’ll need to complete the project. It’s also very helpful when you’re working on more complex or larger projects.
How Does a PERT Chart Work?
A PERT chart is made up of nodes and directional arrows. Nodes are numbered boxes or circles. They represent an event or milestone in the project. The arrows are the tasks or activities that must be done before moving on to the next event or milestone.
Therefore, a PERT chart works by visualizing the project’s tasks and dependencies. This provides an overview of the project timeline, including which tasks are essential to complete to deliver a successful project. With this information, project managers can develop a viable project plan that meets deadlines and stays within budget.
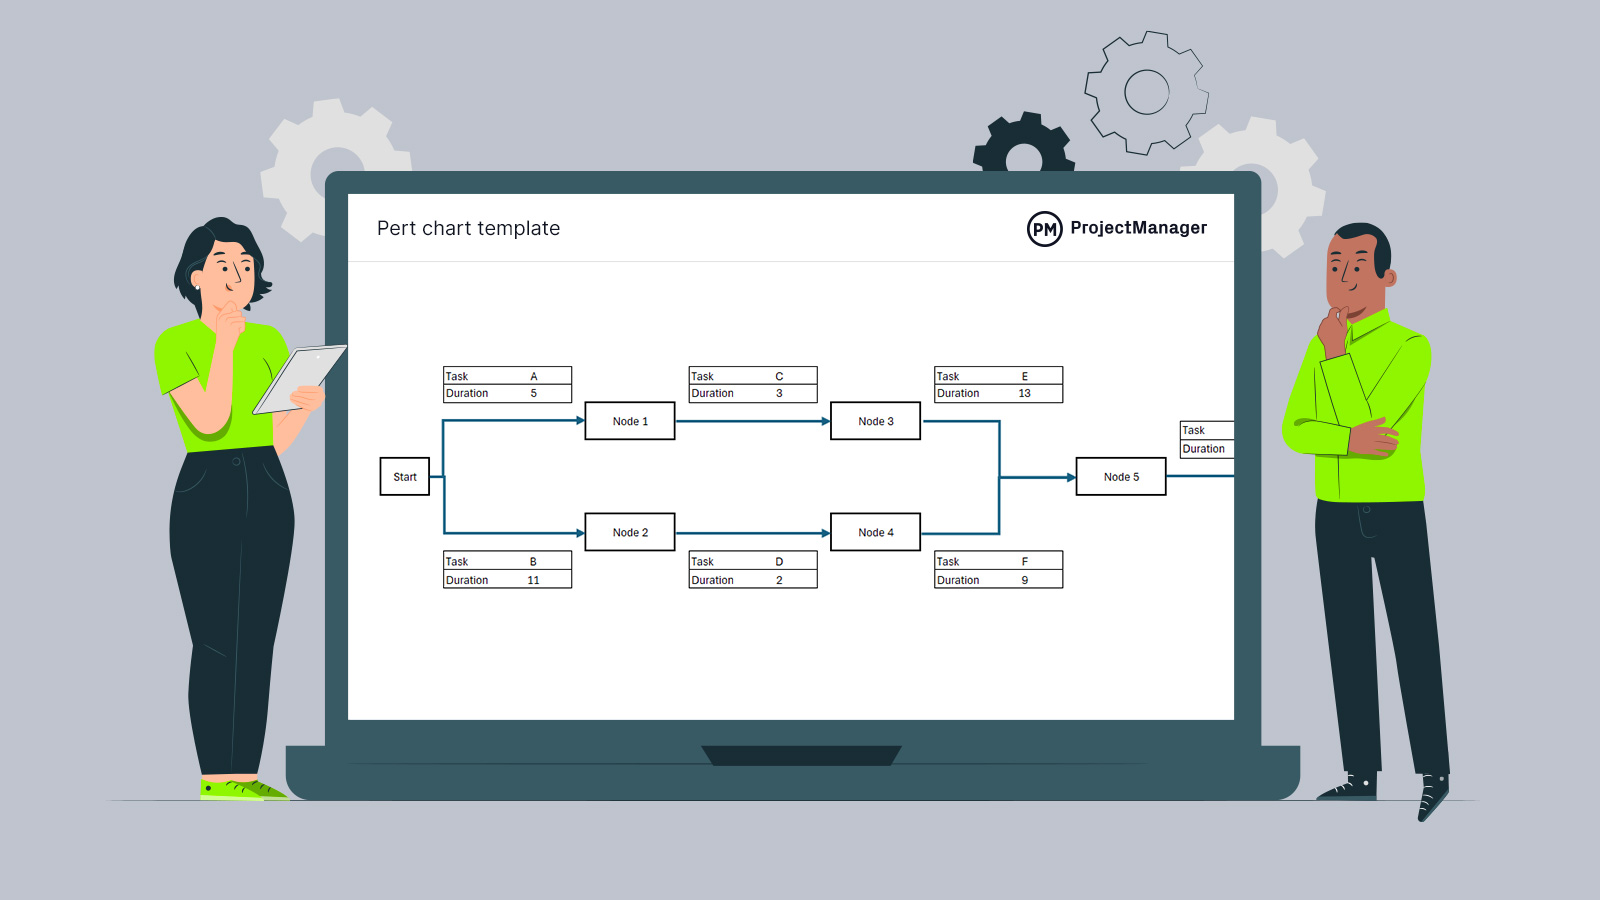
Free PERT Chart Template for Excel
Need help getting started with your own PERT chart? Make a PERT chart in less time with less stress by downloading our free PERT chart template. The formulas are already baked in, and the diagram is made, so all you have to do is plug in your values. Download this PERT template for free today.
How to Make a PERT Chart in 4 Steps
Creating a PERT chart shouldn’t be an overwhelming process, even if you decide to draw your PERT diagram and do the calculations yourself. Here are some simple steps to create a PERT chart:
1. Break Down Your Project Scope
Begin by identifying the project milestones and then identify the individual tasks required to achieve them. Then, figure out the sequence of your project tasks and their dependencies.
You should have a list of milestones, tasks and their dependencies. You’ll need these elements to create your PERT chart, either manually or using project management software.
2. Create Your PERT Chart
Now that you have the information that you need, you can now make the PERT diagram—we’ll show you a PERT chart example in the section below!
During this phase, you’ll need to sequence your tasks using the PERT diagram and estimate the time required to complete each task.
3. Estimate Your Project Duration
Now that you have drafted a PERT diagram and added task details, it’s time to add the estimated durations of all tasks to create a project schedule. If you’re drawing your PERT diagram, you’ll use the PERT chart formula to do so.
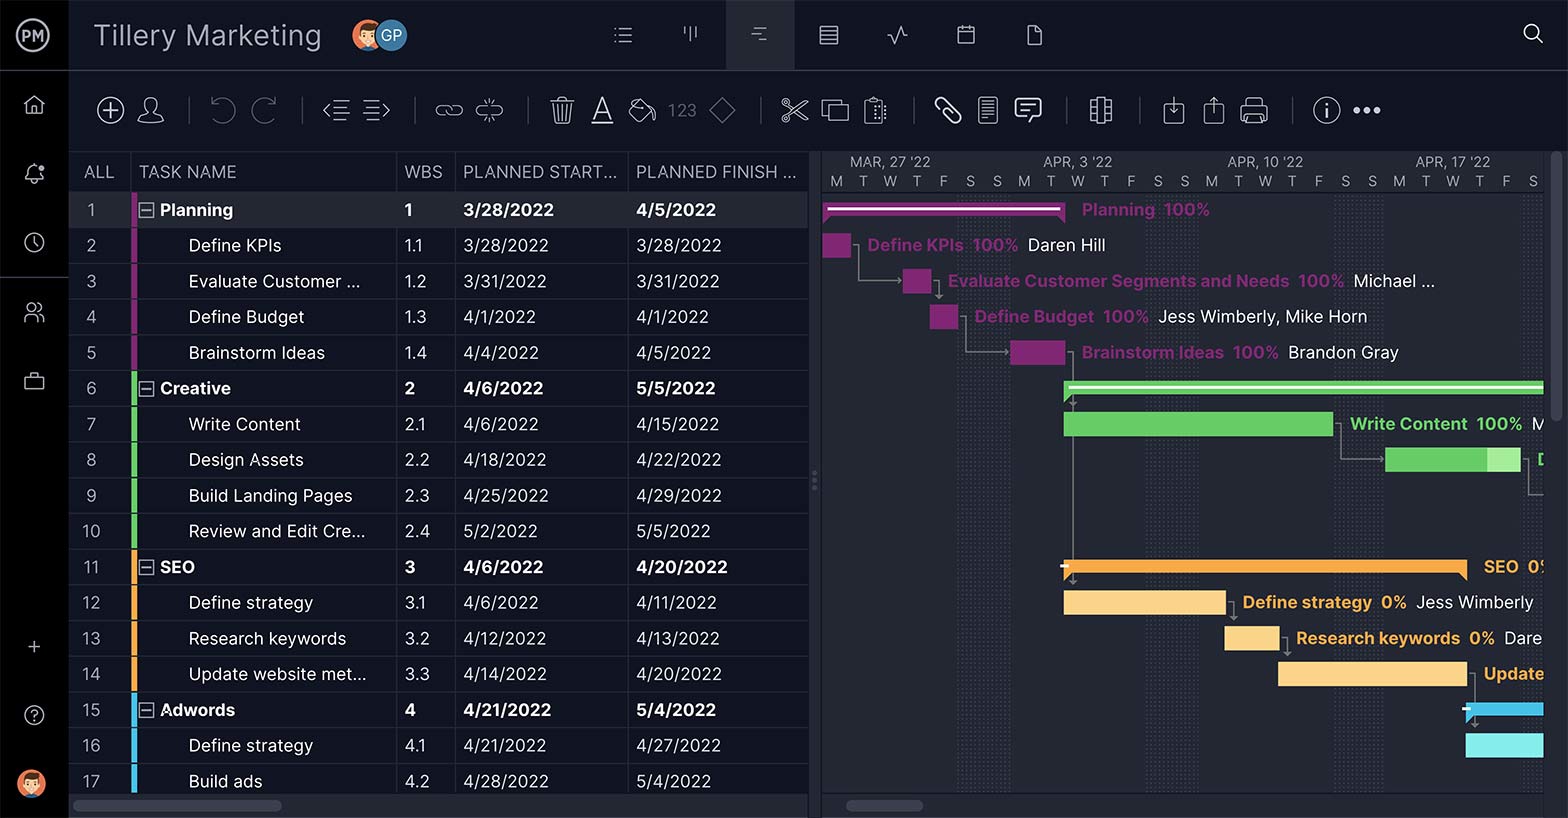
If you use ProjectManager’s Gantt chart, you’ll automatically create an interactive project schedule that lets you identify task dependencies, set due dates, estimate your project duration, find the critical path and much more.
4. Find the Critical Path & Slack
While CPM and PERT are two different methods, once you have a PERT chart that has your project tasks, their durations and due dates, you can calculate the critical path and identify any possible slack. At last, you have your PERT chart! Remember, this project management chart is a living document that must be returned to and revised as the project progresses.
Related: 12 Free Project Scheduling Templates for Excel
PERT Chart Example
Let’s move these concepts from abstraction to reality. To better understand the power of a PERT chart in
project management, let’s make one together. For our PERT chart example, we’ll create a project around building a website. The PERT chart will allow us to visualize our project’s activities and milestones to quickly uncover the critical path.
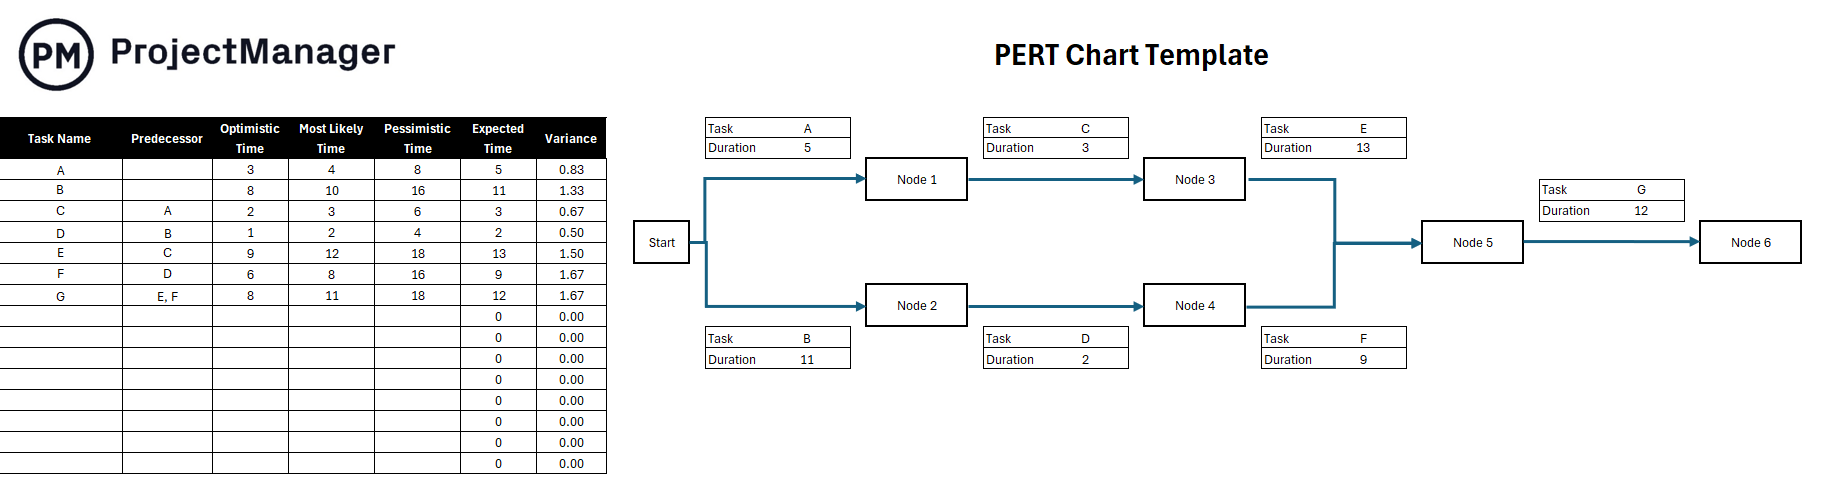
To begin our PERT example, we’re going to identify all the activities that make up the project and determine the immediate predecessors for each. We’ll list them as shown in the table below.
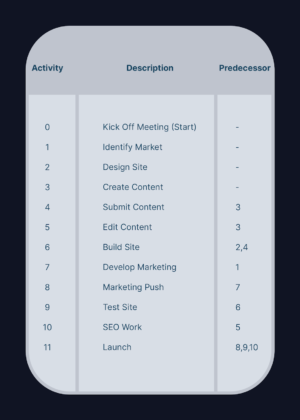
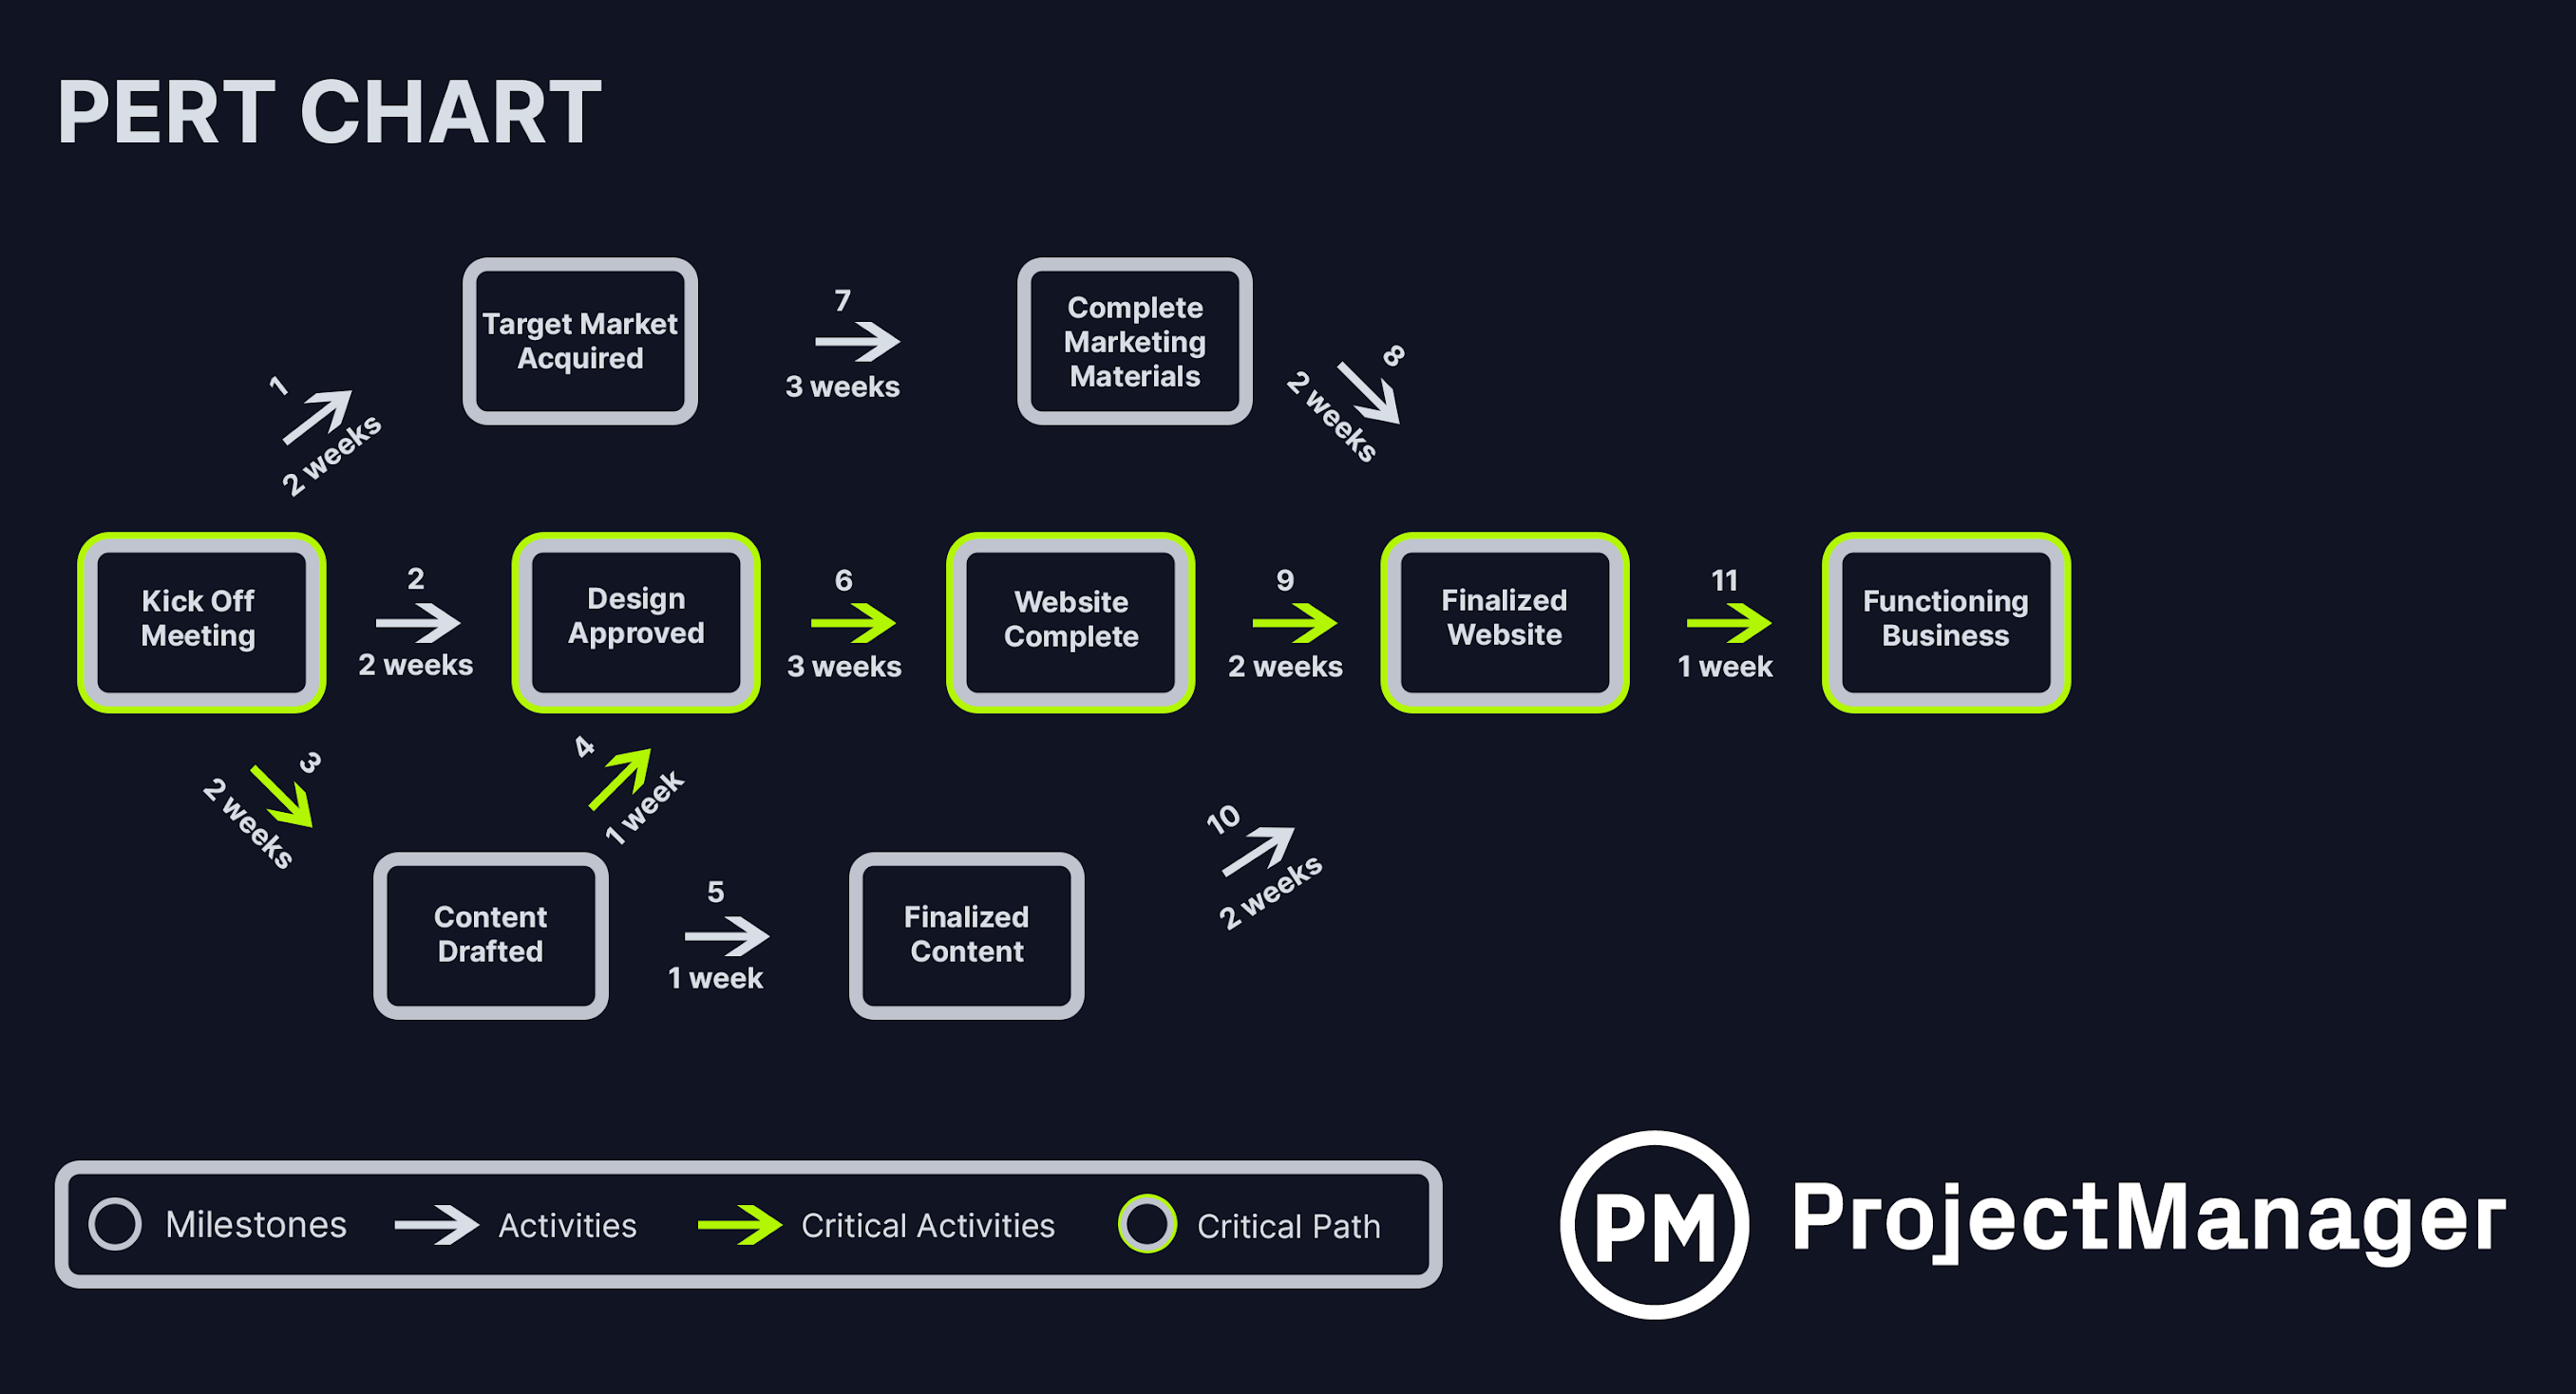
Next, we figure out how long all the activities will take. The amount of time you estimate with the PERT chart formula should be added to the arrows as shown in our PERT chart example. We used weeks as our time unit, but it could be days or months, depending on your project.
Once we have a time estimate for each task, we can draw our PERT diagram. We start with the first node which is the “kick-off meeting” in our example. Then we represent the initial activities with arrows and connect them to their corresponding milestone nodes. We continue the process until we get to the final milestone node of our project.
Pro tip: A PERT chart is a great way to help you estimate simply and more accurately. Estimates can be overly optimistic or pessimistic, but using a PERT chart will find the most realistic estimate.
Advantages of Using PERT Charts for Project Management
Simplify Complex Projects
PERT charts help project managers get a handle on complex projects. They’re useful because they provide an estimation of how much time you’ll need to schedule the project and what resources will be required. The nature of the PERT and its breakdown structure helps to visualize the complexity of a project and the dependencies between each step in the process.
Involve Multiple Departments & Subject Matter Experts
A PERT chart also serves as a project management tool that pulls in data from every department working on the project. This helps project managers identify who is doing what and provides clear responsibilities for those tasks. Strong communication is facilitated between departments, and the overall strategic goals of the organization are better aligned.
Explore the Hypothetical
Another benefit of using a PERT chart is it allows project managers to create what-if scenarios. By mapping out the tasks, time and resources for a project, you can quickly see what’s working and what’s not. This saves a lot of time that would otherwise be wasted on revisions. This flexibility makes PERT charts useful in project management.
Disadvantages of Using PERT Charts for Project Management
PERT charts aren’t a quick fix to get your projects magically on track, though. Naturally, bad data in results in bad data out. It’s important that the person conducting the PERT analysis has experience in the process.
They’re also labor intensive, which some organizations might not have the time or money to invest in. Additionally, you don’t build a PERT and call it a day. They require continuous reviews and updates to make sure they’re accurate. If you’re using a PERT chart template, you’ll have to create many versions of it.
PERT Chart vs. Gantt Chart
While both PERT charts and Gantt charts are visual tools used by project managers for project planning, they’re not exactly the same thing.
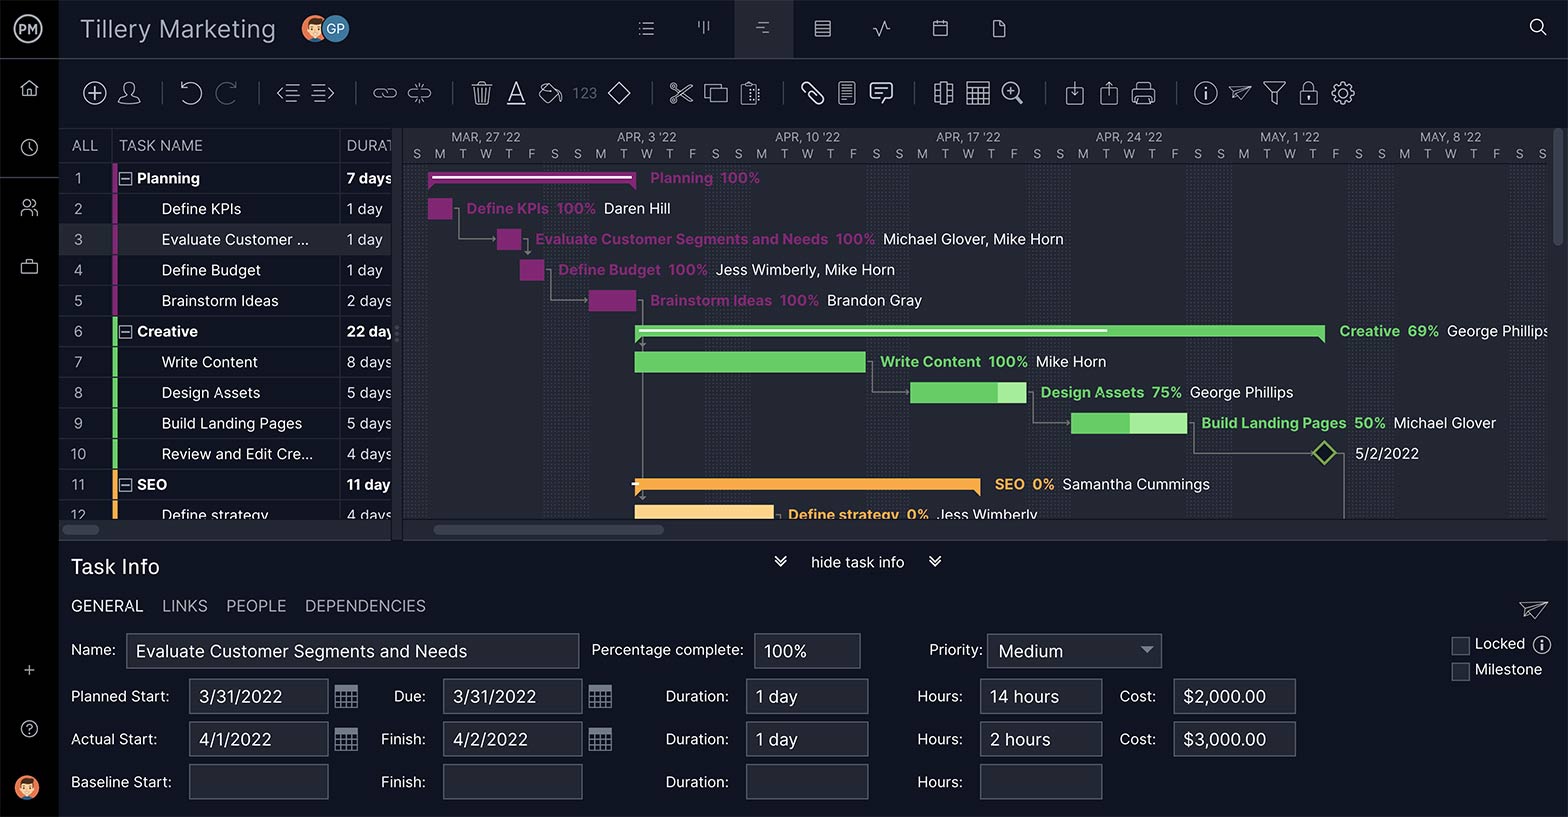
PERT charts, as detailed above, were developed to simplify planning and scheduling larger and more complex projects. Gantt charts, on the other hand, are also a graphical depiction for planning and scheduling a project, which breaks down the project scope into tasks that populate a timeline. A Gantt chart can be used to build the project timeline, set task dependencies and show the duration of each task.
Related: Free Gantt Chart Template for Excel
There are other key differences as well. For example, Gantt charts represent the project timeline with a bar chart. A PERT chart is more of a flowchart or network diagram. Gantt charts can be used on smaller projects, while PERT charts are for larger and more complex projects.
The most salient difference is that a PERT chart is usually used before starting a project to figure out scheduling, while Gantt charts tend to follow into the project, highlighting scheduling constraints. Gantt chart software can be used by project managers when executing the project as well as when planning because tasks’ start and end dates can be edited. Gantt charts reveal how long each task will take, show who on the team is responsible for those tasks and are a more transparent tool to track progress and keep track of tasks and resources.
What Is PERT Chart Software?
PERT chart software is used to help project managers better estimate the realistic duration of their projects. PERT charts are a form of diagram and can be built robustly using a dedicated PERT chart maker. A PERT chart software allows you to create PERT charts that are dynamic and easily updated, unlike a PERT chart template.
PERT chart software is a feature of a larger project management tool that takes the PERT diagram and imports it into Gantt chart software. Now, the PERT chart can be the stepping stone to adding durations to your tasks, linking dependencies, setting milestones and assigning work to the team.
Must-Have Features of PERT Chart Software
You can use a PERT chart maker and invest in project management software, or you could get them all in one tool that has these essential features:
Organize and Schedule Tasks
PERT charts give you an idea of how long the project should take, and a Gantt chart fine tunes that by collecting all your tasks on a project timeline. Estimate the duration of each task, set milestones to better track as you move from one phase to another and assign your team work.
Link Tasks, Avoid Bottlenecks
Gantt charts control tasks by linking dependent ones together. Some tasks can’t start or finish until another starts or finishes. If you don’t identify these during the planning stage, you might block the team when they’re executing their work. Gantt charts let you do much more than PERT charts.
Plan Your Project Timeline
Most project managers prefer Gantt charts over PERT charts for scheduling projects. They manage all your tasks, subtasks, resource costs associated with the tasks and even planned starts and finishes. Then, by setting a baseline, you save that data and can compare it against your actual progress.
Automate Calculations
The critical path method is an algorithm that’s used to better schedule projects. Finding the critical path with a PERT chart is somewhat complex and pulls you away from other important project duties. Some Gantt charts will automatically chart the critical path in your project, which saves time.
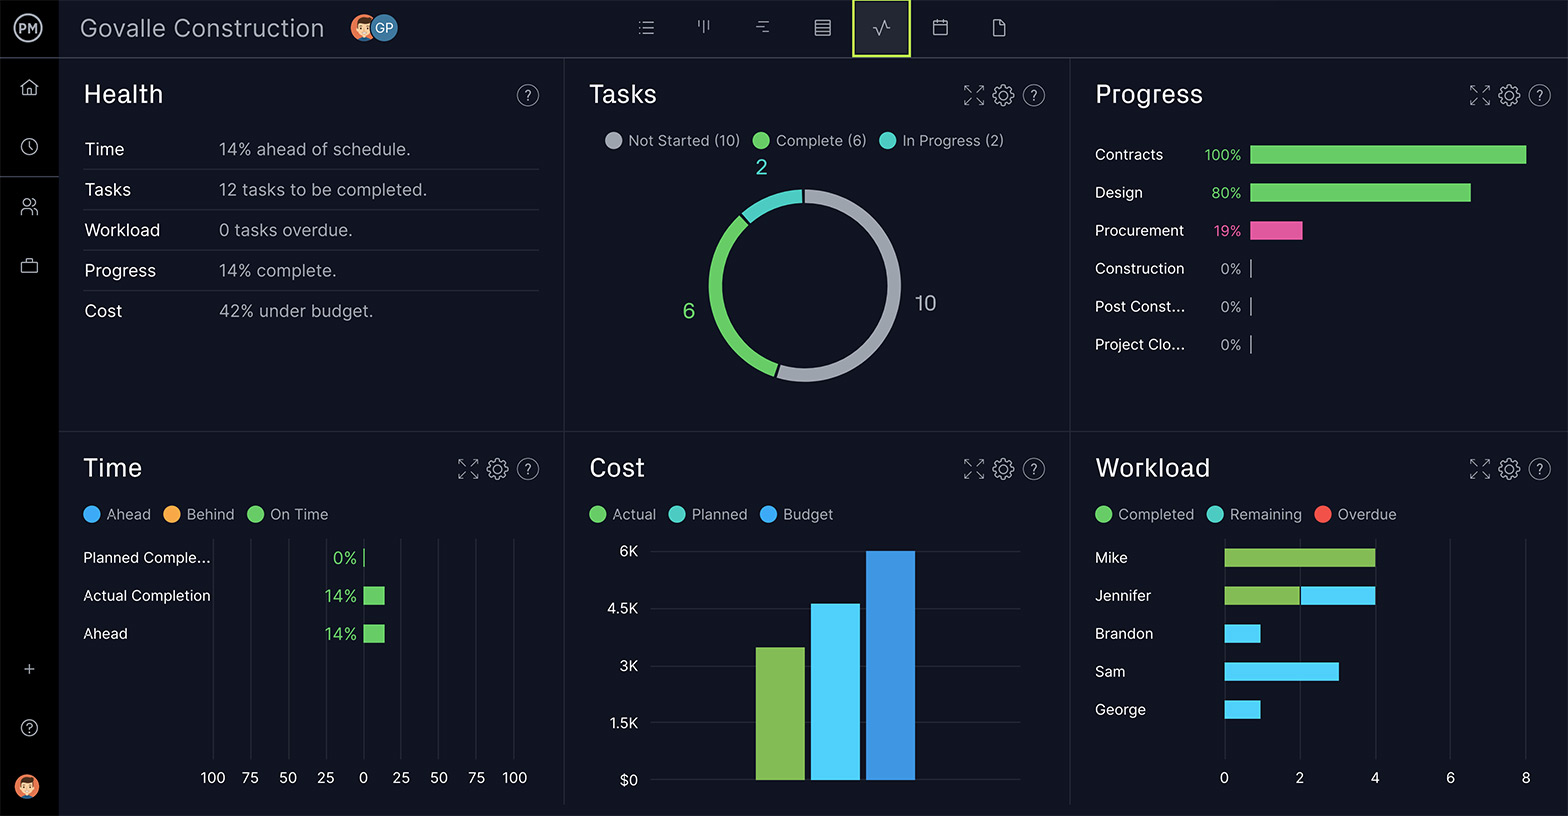
See Project Metrics in Real-Time
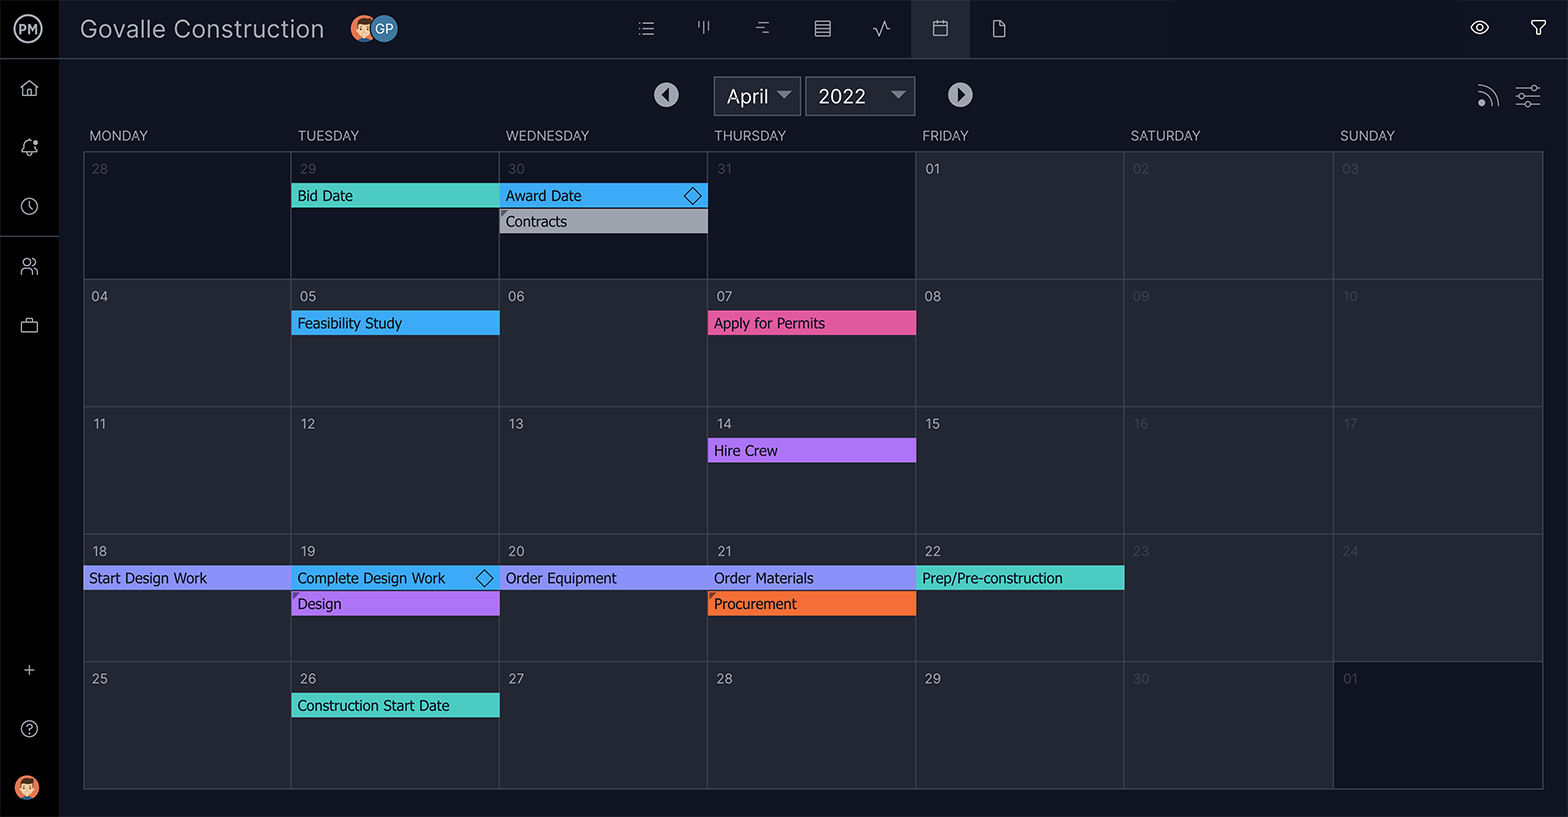
Dashboards are a collection of project management metrics displayed in graphs and charts that give you a bird’s-eye view of the project’s performance. If you’re using online software, that data is delivered in real-time to give you a more accurate status report on progress.
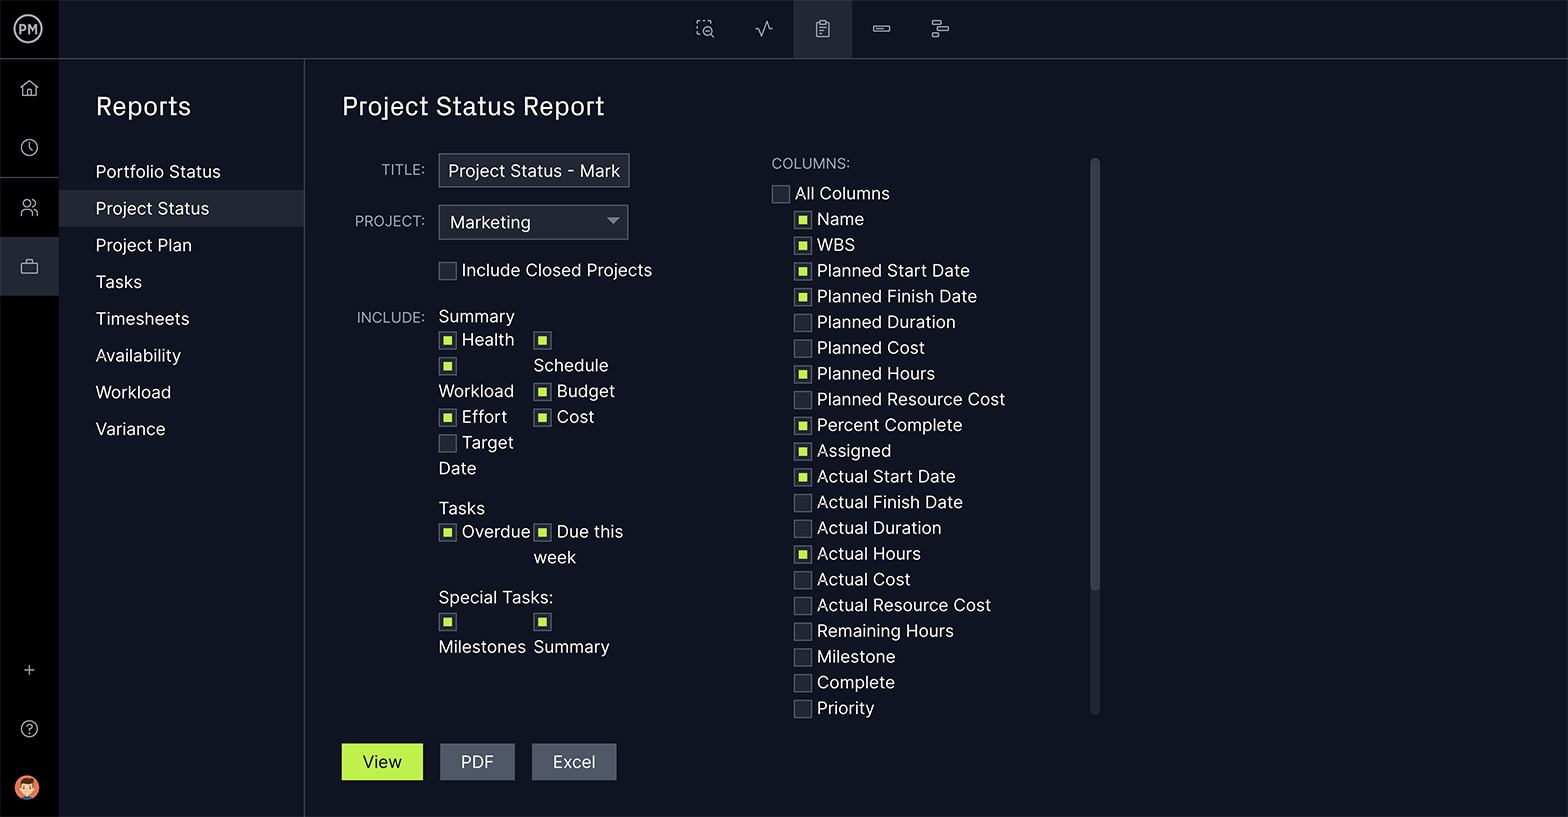
Make Data-Driven Decisions
The PERT chart estimates and project reporting defines. Reports can be generated to show project variance, task and time progress, workload, costs and more. They provide accurate data to make better decisions and can be shared to keep your stakeholders updated.
Free Project Management Templates to Help with PERT
PERT charts are just one of many project management charts you can use to plan, schedule and track your projects. Here are other free project management templates you can use with your PERT charts.
Work Breakdown Structure Template
Before you create your PERT chart, you’ll need to clearly identify all the project tasks that need to be executed to achieve your project milestones. Our work breakdown structure template lets you document these so you’re prepared.
Gantt Chart Template
Gantt charts are a great alternative to PERT charts. Just like a PERT chart, our free Gantt chart template lets you create project schedules by simply adding tasks to a timeline.
Project Tracking Template
Once your project execution phase begins, you’ll need to keep track of the project schedule and the tasks you outlined on your PERT chart. Our project task tracker template is ideal to monitor your project tasks.
PERT Chart FAQs
If you still want to create a PERT diagram by hand, you can use the PERT chart formula and draft it yourself.
What Is the PERT Chart Formula?
A traditional PERT chart relies on the weighted average of three numbers that are based on the most pessimistic (P), the most optimistic (O) and the most likey (M) estimates for the project’s length.
- Optimistic Time: The least amount of time to accomplish a task or activity.
- Pessimistic Time: The maximum amount of time to accomplish a task or activity. This is the worst-case scenario, anything that can go wrong does.
- Most Likely Time: The best estimate of how long it’ll take to accomplish the task or activity, assuming there are no problems.
- Expected Time: The best estimate of how long it’ll take to accomplish the task or activity, assuming there will be problems. This would be the more realistic duration.
E=(O + (4*M) + P) / 6
What Is the PERT Chart Standard Deviation?
Use the formula below to find the PERT chart standard deviation. The larger your results, the less confidence you have in your estimate, and vice versa.
(P-O) / 6
What Should be Included in a PERT Chart?
These concepts allow you to understand the Program Evaluation and Review Technique and the anatomy of a PERT chart:
- Nodes: These are the symbols used to visualize milestones and project tasks. They can be represented by circles or triangles.
- Arrows: Visual representation of the sequence of a task, diverging arrows indicate tasks that can be completed at the same time. They can be solid or dotted, depending on the nature of the sequence.
- Slack: The amount of time a task can be delayed without causing an overall delay to the project or other tasks, also known as float.
- Critical Path: The critical path is the longest task sequence of a project. PERT charts are used to determine the critical path of a project to estimate its duration.
- Critical Path Activity: An activity with no slack.
- Lead Time: How much time you should complete a task or activity without impacting the following ones.
- Lag Time: The earliest time in which a task can follow another.
- Predecessor: An activity that precedes another, and must finish before its successor can start.
Who Invented PERT Charts?
PERT charts were developed by the U.S. Navy. In 1957, the Special Projects Office created the PERT chart to assist in its Polaris nuclear submarine project. Since then, project managers have used the Program Evaluation and Review Technique in all manner of industries.
PERT Chart Video
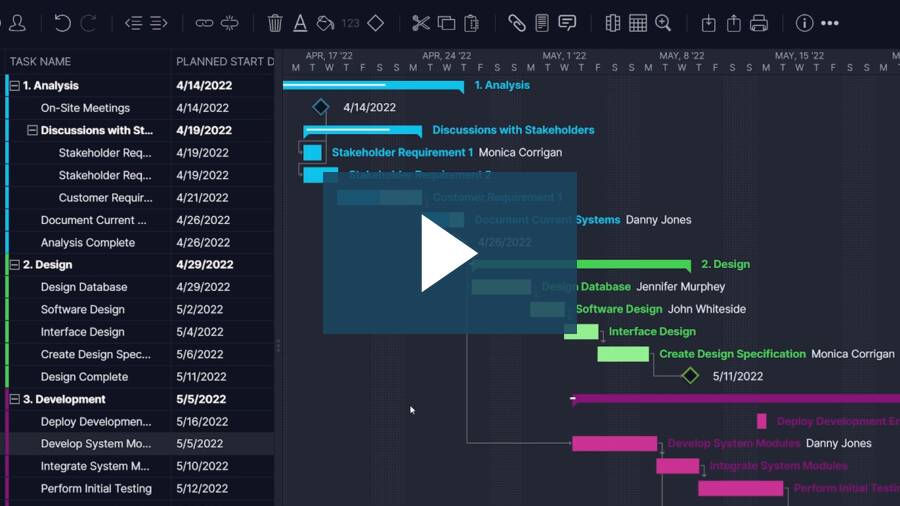
All of these explanations can be a bit hard to understand by text. If you’re more of a visual learner, watch project management expert Jennifer Bridges, PMP, as she walks you through the steps of creating a PERT chart in this short tutorial video.
ProjectManager Is Better than PERT Charts
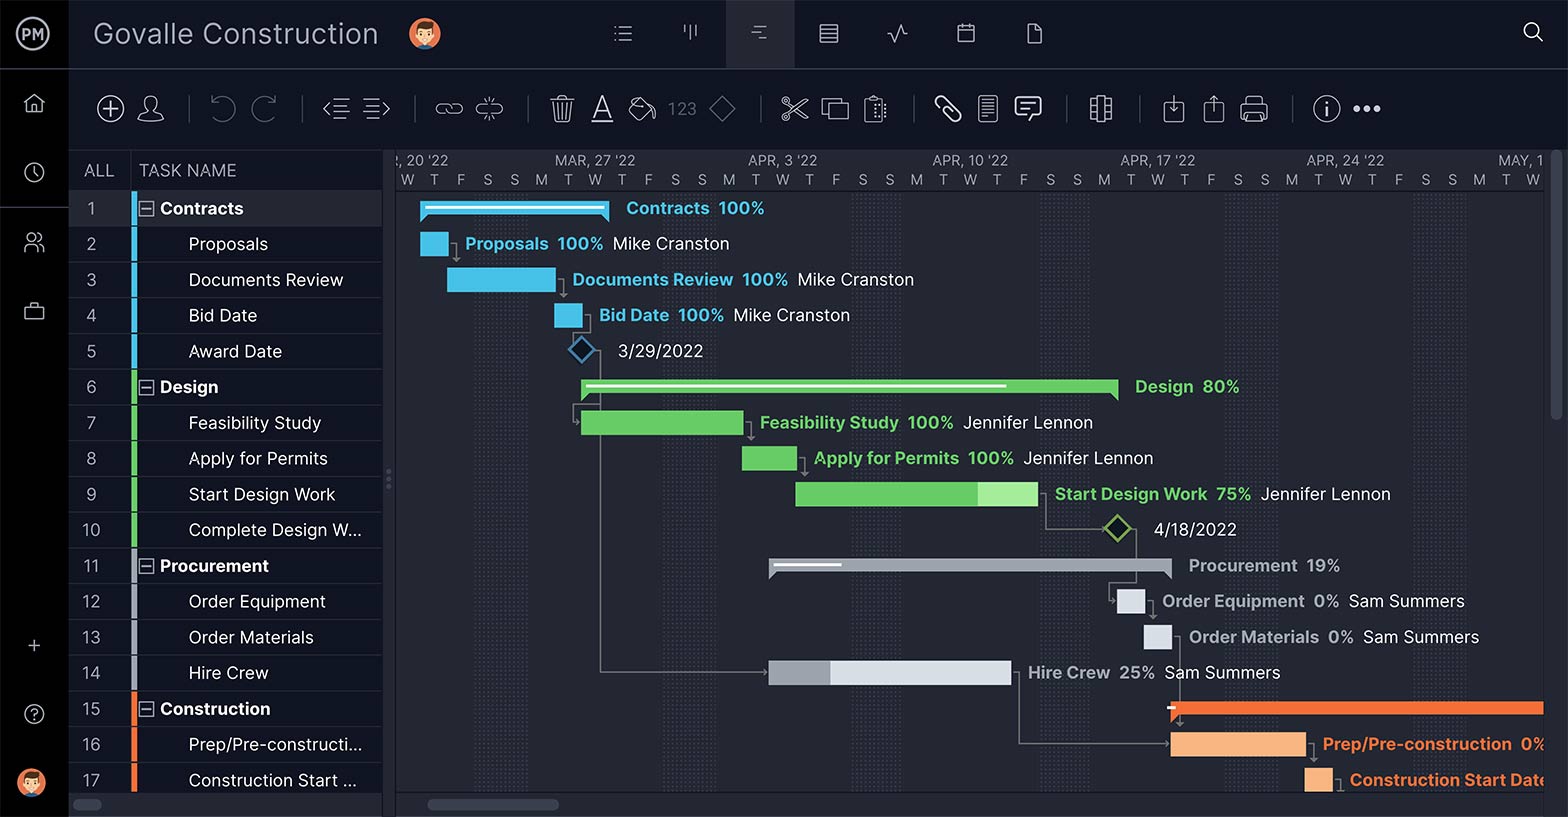
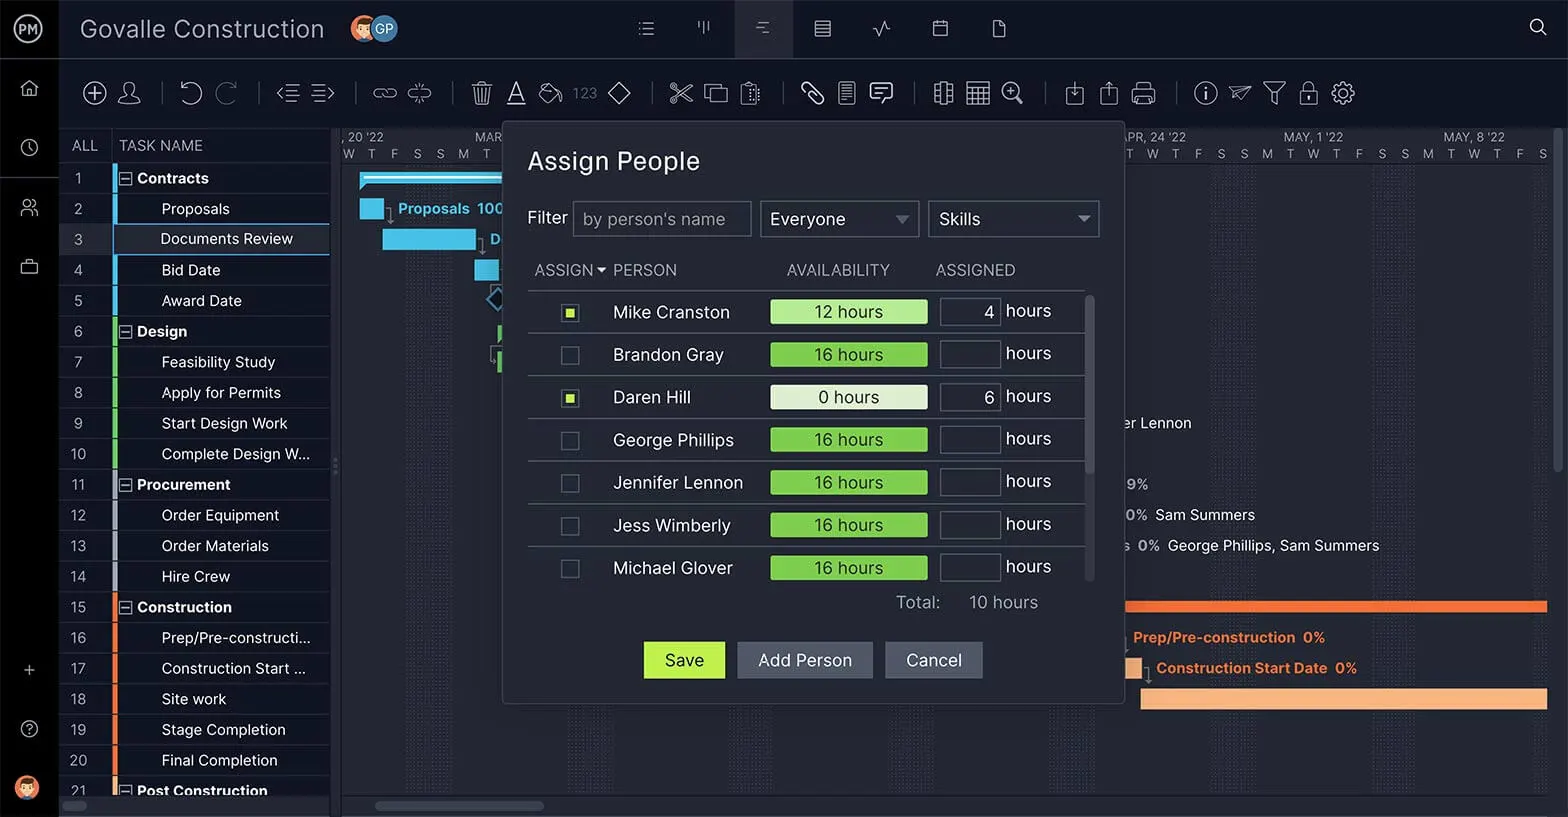
The PERT chart is a tool that helps project managers plan and schedule. ProjectManager helps you take that PERT chart and apply it to managing your whole project with our online Gantt chart. It plans, schedules and works through the execution of the project. Our Gantt chart gives you control over every aspect of your schedule, from placing milestones, assigning team members and linking task dependencies.
We easily link all four types of task dependencies— finish-to-start, finish-to-finish, start-to-finish and start-to-finish—so you can avoid bottlenecks later in the project.
Unlike a PERT chart, our Gantt chart isn’t static. No matter how good your estimations, there will always be issues that pop up in a project. You can prepare for risk and mitigate it, but often the schedule will have to adapt to keep you on time. We have drag-and-drop editing to quickly and easily change the start and due dates, which is then reflected throughout the software.
That’s just the tip of the iceberg for our award-winning project management software. We can help you keep your projects and teams organized. See for yourself why tens of thousands of teams use our software to work more productively by starting your free 30-day trial.
PERT Chart Resources
Software
Templates
Articles
- Gantt Chart vs. PERT Chart vs. Network Diagram
- 10 Best Project Management Charts for Project Planning
- Project Management Trends (2022)
- Project Management Guide
- Work Breakdown Structure (WBS) Guide
- 5 Project Management Resources Every PM Should Know
- 3 Free Tools for Making Network Diagrams
- ¿Cómo usar un diagrama PERT en gestión de proyectos?
- Diagramme PERT : un guide rapide
- Wie man ein PERT-Diagramm erstellt (Vorlage enthalten)
Start your free 30-day trial
Deliver faster, collaborate better, innovate more effectively — without the high prices and months-long implementation and extensive training required by other products.
Start free trial