- What Is a Gantt Chart? Definition & Meaning
- What Is the Purpose of a Gantt Chart?
- Gantt Chart Video for Beginners
- How Does a Gantt Chart Work?
- Gantt Chart Examples
- What Is a Gantt Chart Used For?
- How Are Gantt Charts Used in Project Management?
- Who Uses a Gantt Chart?
- Benefits and Advantages of a Gantt Chart
- Disadvantages of Using a Gantt Chart
- Gantt Chart Alternatives for Project Management
- Gantt Charts for Excel, PowerPoint & More
- What Is Gantt Chart Software?
- How to Make a Gantt Chart Online With Gantt Chart Software
- Gantt Chart FAQs
Gantt charts are one of the most widely used project diagrams—and for good reason. This visual project management tool represents the project’s schedule and can be used in nearly any industry to help deliver on time and on budget. Whether you’re new to project management or want to master timelines and task dependencies, a Gantt chart is essential for project planning.
What Is a Gantt Chart? Definition & Meaning
A Gantt chart is a project management chart that allows project managers to create a project schedule. It shows the order in which project tasks will be completed, when they’re due, their duration among other details.
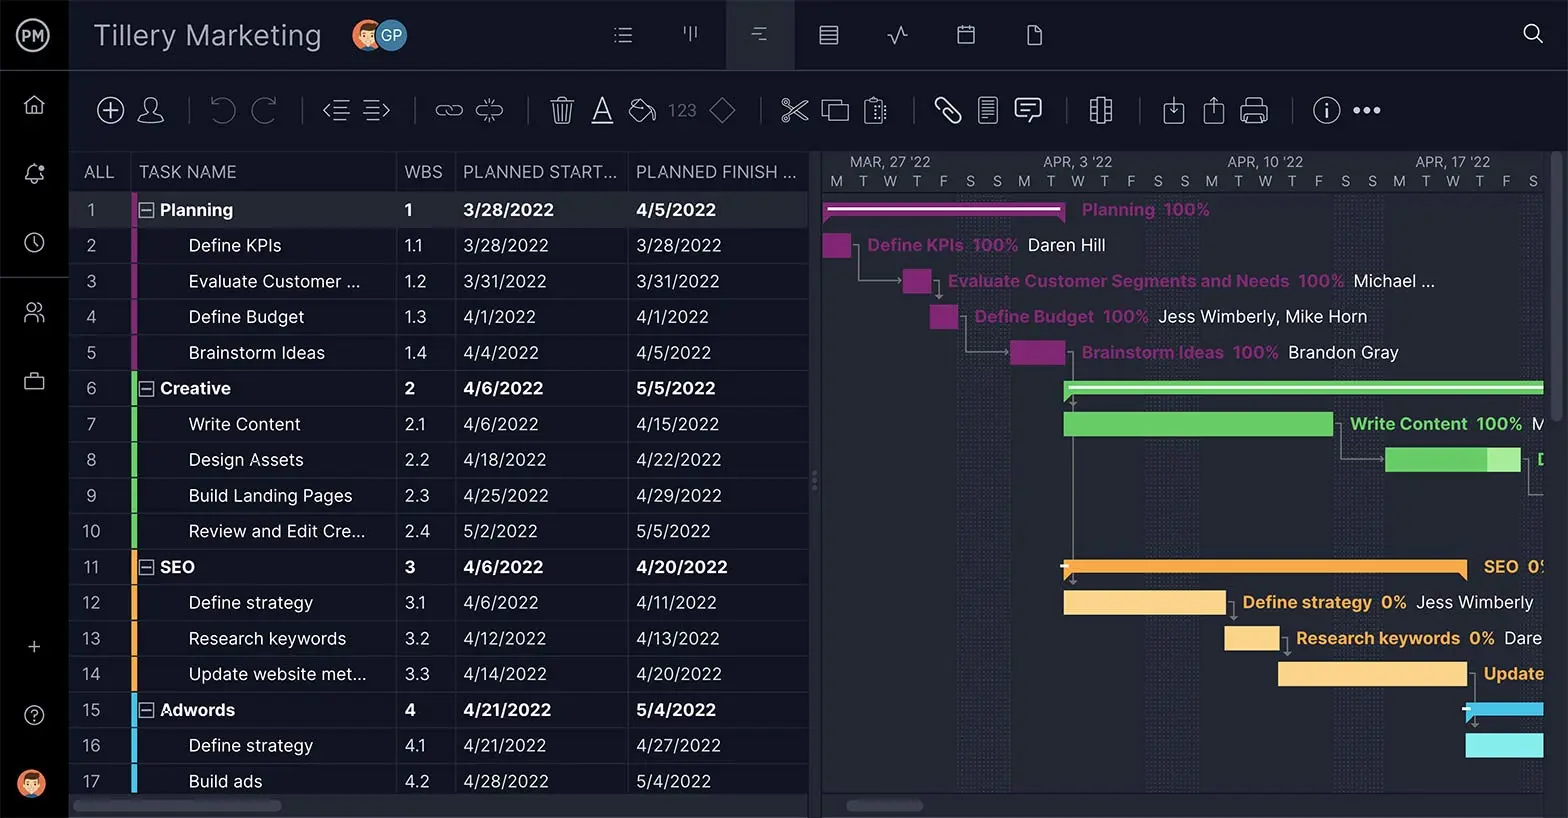
Every Gantt chart has two main parts, a grid or task list on the left side and a project timeline on the right. In addition to listing the task name, you can include details like the work breakdown structure, due dates, task dependencies, planned resource costs, planned hours and other project planning data. All data on the left is represented by a cascade of task bars on the right, completing the Gantt chart diagram.
Gantt Chart History & Evolution
The Gantt chart was created by Henry Gantt in the early 20th century to improve project planning, scheduling and tracking by illustrating completed work compared to planned work. Today, project managers and team members use Gantt chart software to plan projects, create a project schedule, allocate resources and track progress with just one project management tool.
However, there’s so much more to know about Gantt charts beyond a simple Gantt chart definition and its history. In this guide, we’ll explore some of the main aspects that you need to know about Gantt charts including what they’re used for and the different methods and tools you can use to make one. We’ve even created industry-specific Gantt chart templates so you can create project schedules for your business in minutes.
What Is the Purpose of a Gantt Chart?
At a basic level, a Gantt chart allows project, program and portfolio managers to easily map out project plans by organizing project tasks on a visual timeline. However, Gantt charts are used for many other purposes in project planning, project scheduling, project tracking and resource management.
Gantt charts can be used to manage any business process, from routine procedures such as establishing production lines to one-off initiatives such as buying materials. They are commonly used in industries such as construction, manufacturing, IT, professional services and more.
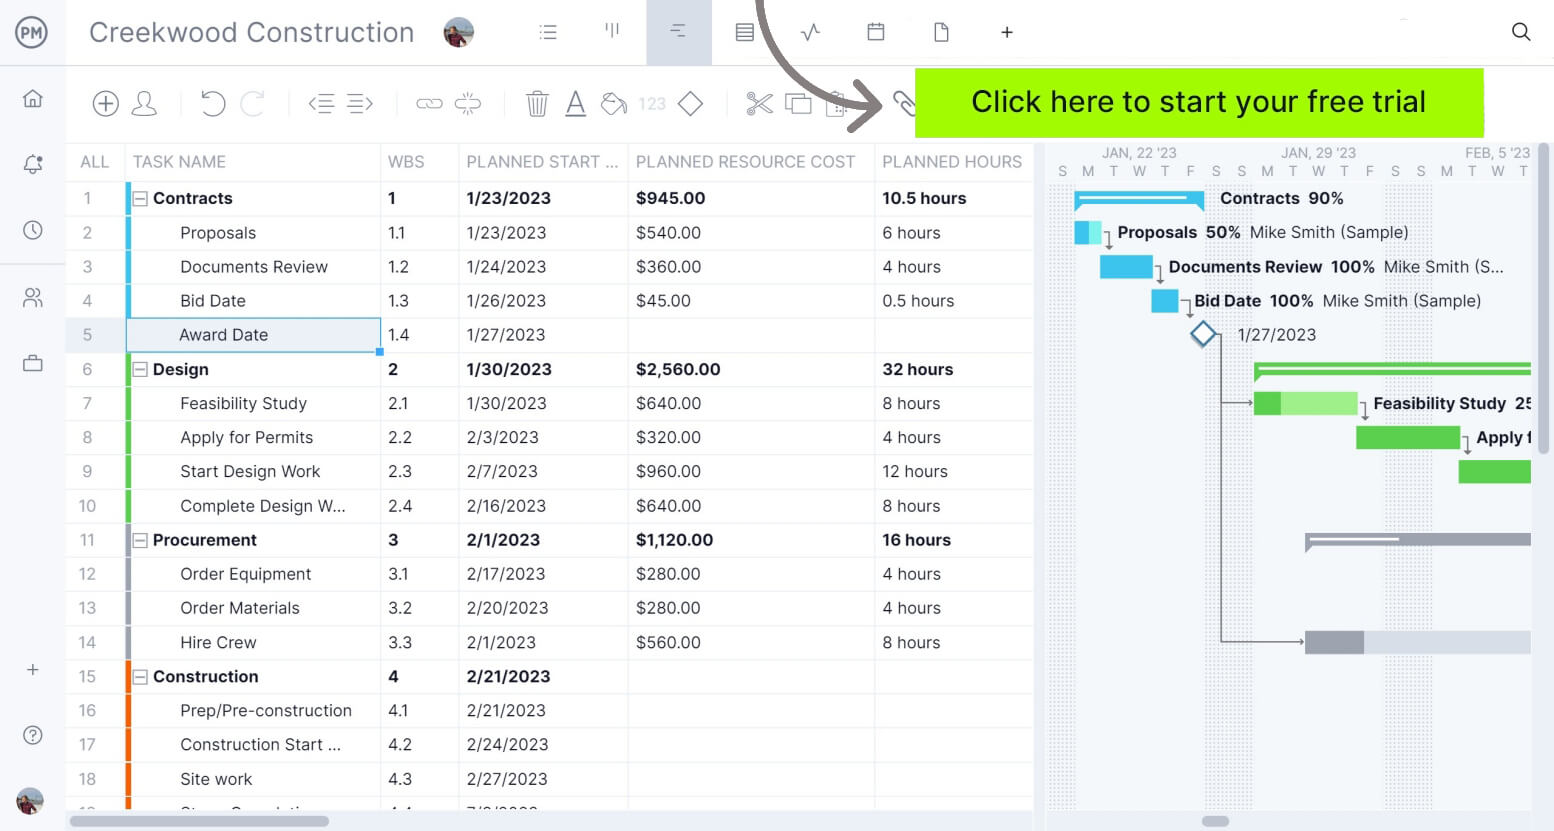
With ProjectManager’s Gantt chart, you can assign tasks to your team members, set due dates, estimate costs and monitor progress in real time. The best part is that it can be used along with other project management tools such as kanban boards, real-time project dashboards, timesheets and team collaboration tools.
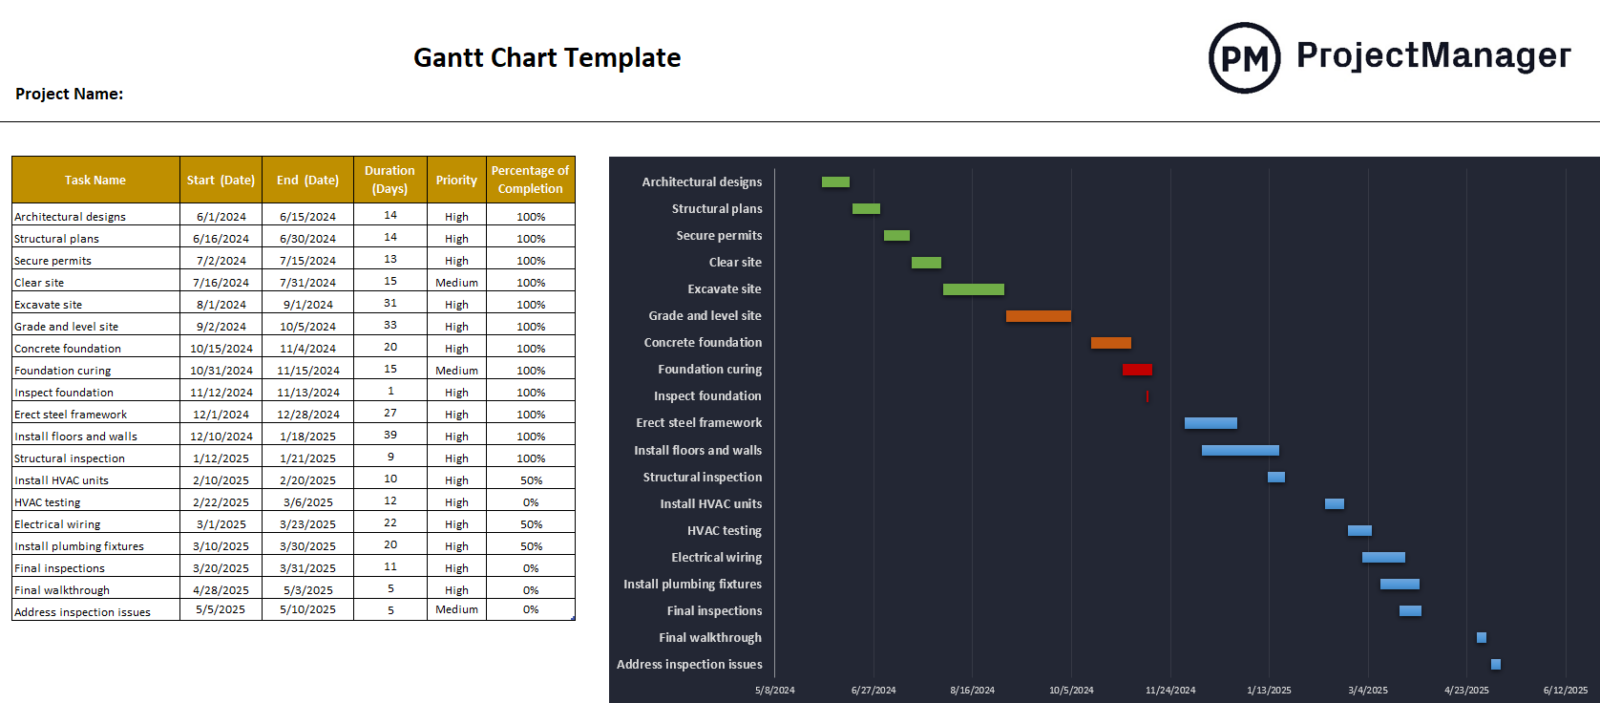
Get your free
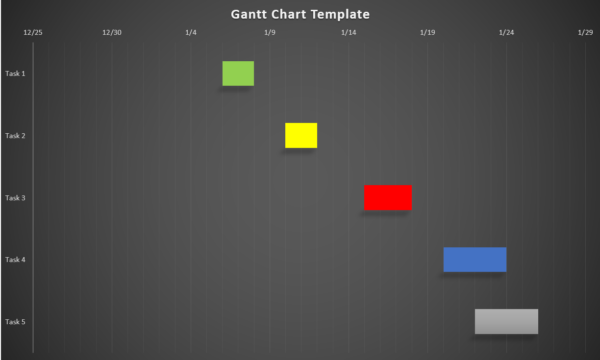
Gantt Chart Template
Use this free Gantt Chart Template to manage your projects better.
Get the templateWhen Should You Use a Gantt Chart?
Ideally, Gantt charts are created during the project planning phase as they are used to make a detailed project schedule. As the Gantt diagram is visual, it is often referred to throughout the project lifecycle by both project managers and teams as a way to monitor and control the project.
Gantt Chart Video for Beginners
In the video below, Jennifer Bridges, certified professional project manager (PMP), explains how a Gantt diagram may be used throughout the life cycle of a project.
How Does a Gantt Chart Work?
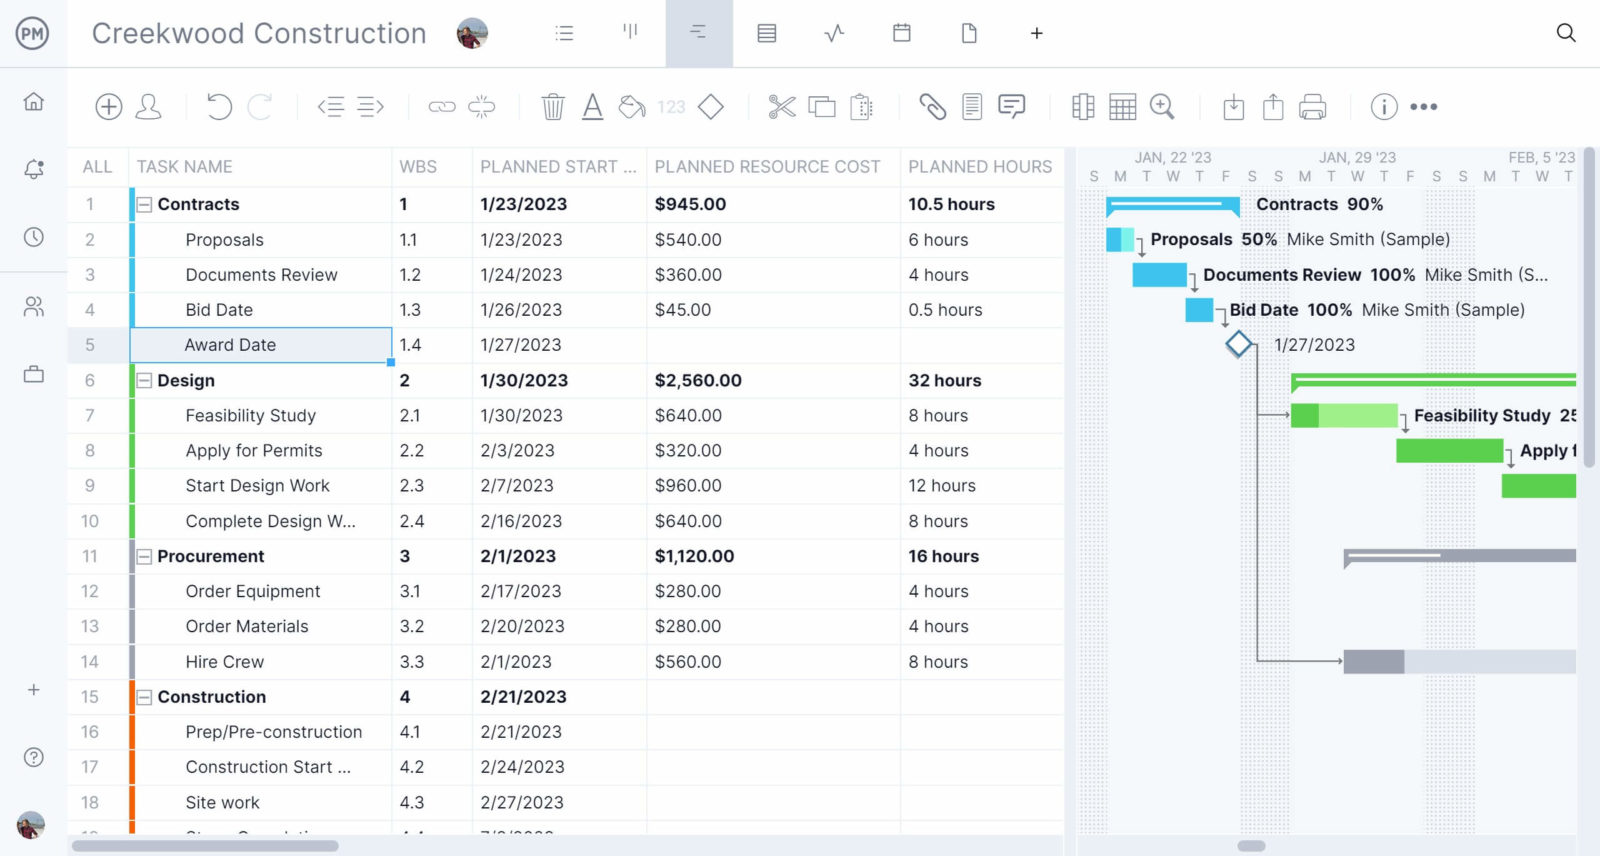
There are two halves to most Gantt chart tools you see online today. On the left is a grid that lists project tasks and important information about them and on the right, there’s the Gantt chart timeline, a visual representation of the project schedule.
Gantt Chart Grid
The grid of a Gantt chart is where you list project tasks and project scheduling details about them. The Gantt chart grid is the most important component of your Gantt chart because the data you enter here will be used to populate the Gantt chart timeline.
The more details about your project tasks you can add to a Gantt chart grid, the more aspects of your project plan you’ll be able to track.
Basic Gantt chart software only allows you to assign tasks to your team members and create project timelines based on the due dates and duration of your project tasks. However, more advanced Gantt chart software like ProjectManager enables you to track other areas of your project.
Here are some of the key aspects of your project you can track with ProjectManager’s Gantt chart grid.
- Task name: Briefly describe your task. You can also add more task details using other project views such as kanban boards and task lists.
- Task owner: Assign tasks to team members.
- Task priority: Set a priority level for all your project tasks so you can better allocate your resources.
- Project phases: In most projects, there’s a set of well-defined phases that are made up of related tasks.
- Work breakdown structure level: The work breakdown structure level is a number that allows you to understand the order in which project tasks must be completed and what project phase they’re in.
- Project milestones: Track project milestones, which are major events, accomplishments or deliverables in your project timeline.
- Resource requirements: Indicate what resources are needed to complete each project task, including labor and non-labor resources such as raw materials, equipment or machinery.
- Estimated & actual costs: Estimate costs for each project task, create a project budget and then log the actual costs as tasks are executed so you can determine whether your project is on, over or under budget.
Now, let’s go over the other half of any Gantt diagram, the Gantt chart timeline.
Gantt Chart Timeline
The Gantt chart timeline, also referred to as a Gantt chart schedule, is a stacked bar chart where each project task is represented by a bar that runs on the horizontal axis. The task bars start on the date that the work is scheduled to start and end on the date when it’s expected to finish. The longer the bar, the longer the task will take.
But that’s not everything a Gantt chart timeline shows. Based on the data from the Gantt chart grid, ProjectManager’s robust Gantt chart timeline lets you zoom in on the following details of your project schedule.
- Due dates & task duration: Add planned start and planned finish dates and adjust them at any time by dragging and dropping tasks on the Gantt timeline. You can also compare planned vs. actual task duration.
- Task dependencies: You can also show the task dependencies in number form. Choose the “Linked From” column in the column settings. Task dependencies are represented as arrows that link tasks in the Gantt chart timeline.
- Percent complete: A figure, mostly always based on an educated guess by the project team, of how much work they have done and how much is still to do.
- Critical path activities: ProjectManager’s Gantt chart maker automatically identifies the critical path based on your project task list, dependencies and due dates.
Gantt Chart Examples
We’ve created three Gantt chart examples using ProjectManager to see how Gantt charts can be used for managing different types of projects. These Gantt chart examples show a schedule for construction, manufacturing and IT projects, which are three of the industries where Gantt charts are used the most.
In these Gantt chart examples, you can easily see:
- The Gantt chart timeline
- What the project tasks are
- Which team member is working on each task
- When project activities start and finish
- The percent complete for each activity and work package
- How tasks group together, overlap and link with each other
- Task dependencies such as finish-to-start, start-to-start, finish-to-finish and start-to-finish
- Milestones and project phases on the schedule
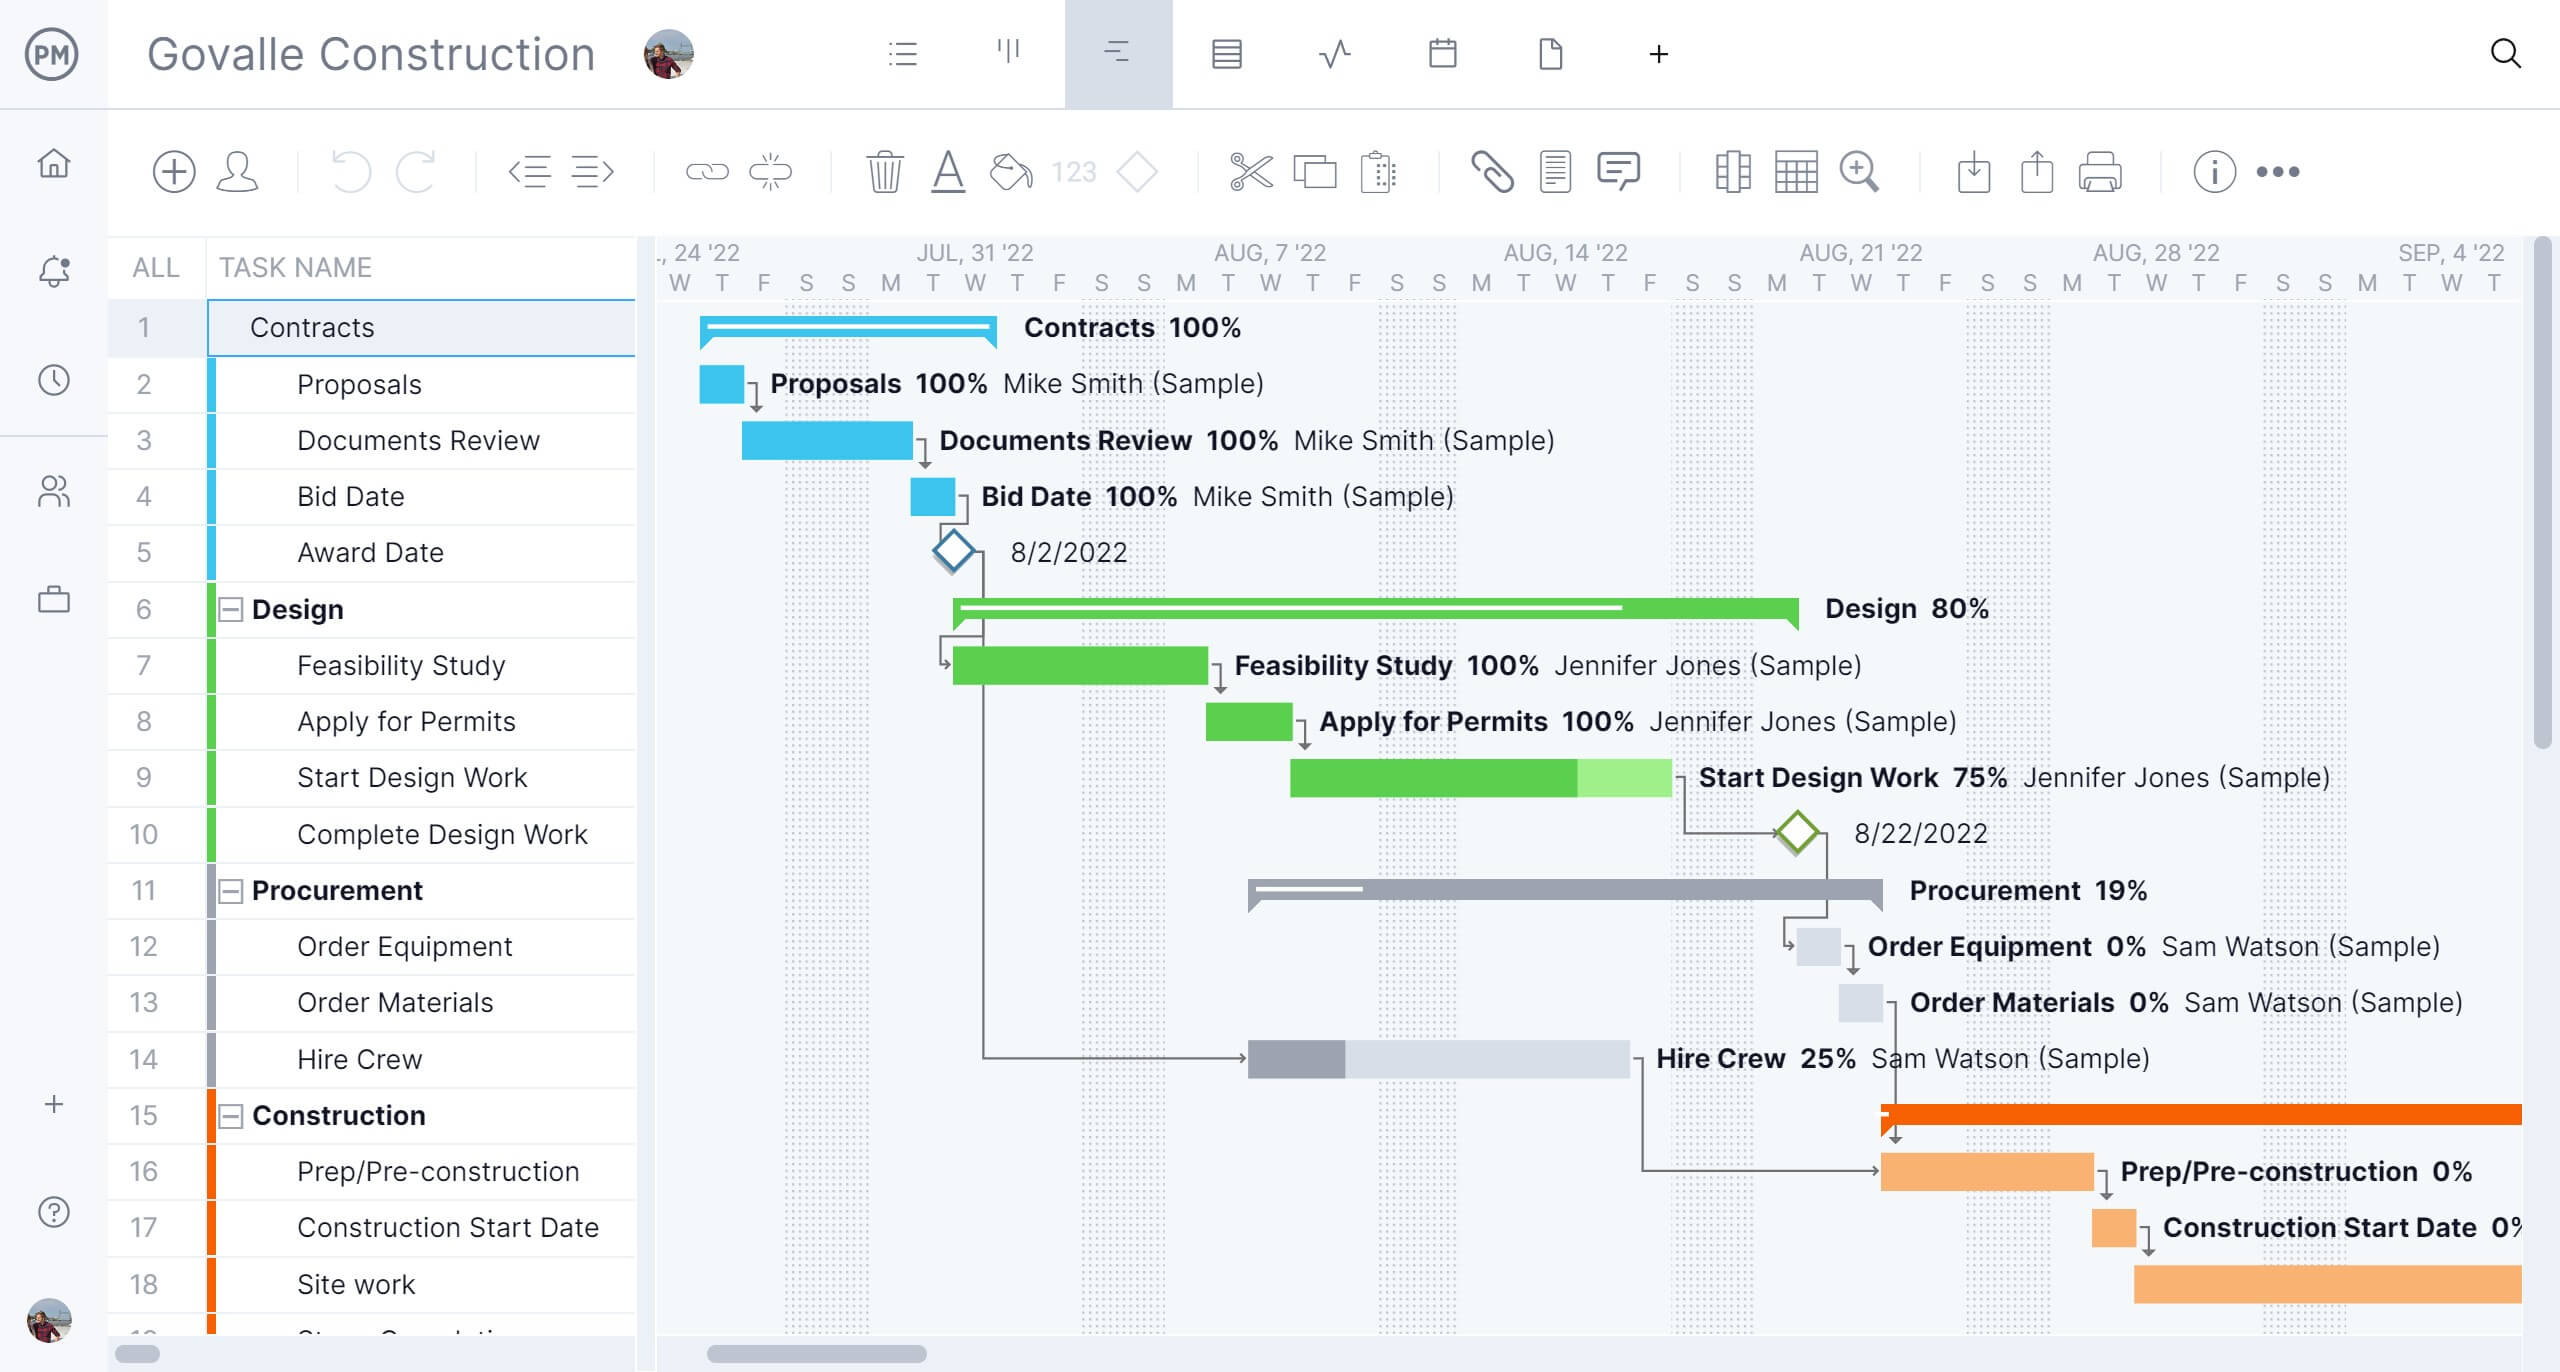
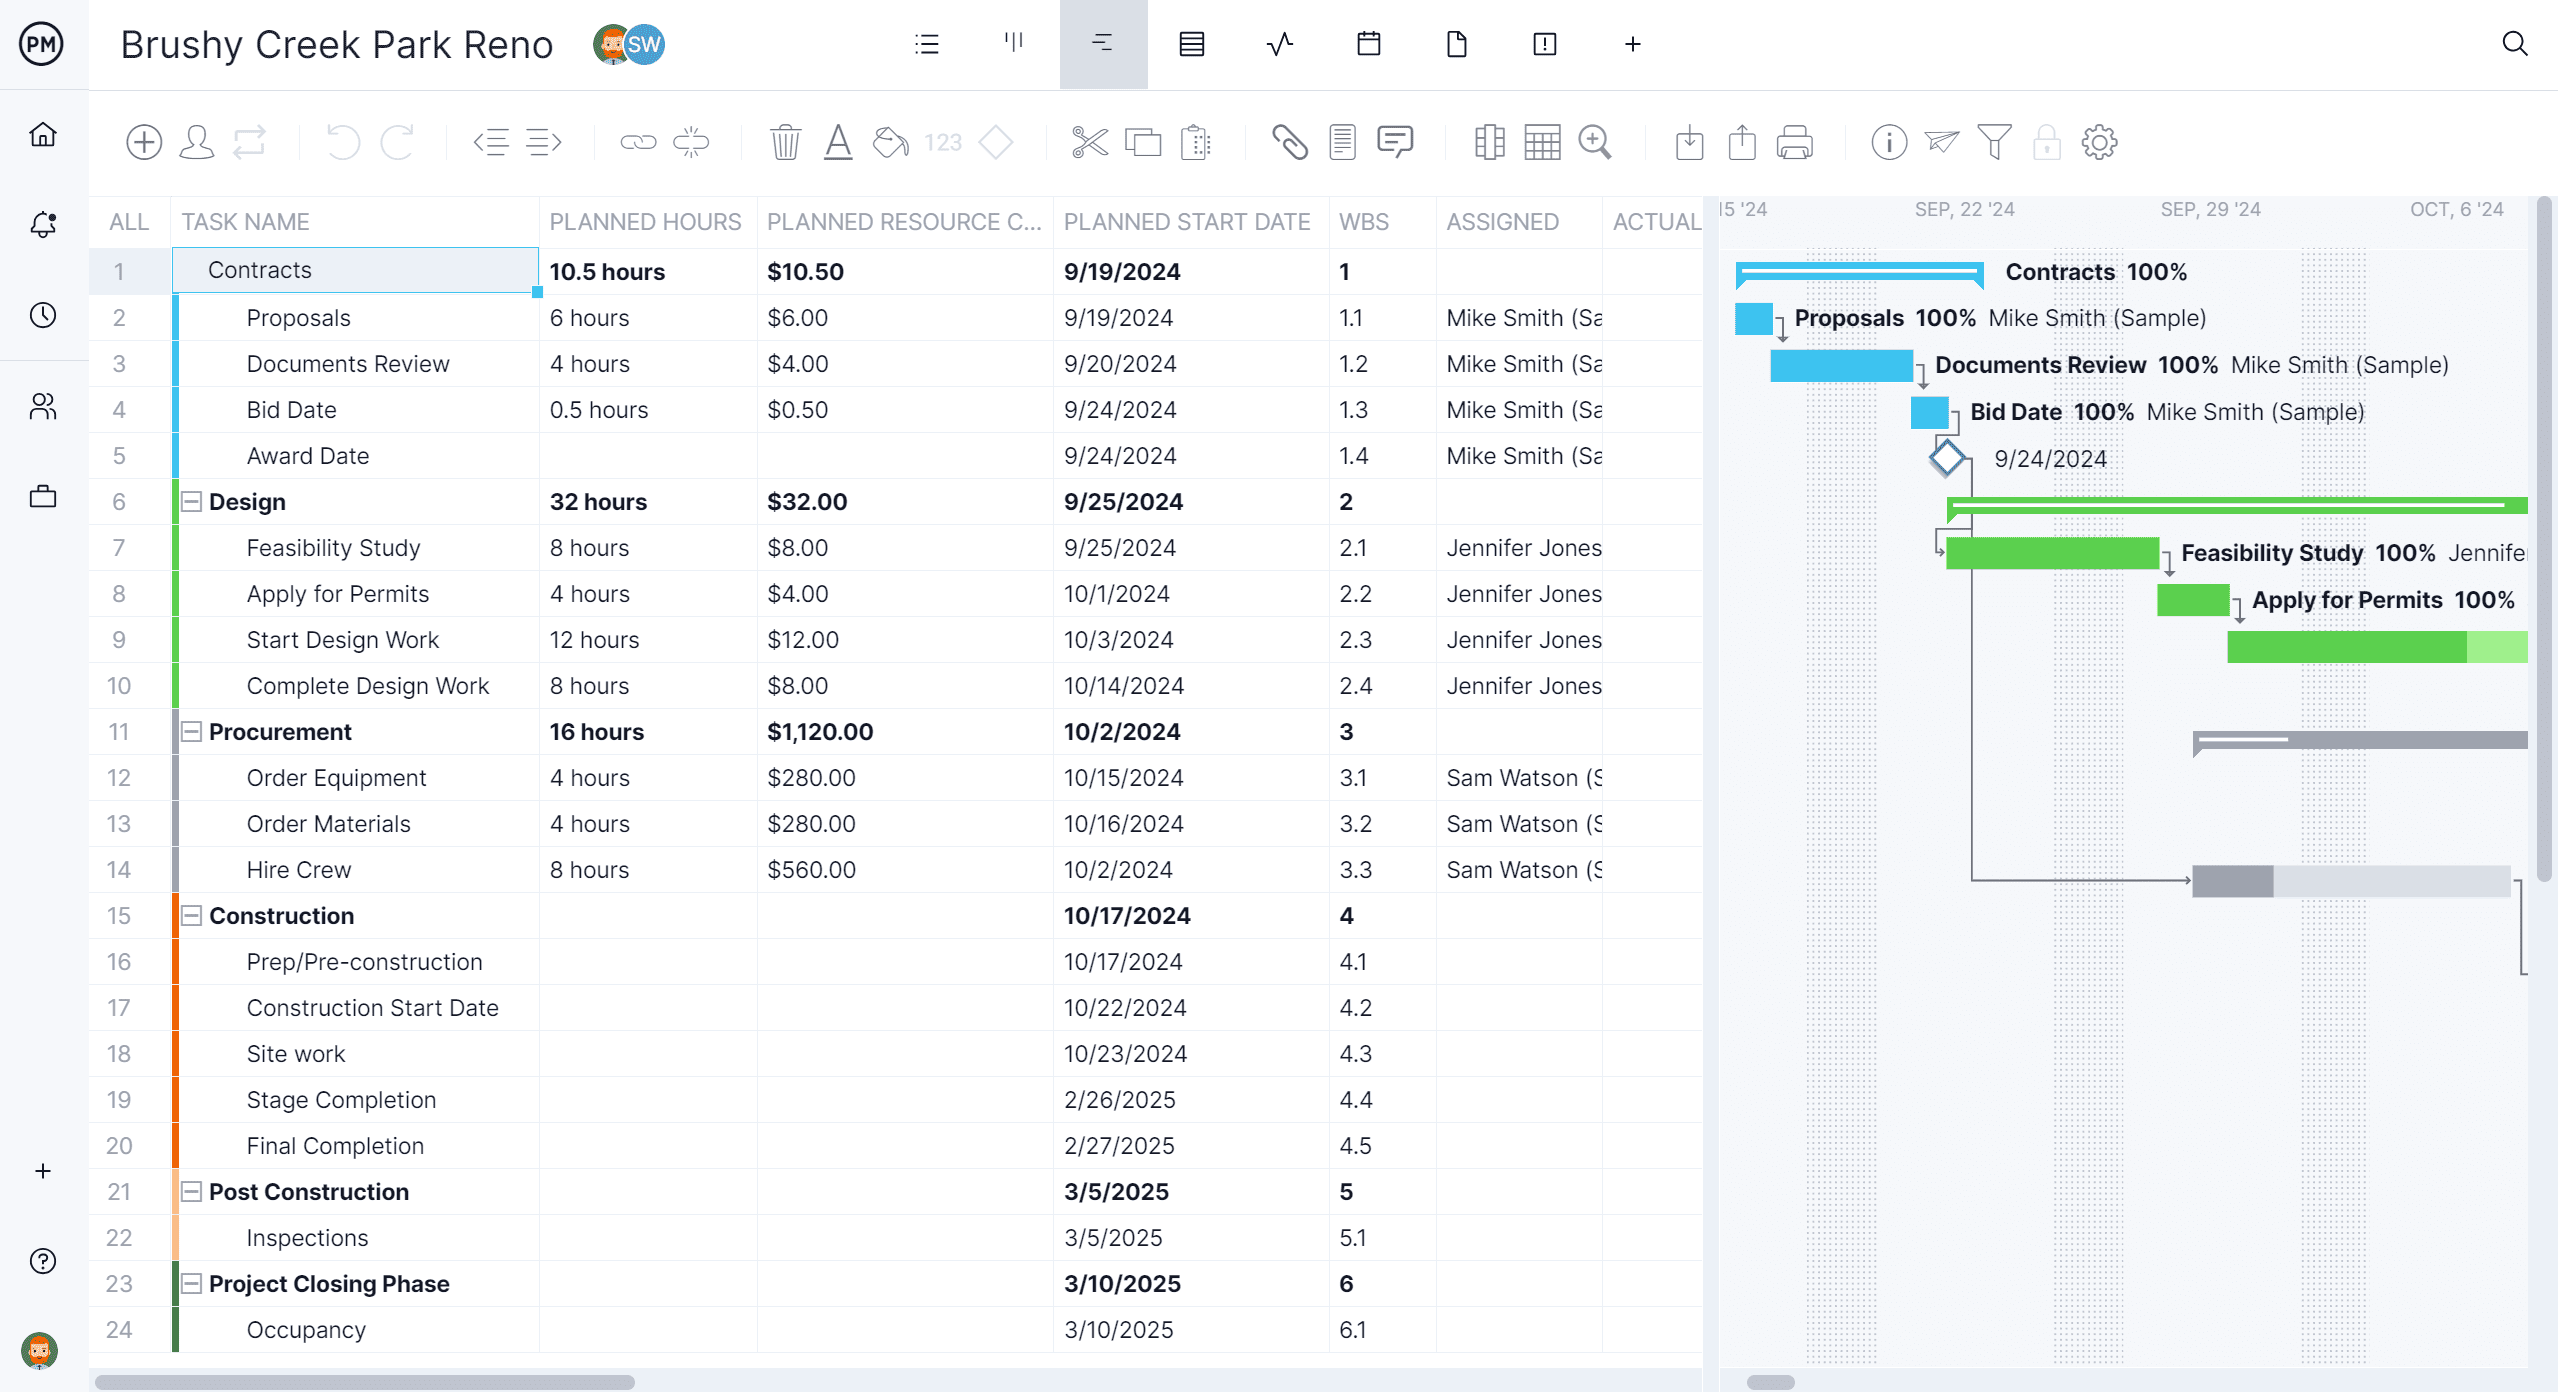
Construction Gantt Chart Example
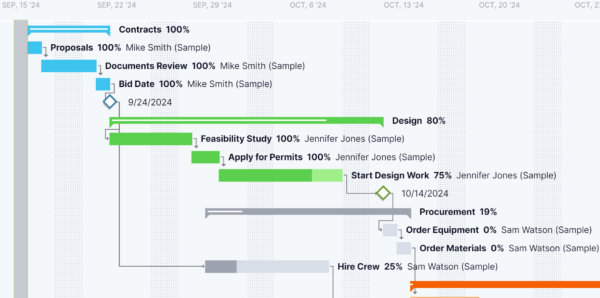
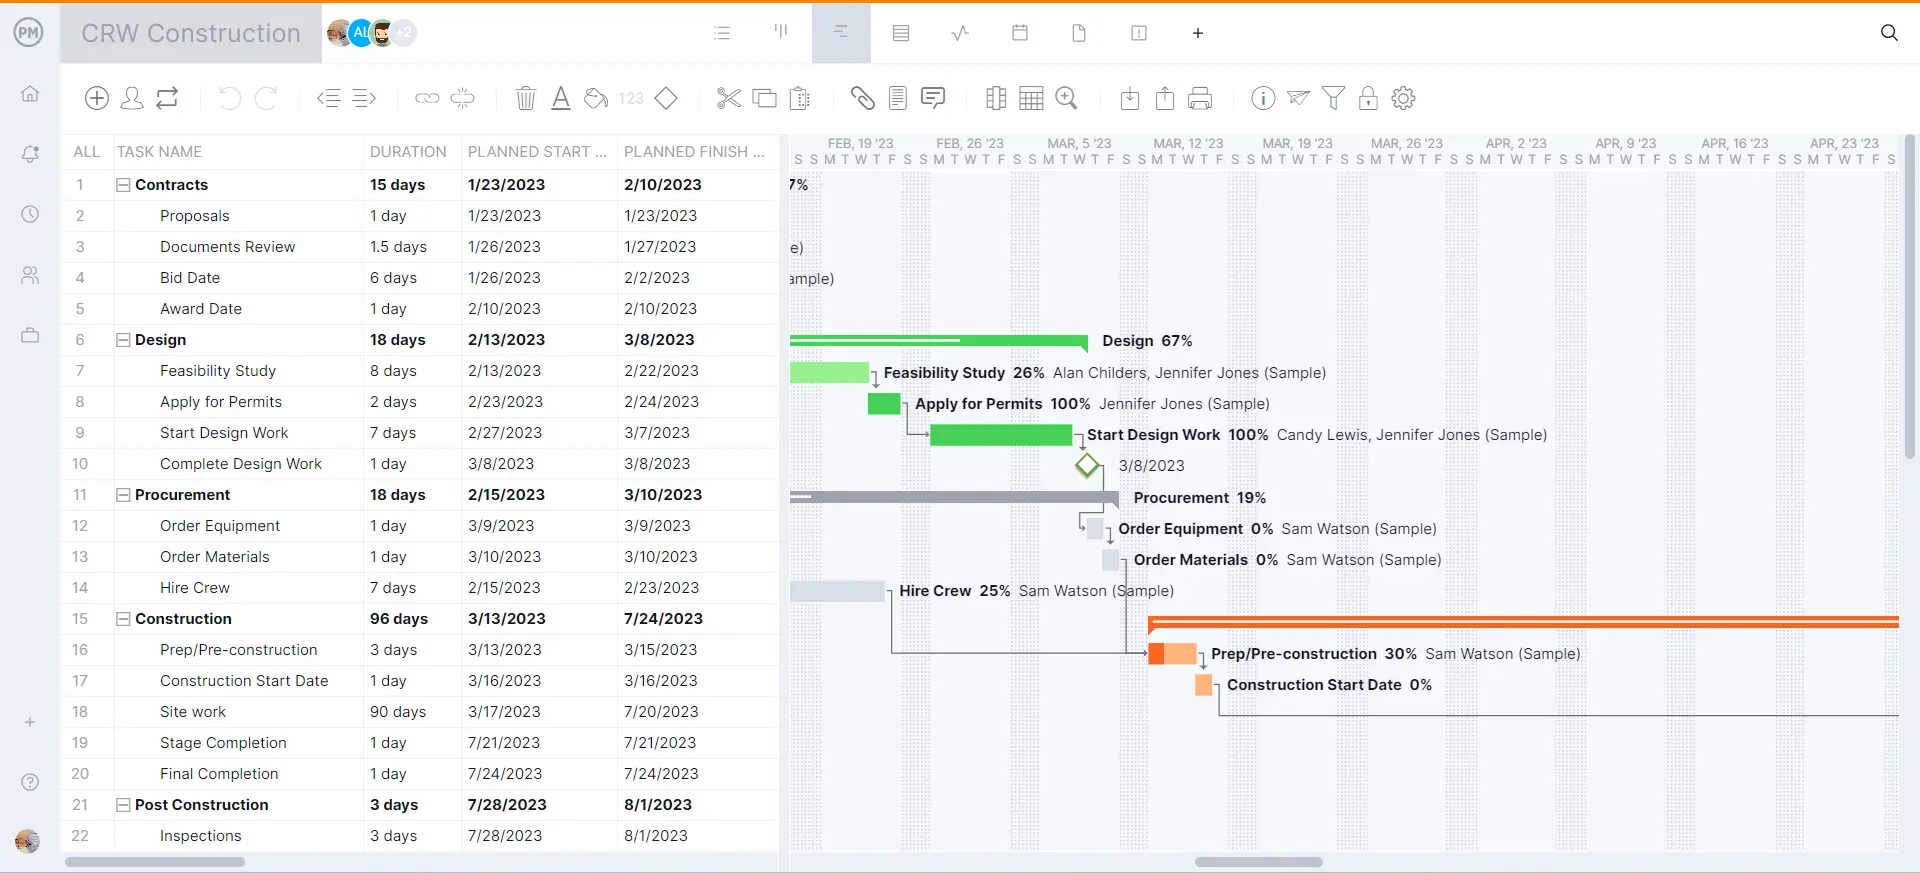
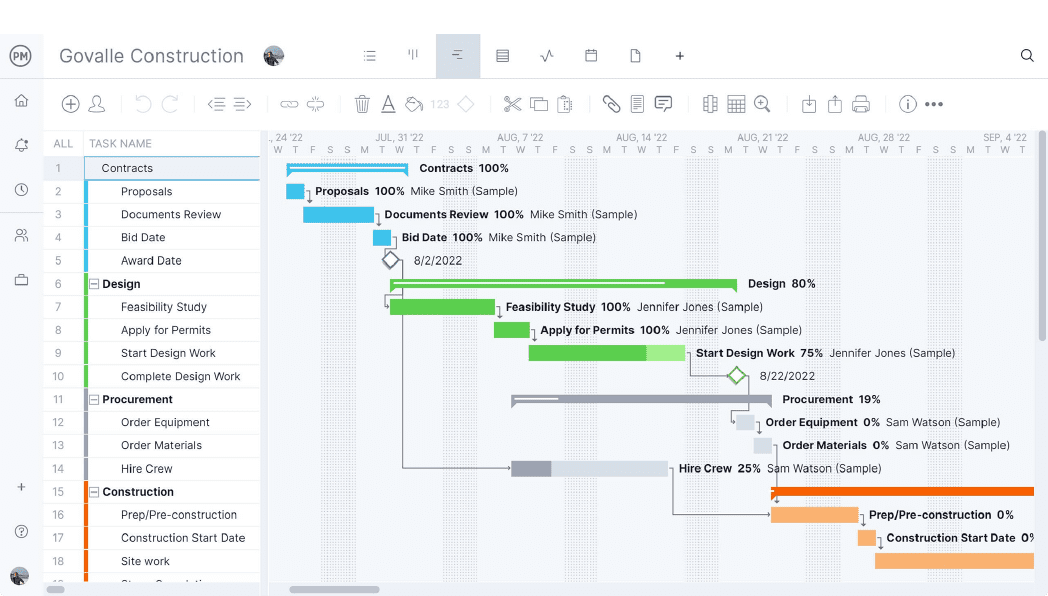
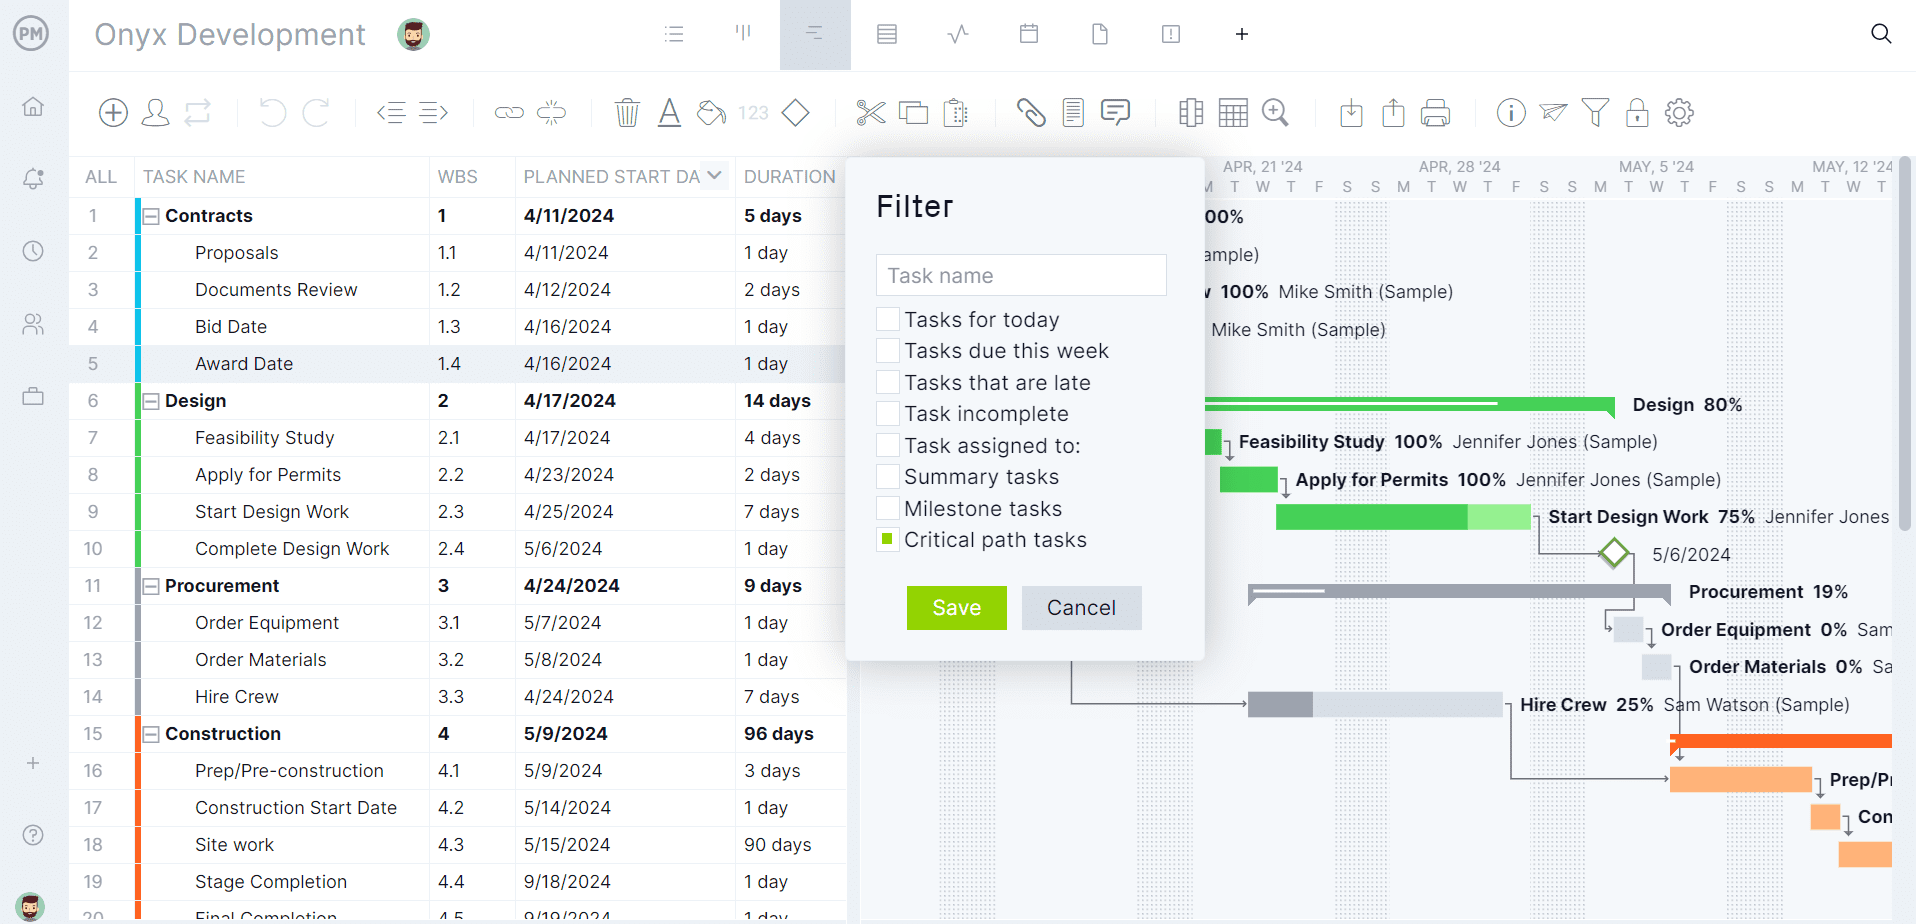
This Gantt chart example shows a construction schedule that’s divided into six project phases: contracts, design, procurement, construction, post-construction and closing.
Defining project phases is the first step when using a Gantt chart for planning a project. It helps break down the project plan into smaller steps that are easier to manage. Once you’ve defined project phases, you can proceed to identify the individual tasks for each of them, as shown in the image.
Once you’ve identified your project tasks, you’ll need to add as much information as possible about them, such as their planned due dates, duration, dependencies, resource requirements, estimated costs and other relevant details.
Once you’ve added all these details to each project task column, the Gantt chart timeline will show your project tasks, their dependencies, assignee and percent complete.
The best part of using ProjectManager’s Gantt charts to create a project schedule is that you can simply drag and drop these bars in the Gantt chart timeline to adjust the project tasks’ due dates or their duration. You can easily add or remove dependencies and identify project milestones.
Our construction schedule Gantt chart template also allows you to use other advanced Gantt chart features such as creating project baselines, finding the critical path and tracking the resource utilization and costs for each of your tasks.
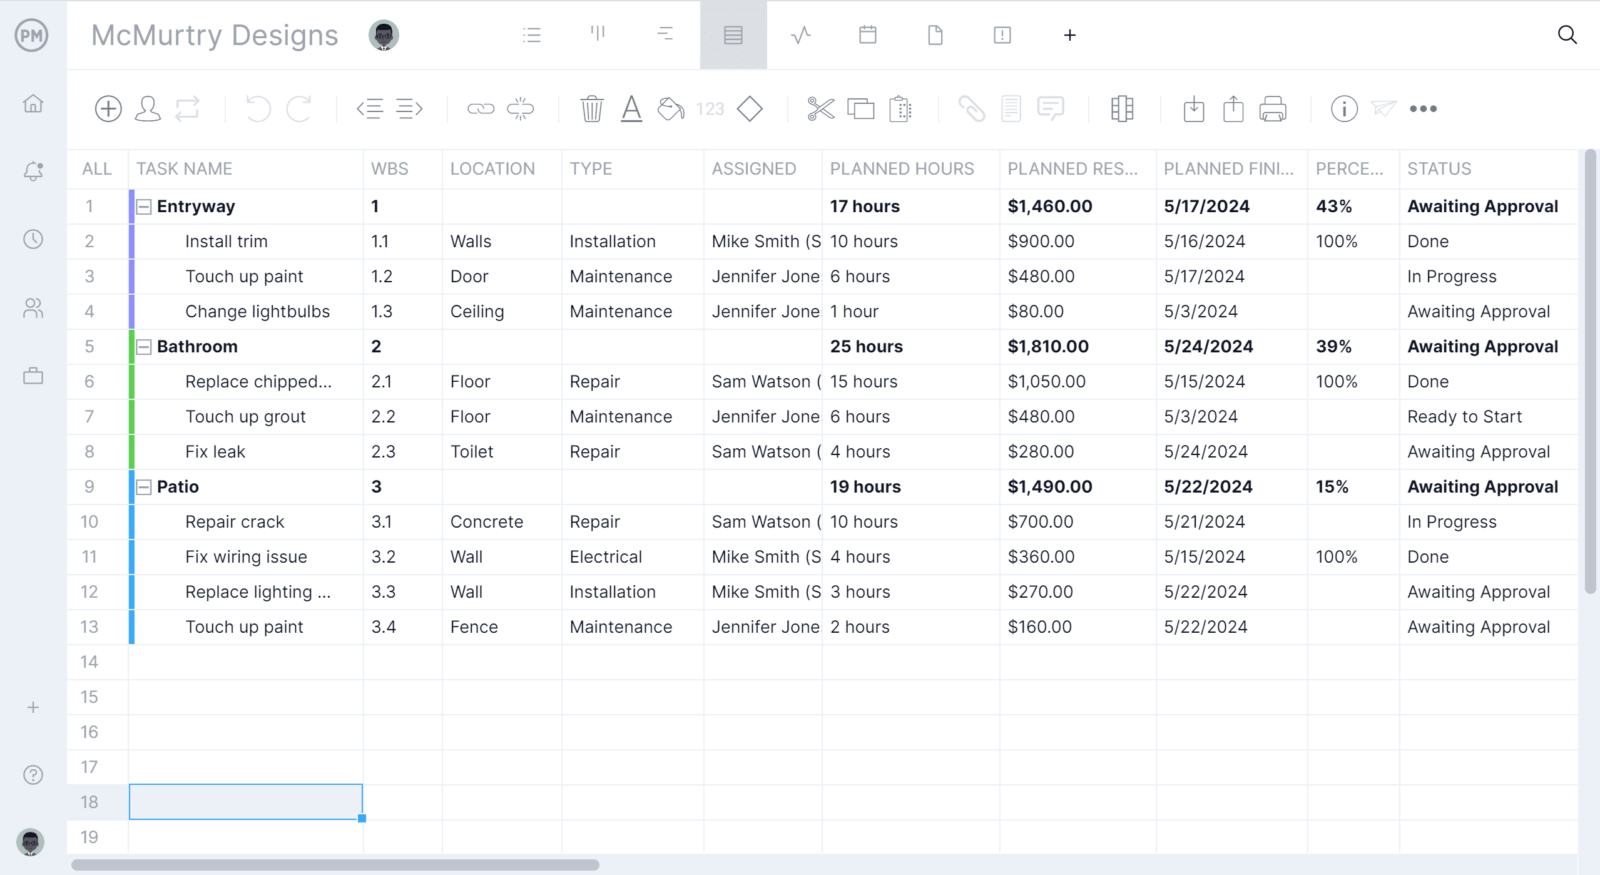
Manufacturing Gantt Chart Example
While managing the production process is completely different from managing a construction project, the steps for creating a schedule using a Gantt chart are the same. You’ll also need to define project phases, break down your project scope into tasks, identify dependencies and add project task details to the Gantt chart.
This Gantt chart example shows a manufacturing project that consists of creating a product from scratch and then creating a production schedule for manufacturing it. The phases for this manufacturing project are product ideation, design, prototyping, pre-production and production.
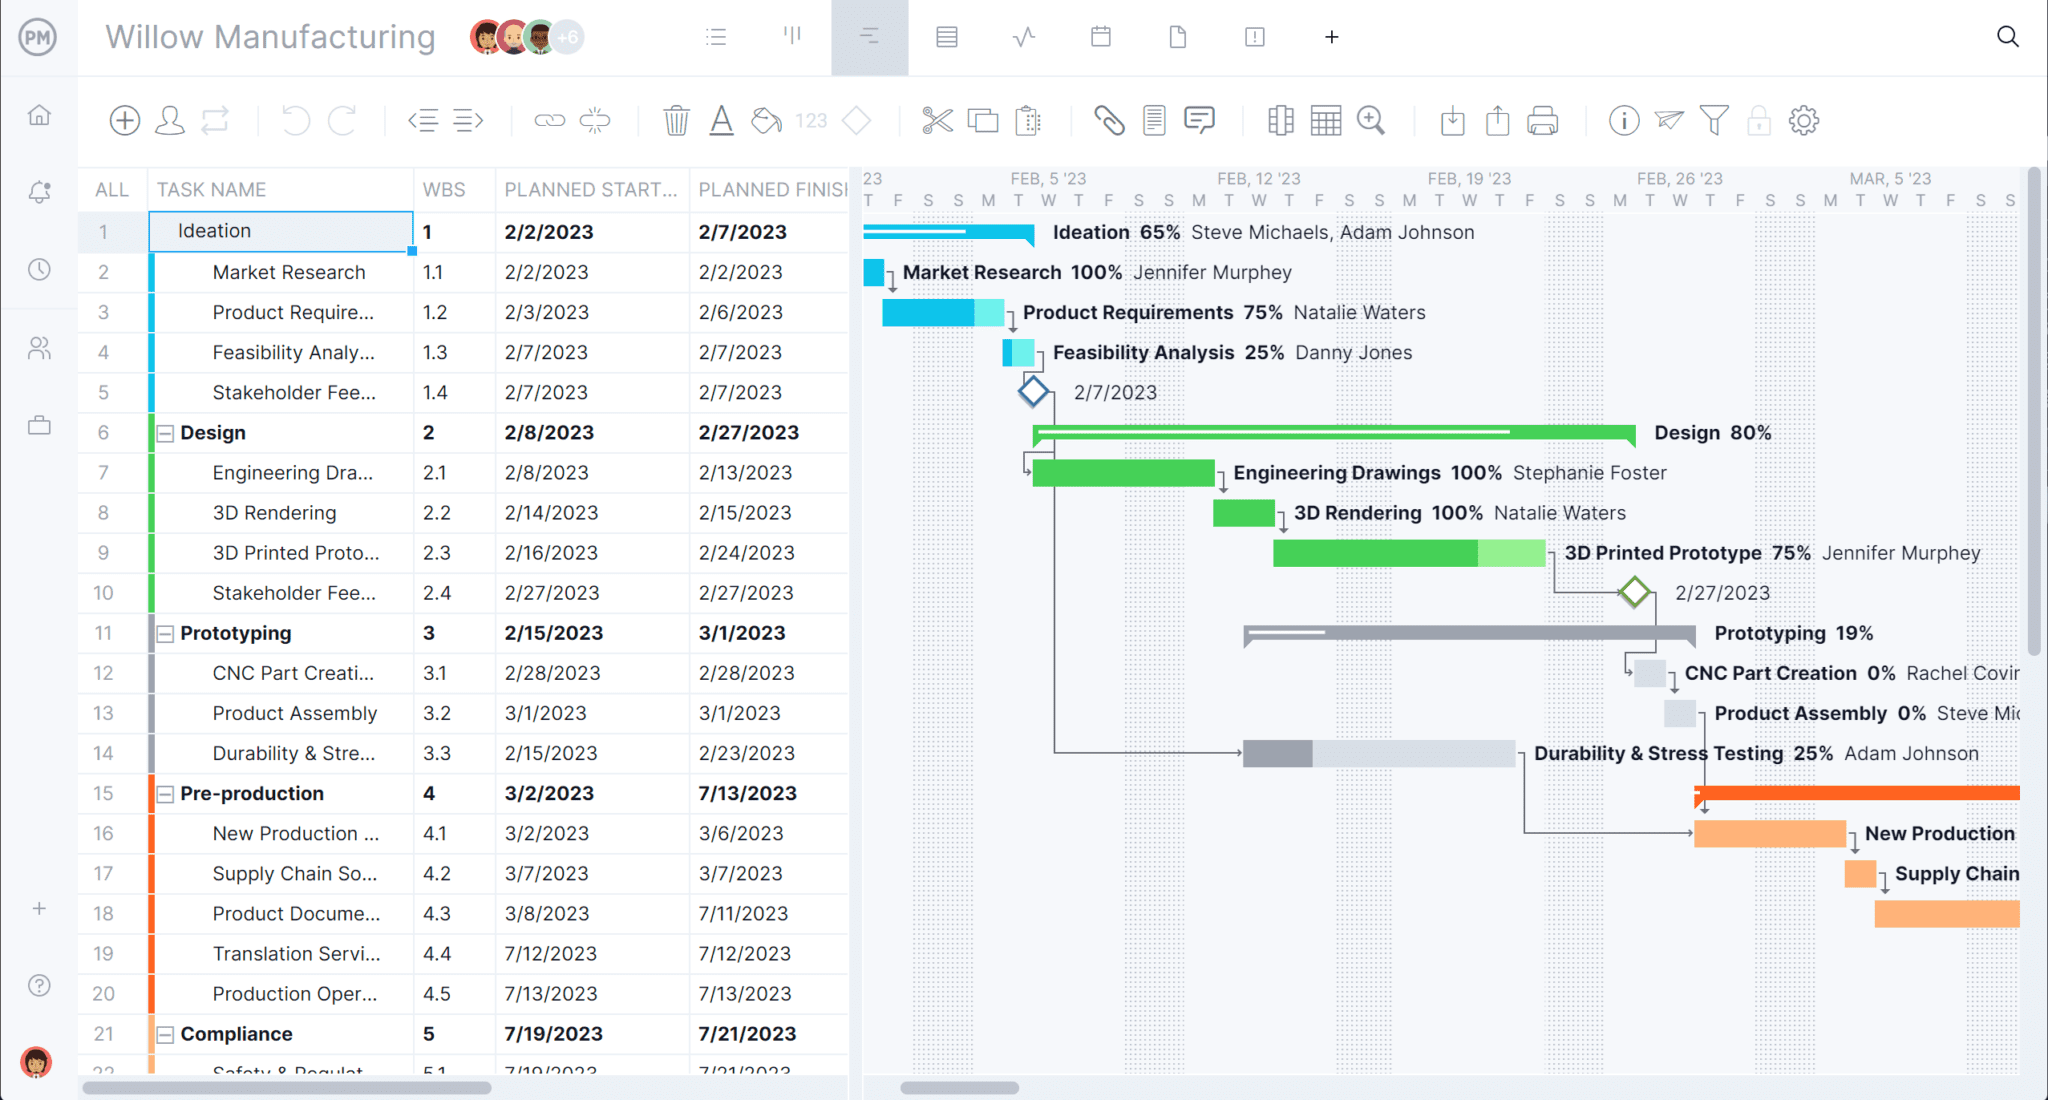
Our Gantt chart production schedule template allows you to track each step in the product development process, such as ideating your product, establishing its feasibility, creating a proof of concept, making a prototype, testing its quality and more.
Then, once you have a working prototype that’s ready to be launched into the market, you can use the Gantt chart to schedule the production process and estimate the time it’ll take to manufacture it, the needed resources and your production costs.
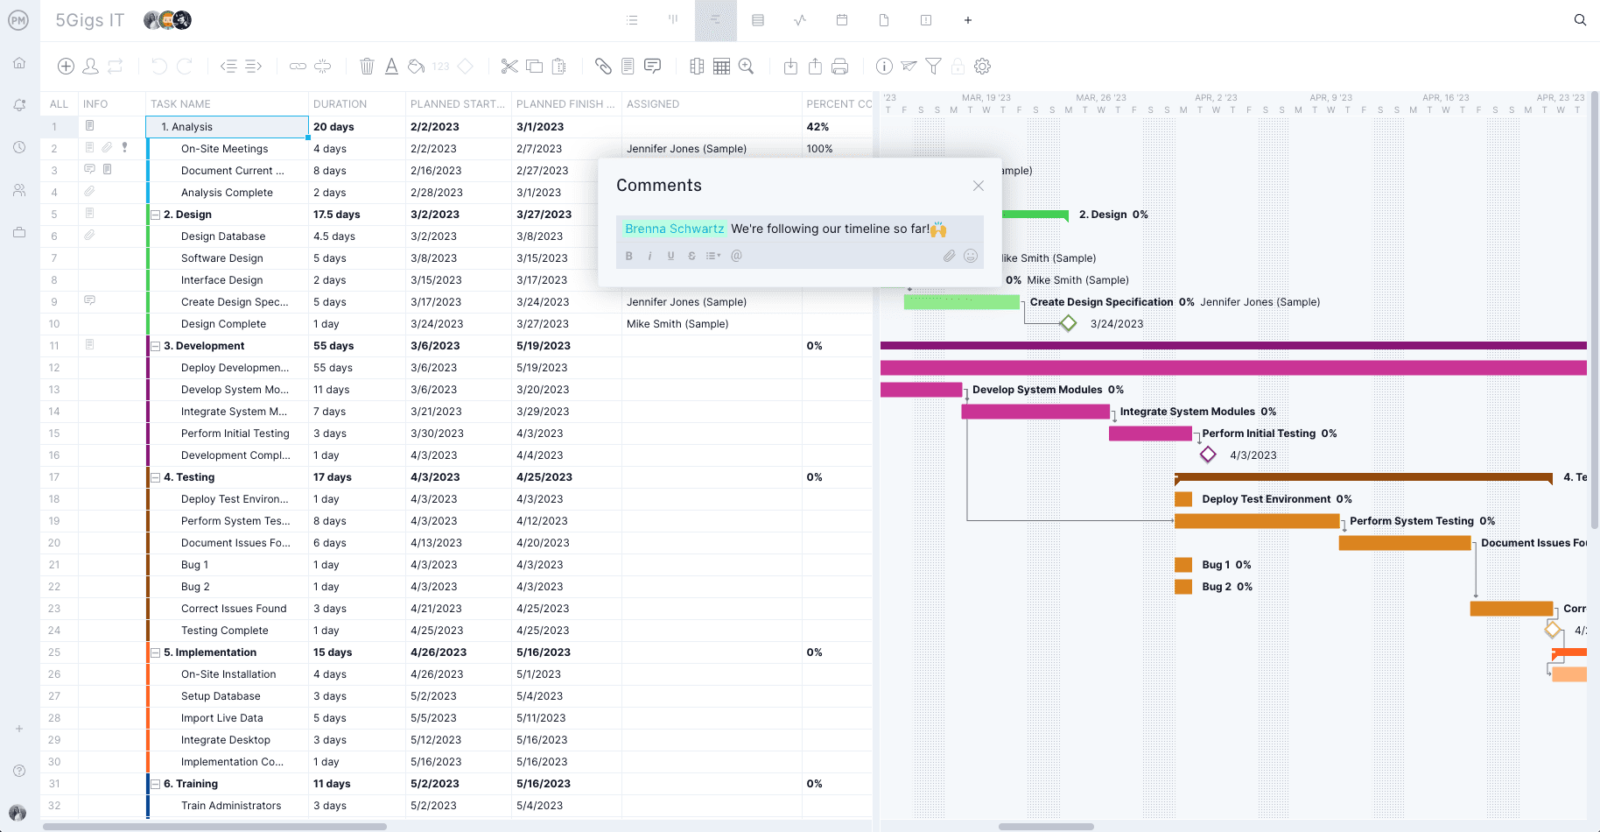
IT Project Gantt Chart Example
IT teams use Gantt charts to break down complex projects into more manageable tasks. Different phases of an IT project laid on a Gantt include requirements gathering, development, testing and deployment. In addition to project planning, an IT team can use a Gantt chart to meet deadlines, estimate task durations based on team capacity, quickly identify bottlenecks and plan sprints in agile environments.
In the IT project plan below, for example, the analysis phase includes on-site meetings and discussions with stakeholders. It identifies the planned start and finish dates in addition to the planned resources to complete each task.
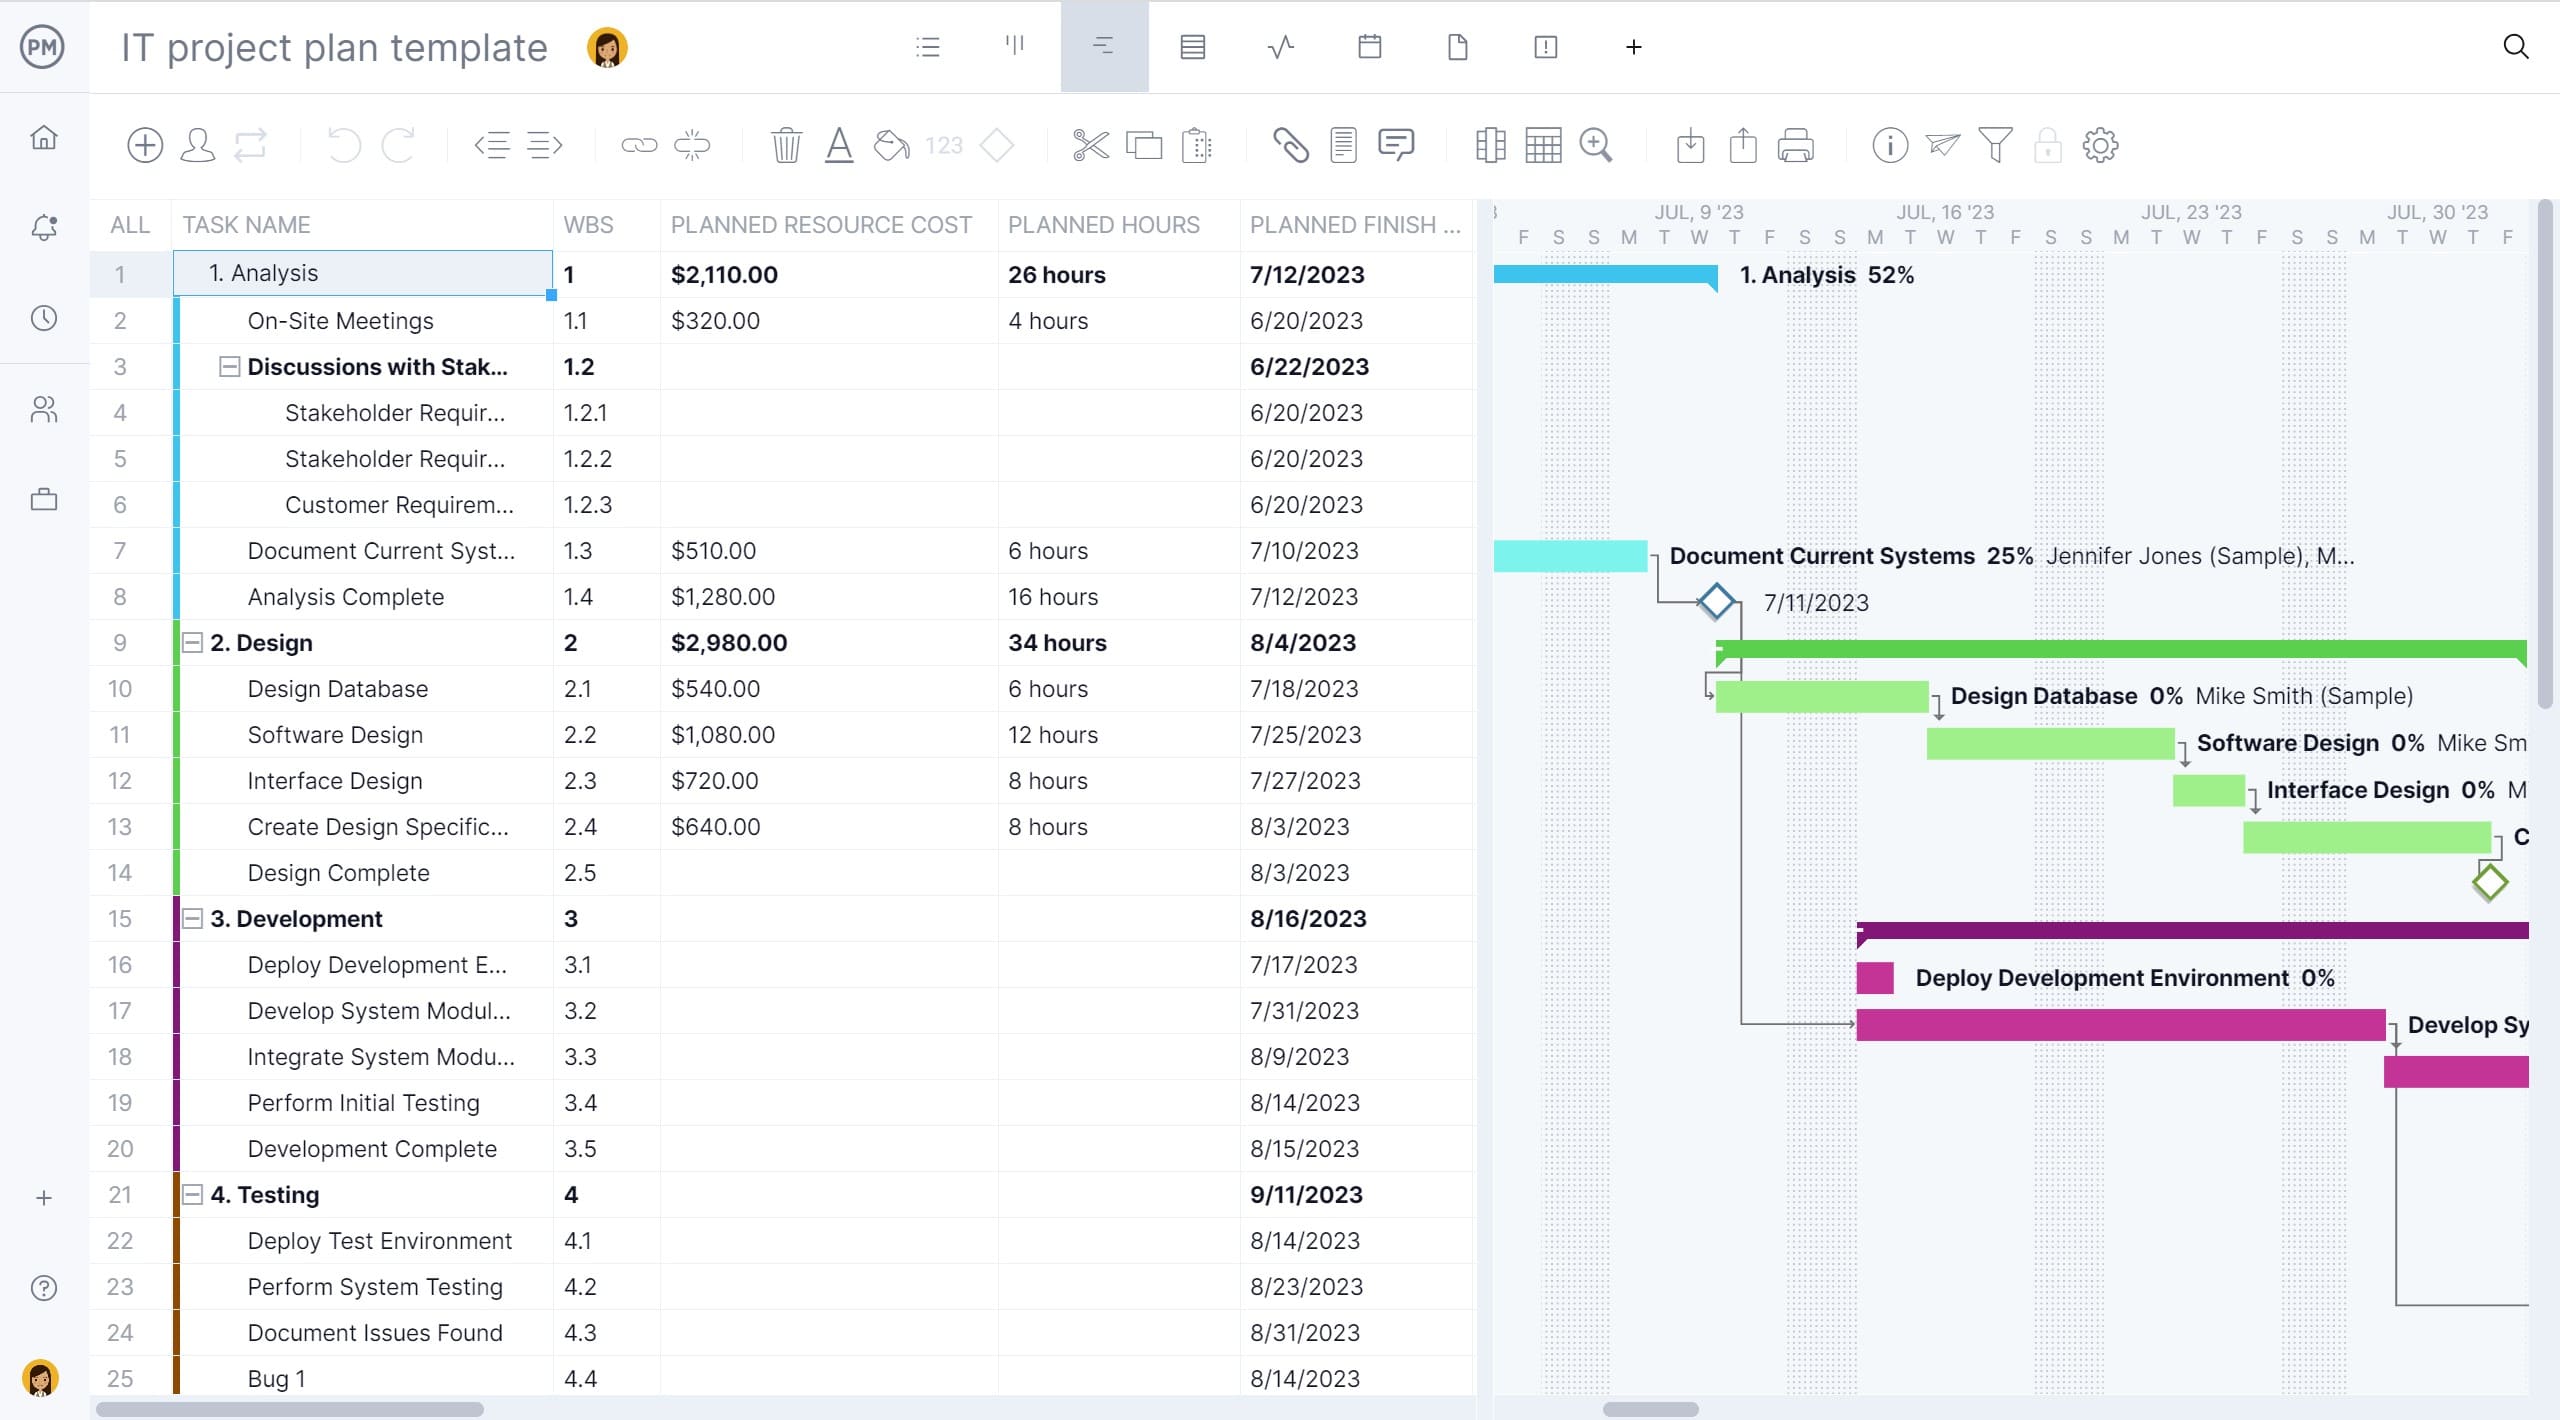
Software development teams also benefit from using a Gantt chart. The clarity a Gantt chart provides allows for realistic timelines for each project phase, clearly mapping out the tasks and who will execute them. As progress evolves, project managers can compare it against the plan and make changes as needed. Milestones may include design approval, testing complete and the release.
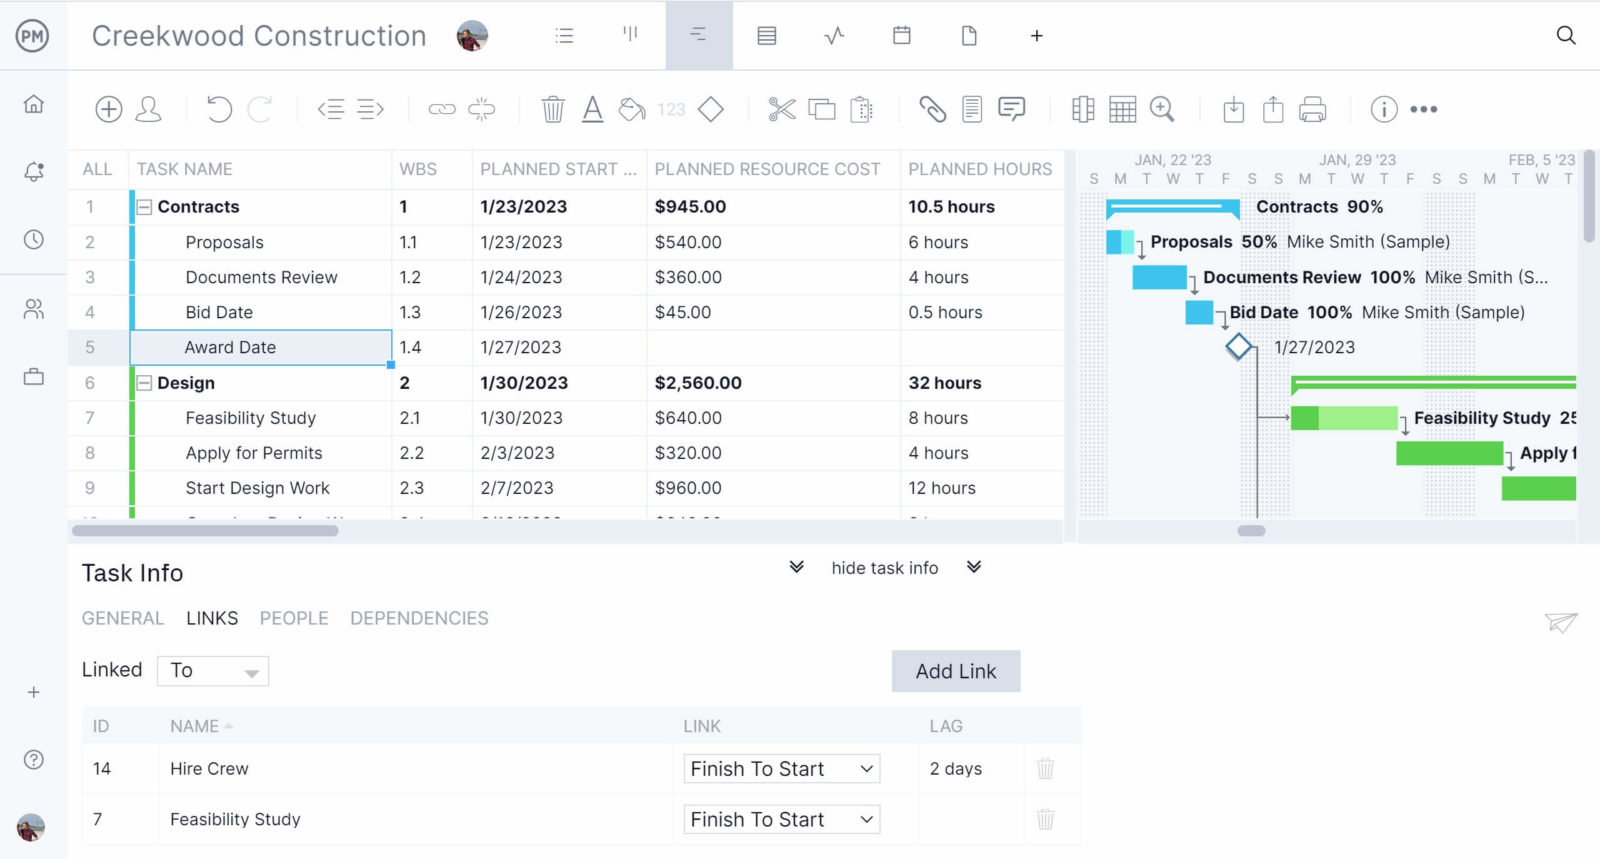
Gantt Chart Sample
Need help building a Gantt chart? Try ProjectManager’s free Gantt chart sample and practice adding tasks, dependencies, phases, milestones and more on a dynamic Gantt chart.
On the left-hand side of this Gantt chart sample is the data grid, where the various phases of the project are outlined. Under each color-coded phase are the tasks associated with it, including WBS, assignees, due dates and other resources needed to execute the scheduled tasks.
The visual timeline on the right is where things get interesting. You can see the entire project in one place, dependent tasks can be linked and milestones added to indicate important dates. Put your Gantt chart knowledge to the test using this sample and build one today. Get started for free.
What Is a Gantt Chart Used For?
Because the Gantt chart is such a diverse project management tool for identifying timelines and task dependencies, it can be used in any industry or field. Here are some examples.
- Gantt charts in project management: Gantt charts compile the information project managers need to create a visual timeline that shows all the elements of a project plan in one place. With Gantt charts, project managers can schedule projects, allocate resources, set cost and scope baselines, and identify the critical path.
- Gantt charts in construction: Construction Gantt charts are used by project owners, general contractors and construction project managers to plan the different phases of a construction project, such as initiation, pre-construction and procurement. However, Gantt charts can also be used on a smaller scale to manage everyday tasks.
- Gantt charts in software engineering: Software engineering teams use Gantt charts to create project roadmaps, which are essential for task management when developing new products. This is done by simply mapping software development tasks on a timeline, just as if it was a project plan.
- Gantt charts in manufacturing: Gantt charts can be used to plan, schedule and track multiple aspects of the manufacturing process. For example, you can use Gantt charts to create product roadmaps, production schedules and map the product development cycle.
- Gantt charts in project portfolio management: Gantt charts can be also used to create a portfolio roadmap, which is a timeline that allows project portfolio managers and project management offices (PMOs) to track the progress of multiple projects.
- Gantt charts in event planning: A Gantt chart for event planning identifies, organizes and plans the tasks needed to plan an event such as budgeting, securing vendors and getting the event set up on time.
These are only some of the most common use cases for Gantt charts, but they can be used for managing projects across industries. Now, let’s take a closer look at how Gantt charts are used in project management.
How Are Gantt Charts Used in Project Management?
Gantt charts can be used to plan, schedule and track projects of all sizes and industries, mainly because they’re compatible with most project management methodologies, such as waterfall and agile.
Gantt Charts in Waterfall Planning
Waterfall project management consists in planning a project in sequential phases. These project phases are planned in advance and then executed in order from beginning to end without making many changes to the original project plan. Gantt charts are ideal to map out such projects as they allow project managers to visualize task dependencies and establish task sequences on a project timeline.
Gantt Charts in Critical Path Method (CPM)
One use case of Gantt charts is to make it easier to identify the critical path and the needed resources to achieve project success. The Gantt illustrates task dependencies to identify which are critical to complete to keep the project on track. This clear, visual representation that a Gantt chart provides can help project managers better prioritize the critical path.
Gantt Charts in Agile Planning
Unlike waterfall, agile planning consists in planning short iterations of work of one to two weeks known as agile sprints, where teams plan and execute their work. They then have short meetings where they review their performance and plan the next sprint. While Gantt charts aren’t commonly used to plan sprints, they help agile teams to map out their project plan or product development roadmap at large, which lets them see the bigger picture of their projects.
Who Uses a Gantt Chart?
It used to be that Gantt charts were the exclusive tool of formally trained project managers. These were people planning complex projects of all different types: construction, engineering, military, manufacturing, infrastructure, IT and more. Creating long task lists and complex project schedules with lots of moving parts, required training in the art and science of task management, critical path analysis, baselining and so on.
Today, nearly everyone can use a Gantt chart to help them visualize their tasks. Because all the difficult work is now done by project management software, anyone can just create a simple task list, add start and end dates, and the software does the work instantly by displaying your tasks over a project timeline.
Gantt charts can be used by all kinds of teams, such as:
- IT & software development teams
- Project management teams
- PMOs
- Marketing teams
- Professional services teams
- Engineering & architectural teams
- Construction teams
- Manufacturing teams
- Product development teams
Here are some examples of potential users of Gantt charts:
- Project managers
- General managers
- Team leaders
- Operations managers
- Scheduling managers
- Marketing managers
- Executives such as CEOs & CTOs
- Anyone who wants an instant view of a project timeline
How to Use a Gantt Chart
Now that we have more context about Gantt charts, let’s explore how to use a Gantt chart for planning, scheduling and tracking your projects. Below, we’ll explain some of the most common uses for Gantt charts in project management.
Create a Work Breakdown Structure
Before you can use a Gantt chart to create a project schedule, you’ll need to first identify all the individual tasks that make up the total amount of work that’s needed for your project. A work breakdown structure (WBS) is a tool that can help you with this process. It’s important that you do this during the project planning phase so you don’t miss any project tasks.
Create a Task List and a Gantt Chart Timeline
Now create a Gantt table by listing down your project tasks, their due dates, duration and any other details you’d like to track about them such has resource requirements or costs. Then Use this information to create Gantt chart timeline, which at a basic level should show the dates and duration of project tasks.
Identify Task Dependencies
One of the key aspects that differentiate Gantt charts from other project planning tools is that they allow project managers to identify and visualize task dependencies. A task dependency is simply the relationship project tasks have among each other that dictates the order in which they must be completed. While Gantt charts let you represent task dependencies, these can’t be automatically determined. It’s your responsibility as a project manager to define them, otherwise, the project schedule won’t be accurate.
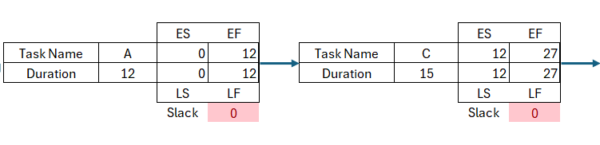
Find the Critical Path of Your Project
The critical path of a project is the longest sequence of tasks that need to be executed. It’s important to determine what your critical path is because if those tasks are delayed the whole project completion will be delayed. Luckily some Gantt chart software alternatives will automatically do this for you.
Track Gantt Chart Milestones
Gantt charts allow you to track project milestones, which are important events that occur at some point in your project timeline. Project milestones can be used to create a milestone chart, which is a simplified version of your project timeline that summarizes major activities, project deliverables and accomplishments so that you can track how a project is progressing from a high-level view.
Allocate, Schedule and Track Resources
Gantt charts can be more than just a project scheduling tool, they can also be used to estimate what resources are needed to complete your project, allocate resources for the execution of work and track resource utilization throughout the project life cycle. ProjectManager’s Gantt chart, for example, syncs with real-time dashboards that allow you to monitor the utilization of project resources in real time and workload charts that let you balance your team’s workload.
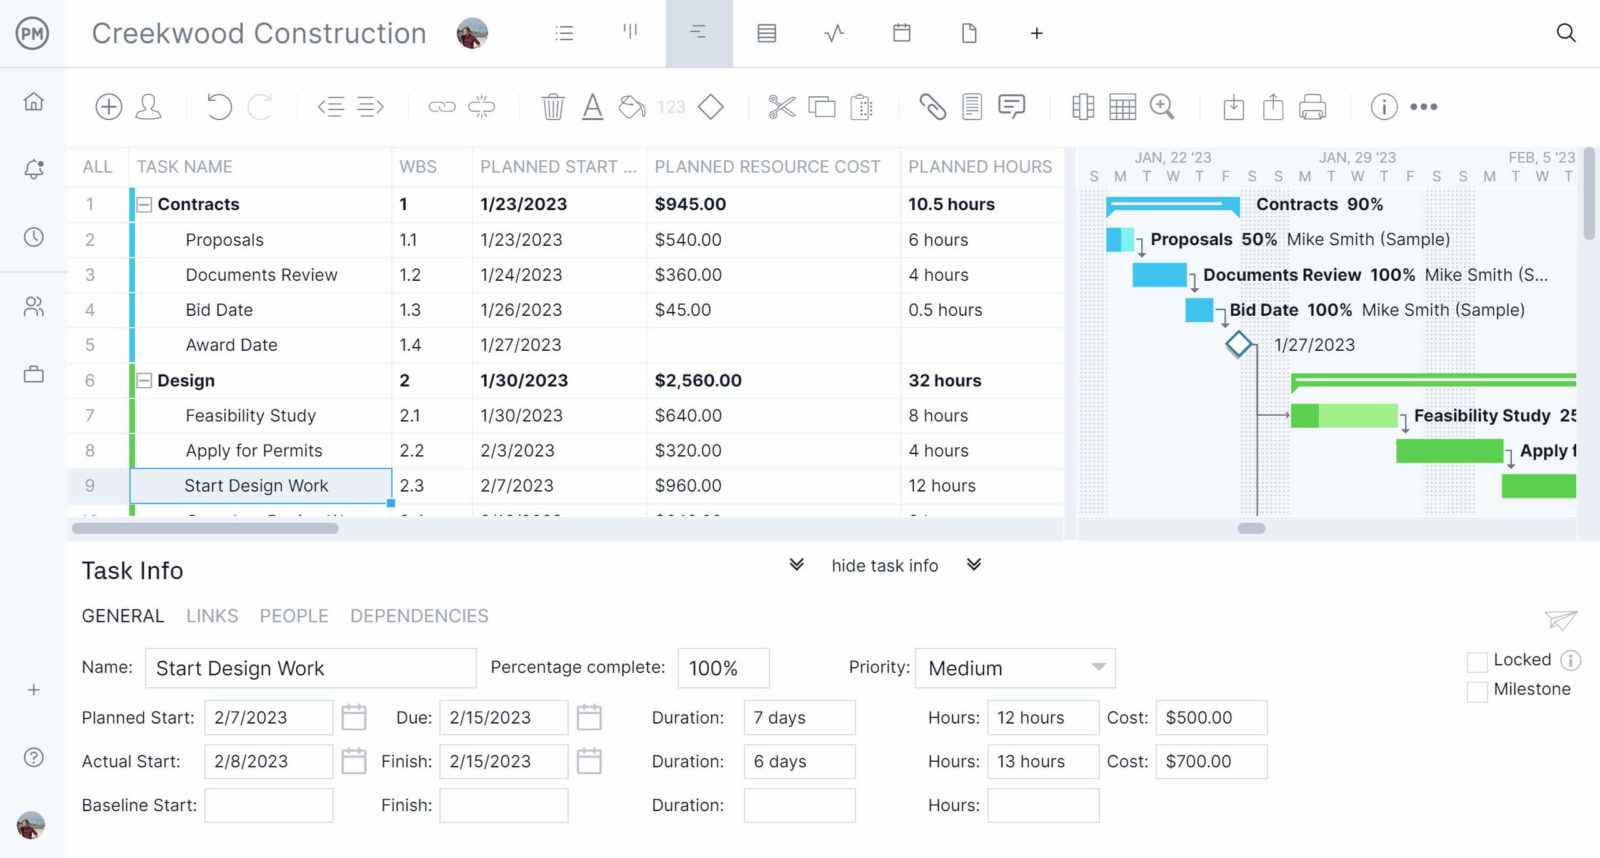
Create Project Baselines and Compare Planned vs. Actual Results
Gantt charts should be used to map your project plan, but also record the actual results of your project. ProjectManager’s Gantt chart allows you to compare the estimated costs and due dates of your tasks against the actual values so you can determine whether your project is being executed within the boundaries of your project budget or schedule.
Benefits and Advantages of a Gantt Chart
The Gantt chart is one, if not the most important project management tool to plan, schedule and track projects. Not only are they easy to understand, but nearly everyone involved in the project can reference the Gantt chart throughout the project. Used across industries, Gantt charts enhance project planning, task management, scheduling, monitoring and communication.
Here are some of the main pros and cons of using Gantt charts to manage projects from any industry.
- Gantt charts allow project managers to turn complex project plans into a visual project timeline that’s easy to understand.
- Gantt charts are the perfect tool to compare the actual performance of your project team against the original project plan, schedule and cost baselines to determine whether a project is being completed on time and under budget.
- Gantt charts allow project managers to understand both the scope of a project and its schedule from start to end, including task dependencies.
- Gantt charts are also considered a resource management tool because they allow project managers to understand how they’re allocating their resources.
- Gantt charts are a shared reference document for all team members which helps to improve communication and collaboration.
- By showing project bottlenecks in real time, Gantt charts can result in more proactive risk management.
- As a historical record, Gantt charts show a visual history of project timelines which can help improve post-project reviews and lessons learned.
Disadvantages of Using a Gantt Chart
Even though Gantt charts are one of the most important project management tools, there are some cases in which they might not be the ideal solution. There is no hard-and-fast rule about when to use a Gantt chart, so project managers can use their best judgment based on their industry and expertise to determine if the pros of a Gantt outweigh the cons.
- Gantt charts can be hard to understand for some team members and stakeholders who aren’t used to them.
- Not all Gantt chart software available in the market offers the same features, which is something to look out for as some lack important features.
- Other project tools such as task lists or kanban boards can be an easier method to keep track of tasks, such as when managing small teams, or short-term projects.
- Gantt charts operate in a linear fashion and aren’t very dynamic for agile projects.
- In large projects with many tasks, Gantt charts can easily become cluttered and difficult to read.
- For projects and initiatives that require more depth, Gantt charts might not capture all of the detailed information such as specific resources, task requirements or responsibilities.
- If there are frequent changes in tasks or timelines, it can be time-consuming to always make timely changes to the Gantt chart.
Gantt Chart Alternatives for Project Management
Gantt charts are not the only project management chart you can use to create a project schedule or manage project tasks. There are other tools you can use such as PERT charts, kanban boards or network diagrams. Here’s how Gantt charts compare to these tools.
Gantt Chart vs. Network Diagram
Network diagrams are a project planning chart that can help you visualize the order in which tasks must be completed, so everyone on your team has a clear idea of how work will be executed. Additionally, project network diagrams can help identify task dependencies that might be in your project plan, which is an important factor to consider when creating a project schedule.
In project management, network diagrams are used as part of the program evaluation and review technique (PERT) and the critical path method (CPM), which are two important project scheduling methods.
However, network diagrams can only help you during the project scheduling process, but can’t be used for tracking the progress of your project, as they lack task, resource or cost-tracking features.
Gantt Chart vs. PERT Chart
PERT charts are a network diagram that allows you to map the task sequences that make up your project, estimate its total duration and identify critical path activities.
To do so, you’ll need to use the PERT chart formula, which factors in the start and finish dates of your project tasks, dependencies between them and estimated duration.
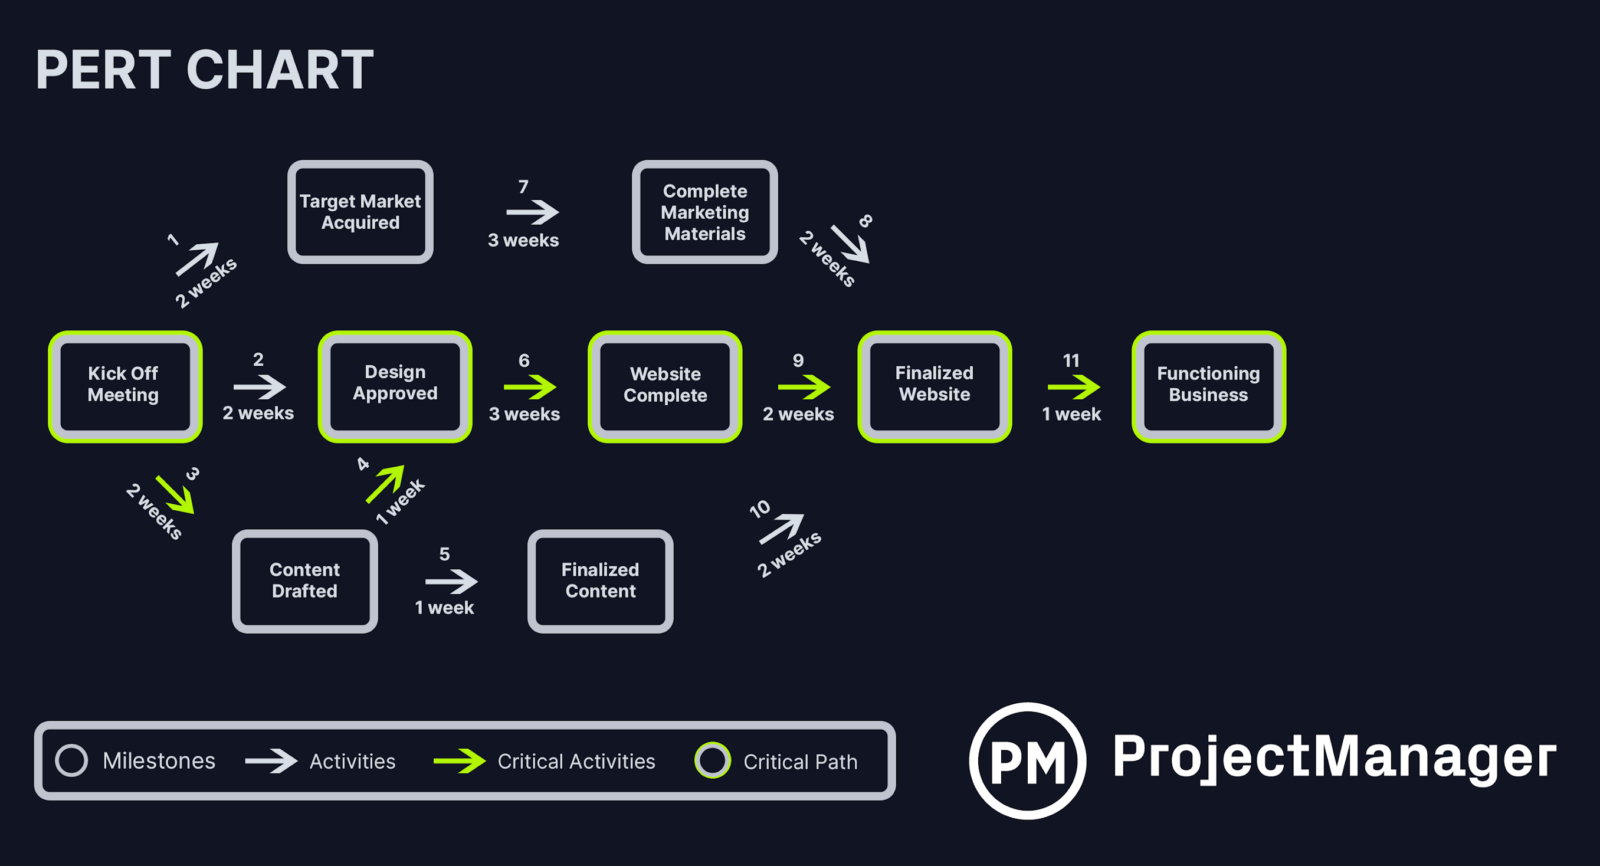
However, PERT charts aren’t as versatile as Gantt charts as they won’t allow you to assign tasks to your team members, create a project timeline or monitor the percentage of completion of tasks.
Gantt Chart vs. Kanban Board
Kanban boards are a popular task management tool that can be used for managing projects across industries. A kanban board consists of a set of columns and cards. The columns indicate the status of a project task, such as “to do” or “completed” while kanban cards represent project tasks.
Kanban boards are a great task management tool for managing the everyday tasks and workflows of your team but they won’t allow you to create a project timeline or get a high-level view of your project plan like a Gantt chart would. This makes Gantt charts a better tool than kanban boards for project planning and scheduling.
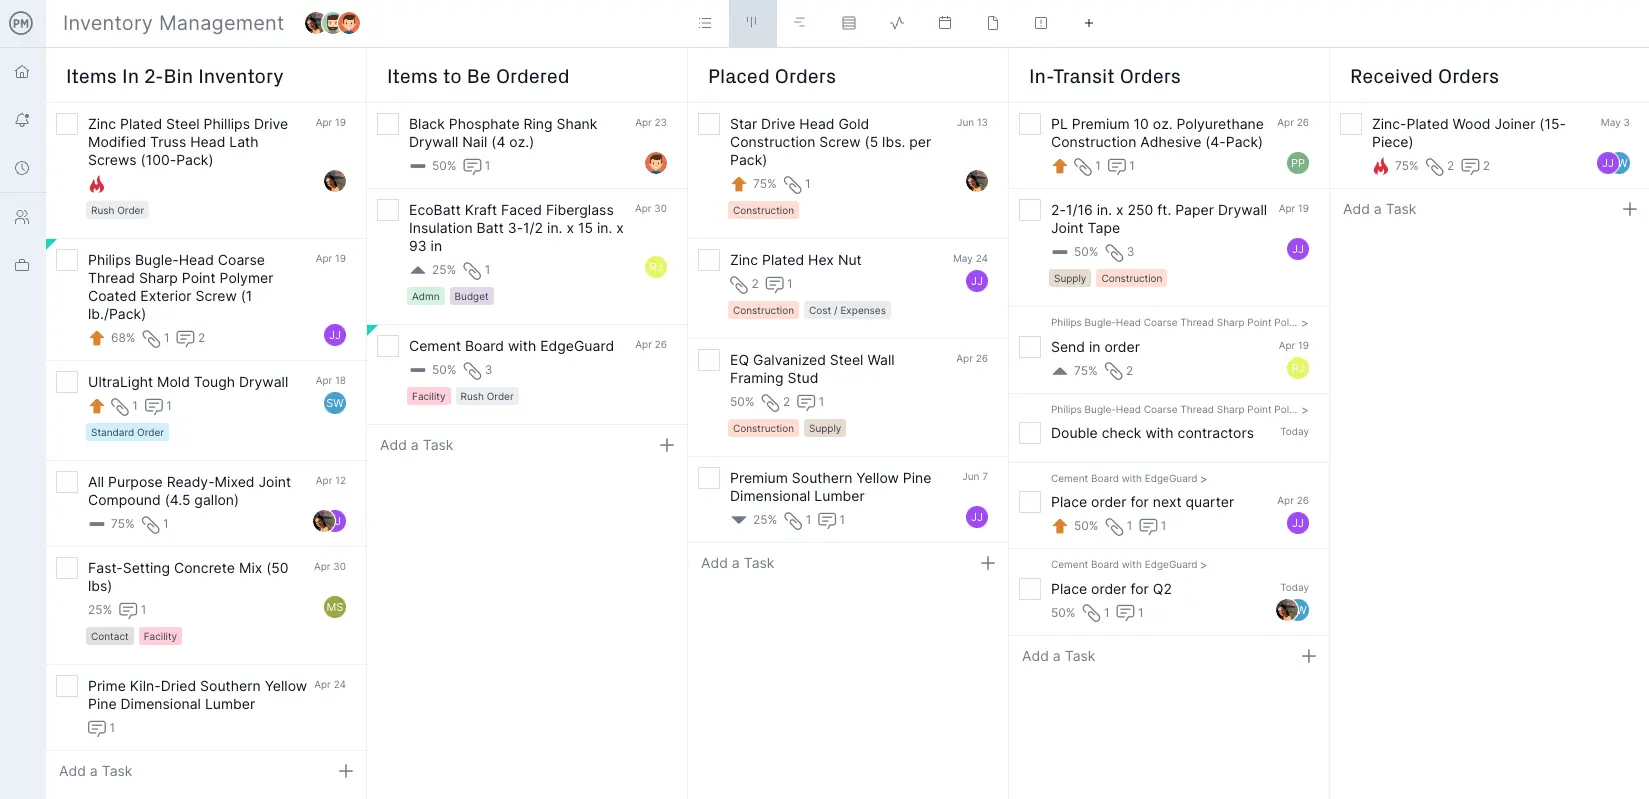
This doesn’t mean you can’t use Gantt charts and kanban boards for managing your projects. In fact, this is greatly advised, as each of these project management tools can help you manage your projects from different perspectives.
Gantt Charts for Excel, PowerPoint & More
We’ve created several Gantt chart templates that can facilitate the process of creating and using a Gantt chart to manage your projects. Simply enter your project information and follow the instructions to create a Gantt chart for projects in minutes.
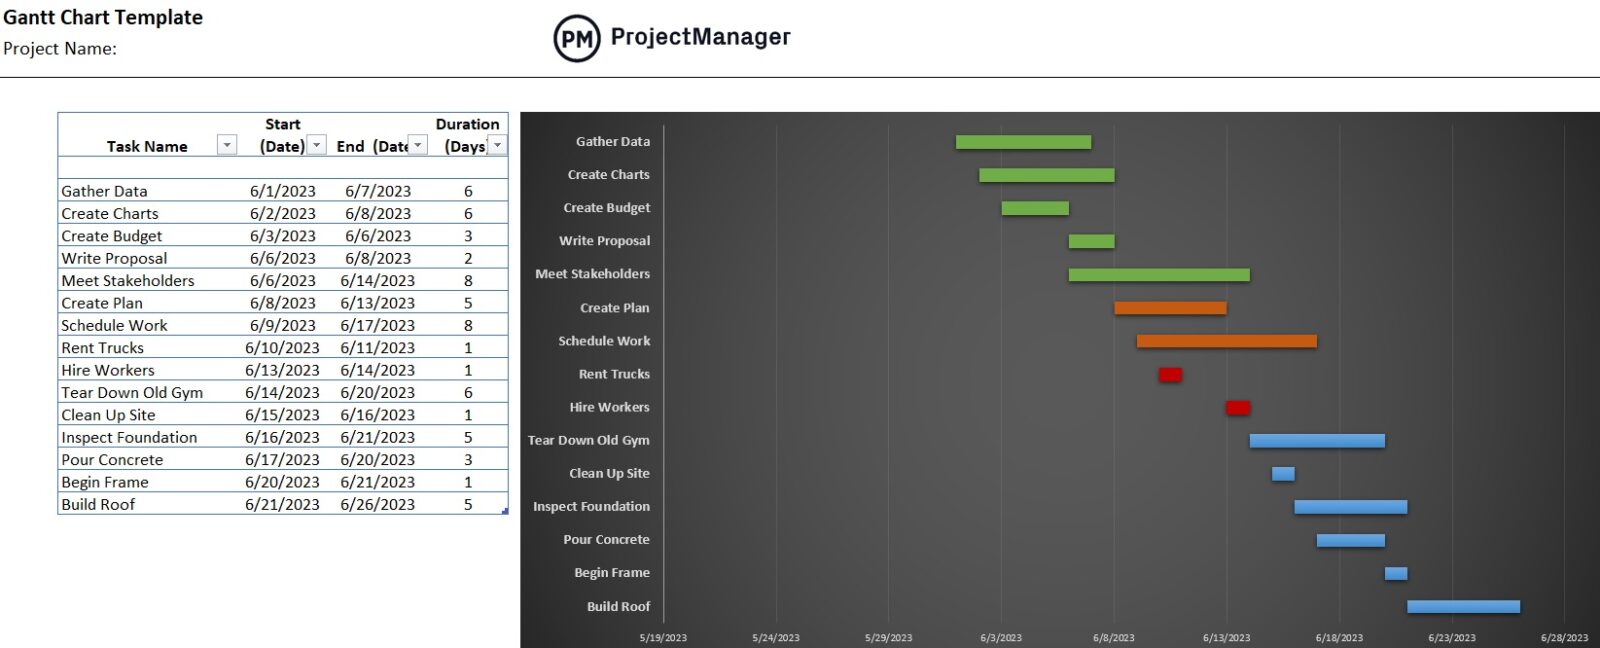
Excel Gantt Chart
This free Gantt chart Excel template helps you build a Gantt chart and a project timeline in minutes. It gives you a visual overview of your entire project from start to finish.
Simply add all of the tasks needed to reach your final deliverable and manually update any changes during the execution of the project. It’s a great example of a Gantt chart in Microsoft Excel.
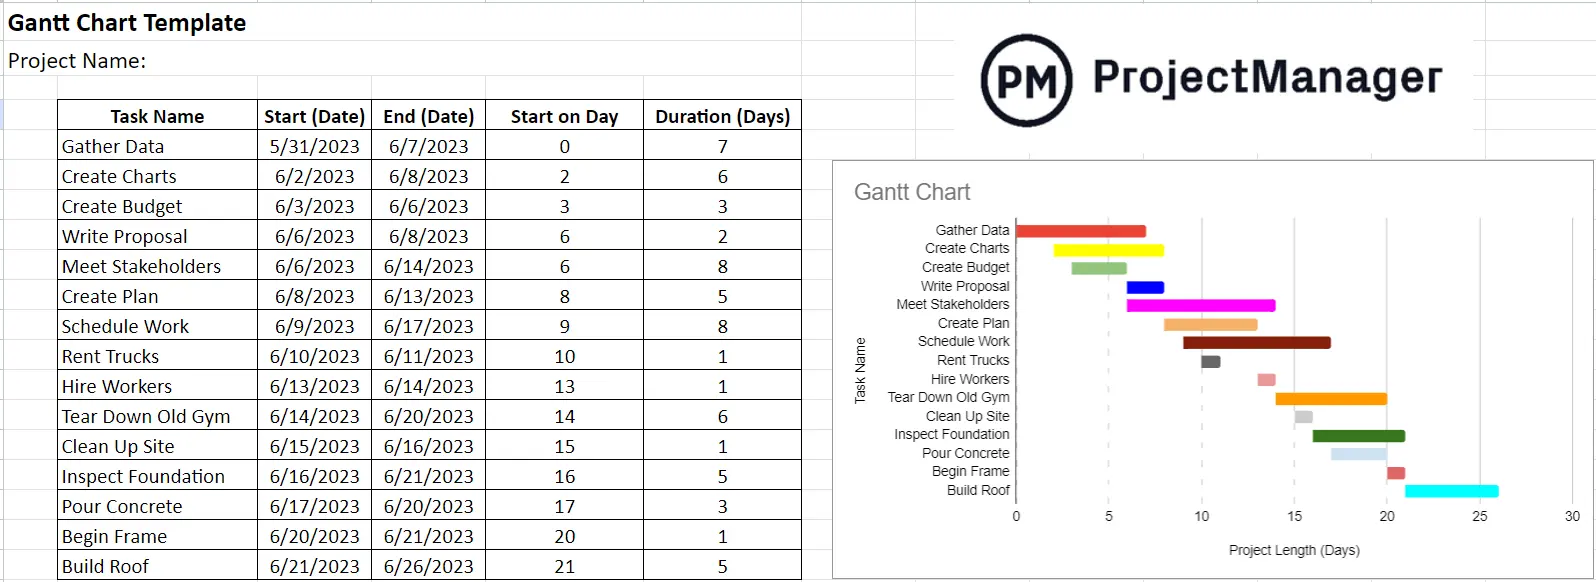
Gantt Chart for Google Sheets
This free Gantt chart template for Google Sheets is similar to an Excel Gantt chart, but it can be accessed by your team members online, instead of having to download a file and store it in their computers. This also means you can collaborate with your team online so any file changes can be seen by anyone with access to it.
Gantt Chart for PowerPoint
This free Gantt chart template for PowerPoint allows you to create a simple Gantt chart based on your project task names, duration and due dates. You can attach them to any PowerPoint presentation, which helps communicate the progress of your project in a visual format that can be easily understood by most people.
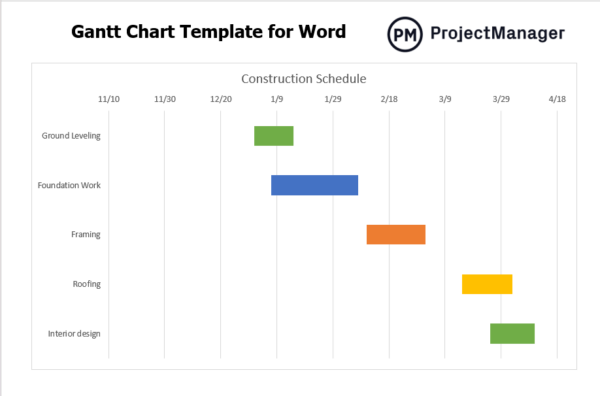
Gantt Chart for Word
While Microsoft Word might not be the first software you think of when looking for a tool to make a Gantt chart, it can be used to make Gantt charts. In fact, this free Gantt chart template for Word is as good as the Excel or PowerPoint Gantt chart. The key difference is that this Gantt chart template for Word is designed for adding a Gantt chart to project documents.
However, these free Gantt chart templates are best suited for creating simple Gantt charts, as they lack advanced project management features that are needed for larger projects such as resource management and cost tracking.
What Is Gantt Chart Software?
Once computers introduced new ways of working, project managers found they could save time in creating and updating their Gantt charts. Gantt chart software, also called project planning, project management, or even project scheduling software, was created to automate the process to support more advanced Gantt requirements like creating task dependencies, adding milestones or identifying the critical path of a project plan.
Watch the video below for a quick introduction to ProjectManager’s online Gantt chart maker and its benefits.
Many project managers traditionally used local desktop programs like Microsoft Project—and many still do. But today, most Gantt chart makers and project management software have moved online, enabling anyone to create shareable and collaborative Gantt charts and project plans.
Must-Have Gantt Chart Software Features
While no two Gantt chart tools are the same, there are key features that you'll need to get the most out of your Gantt chart tool:
Milestones
Milestones are represented by a diamond symbol on the Gantt diagram and have no duration. A milestone marks the end of a piece of work, task sequence or project management phase. They’re often fixed dates or important dates on your project schedule that you need to be aware of. Read more: Learn how to use milestones in your scheduling.
Task Dependencies
These show which tasks are linked together. Links are shown with lines on the Gantt chart, and the arrow points to the task that comes next. Task dependencies can be set up as start-to-finish, start-to-start, finish-to-finish or finish-to-start. Read more: Learn how to manage task dependencies.
Summary Tasks
A summary task is a skinny ‘umbrella’ task above various individual tasks. It’s a good way of using a Gantt diagram to group activities together, especially as part of a project stage or phase. You can ‘roll up’ your tasks (in other words, hide them from view) so that only the summary task is shown. The summary task also displays the task progress with shading, so you can view the progress of all tasks underneath in that one bar.
Collaboration
A Gantt chart without collaboration is just a static plan. It’s nice to have, but it isn’t helping you advance the work your team is doing. Be sure that you can chat or comment around tasks to keep the workflow documented. Your team will then get alerts every time a task has been updated, so they know when new activity has occurred.
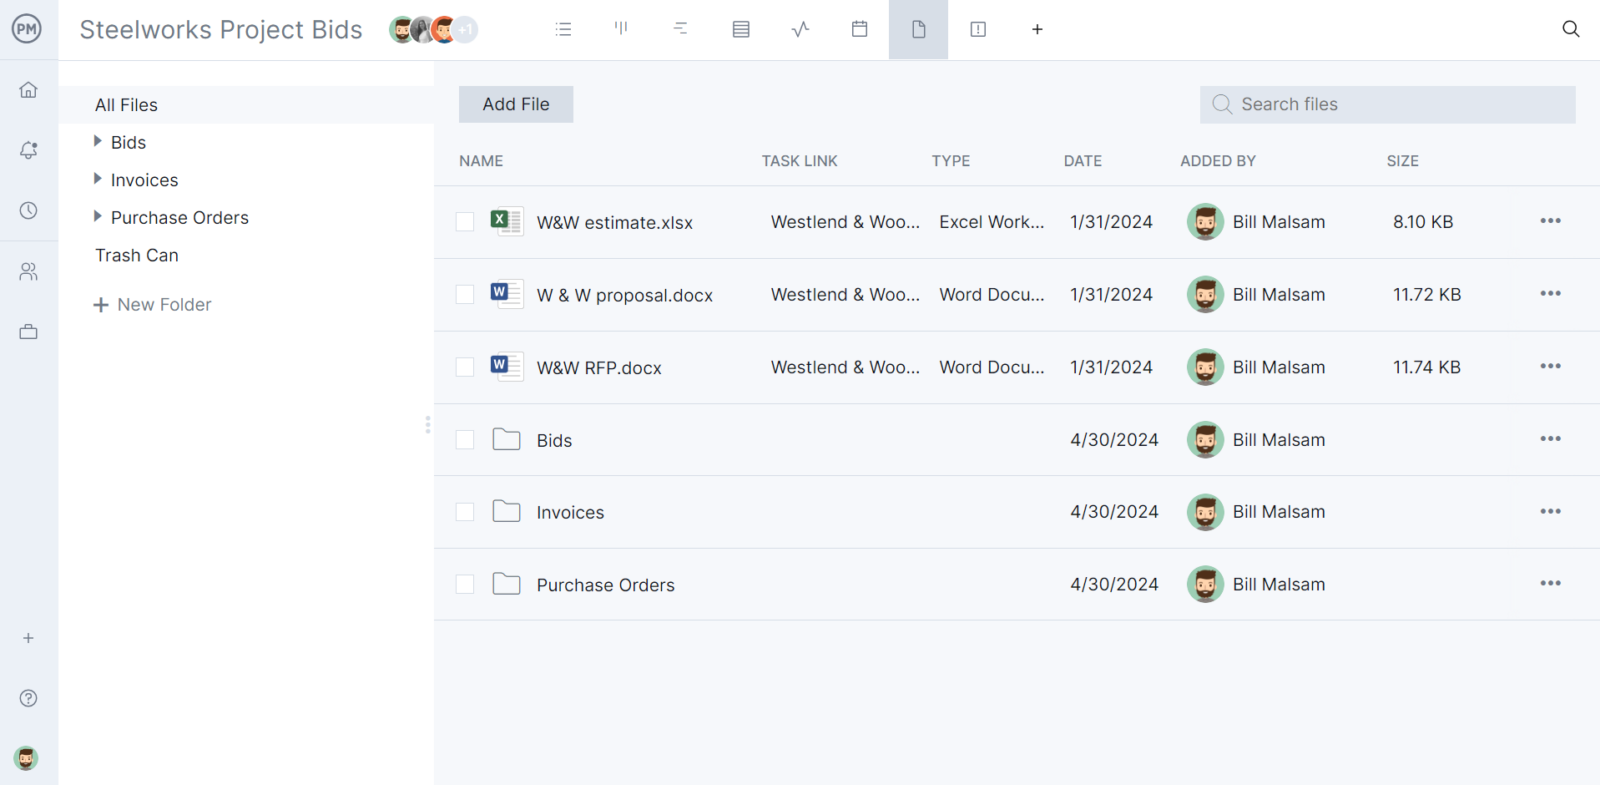
File Sharing
It’s important as you collaborate to also be able to attach files, images, videos or other notes to document the task progress and keep all the task information together. That way, you always know where to look to find the files related to the tasks you’re scheduling on your Gantt diagram.
Planned vs. Actual Progress
This is represented in a couple different ways on the Gantt diagram. Shading on the bar indicates how complete the planned work is. When the bar is shaded, the task is finished. You can also see just a view of the actual progress anytime in the settings. Don’t forget to set a baseline for the best tracking experience.
How to Make a Gantt Chart Online With Gantt Chart Software
Onboarding your team members with ProjectManager’s Gantt chart maker allows you to better plan, schedule and track all types of projects. Once you’ve invited your team members to the new Gantt chart tool, you can start improving the way you manage tasks, resources and timelines. But before we get to the benefits of using online Gantt chart software, let’s go through a step-by-step guide to making a Gantt chart in ProjectManager.
It’s easy for anyone to create a Gantt chart online in ProjectManager. You can import a task list from a CSV file, an Excel Gantt chart template, or a Microsoft Project file or create one from scratch. Unlike Gantt chart Excel templates, our Gantt chart maker does the heavy lifting so you can focus on what’s important.
Simply add project tasks to the tool, fill in the information and a fully-fledged Gantt chart will generate automatically. Our Gantt chart has advanced project management features that’ll let you set task dependencies, identify the critical path and use timesheets for resource tracking, just to name a few.
Also, since it’s an online Gantt chart maker, you and your team members can build the Gantt chart together in real time while you share files and documents with unlimited storage.
Now, without further ado, here’s a step-by-step guide to creating a Gantt chart with ProjectManager, one of the best Gantt chart software available in the market.
1. Create a New Project
When you first log in, you simply enter a project name and select “Create.” You’ll be directed to the Gantt chart view.
2. Add Project Tasks to Your Gantt Chart
As you add tasks, the default date will be today. Since you haven’t added a longer due date than today, the tasks appear in the Gantt chart tool to the right as circles, representing that they start and end today. The dotted line represents today’s date.
3. Assign Tasks to Team Members
You can easily assign or re-assign tasks to team members based on their availability in real time, which is ideal for workload management. When people are assigned tasks, their name appears above the taskbar on the Gantt chart. The Gantt chart maker lets you know whether your team members are available, or if they’re already scheduled for other tasks.

4. Add Due Dates to Your Gantt Chart
As you extend the start and end dates, the task bars on the Gantt chart view extend too, showing you how long each task will take. Add those dates under the planned start and planned finish columns.
5. Prioritize Your Project Tasks
The Gantt chart maker has a task prioritization feature that allows you to establish a priority level for each task so you and your team can focus your efforts on the most important activities. Best of all, this priority tag can also be used in other project views, like task lists and kanban boards for better task tracking.
6. Estimate Task Costs
Add the estimated costs for each task. Our Gantt chart maker helps you estimate labor costs for each project task based on how many team members are working on it and their hourly rate. On top of that, these labor costs are also updated on timesheets you can easily share with your team members.
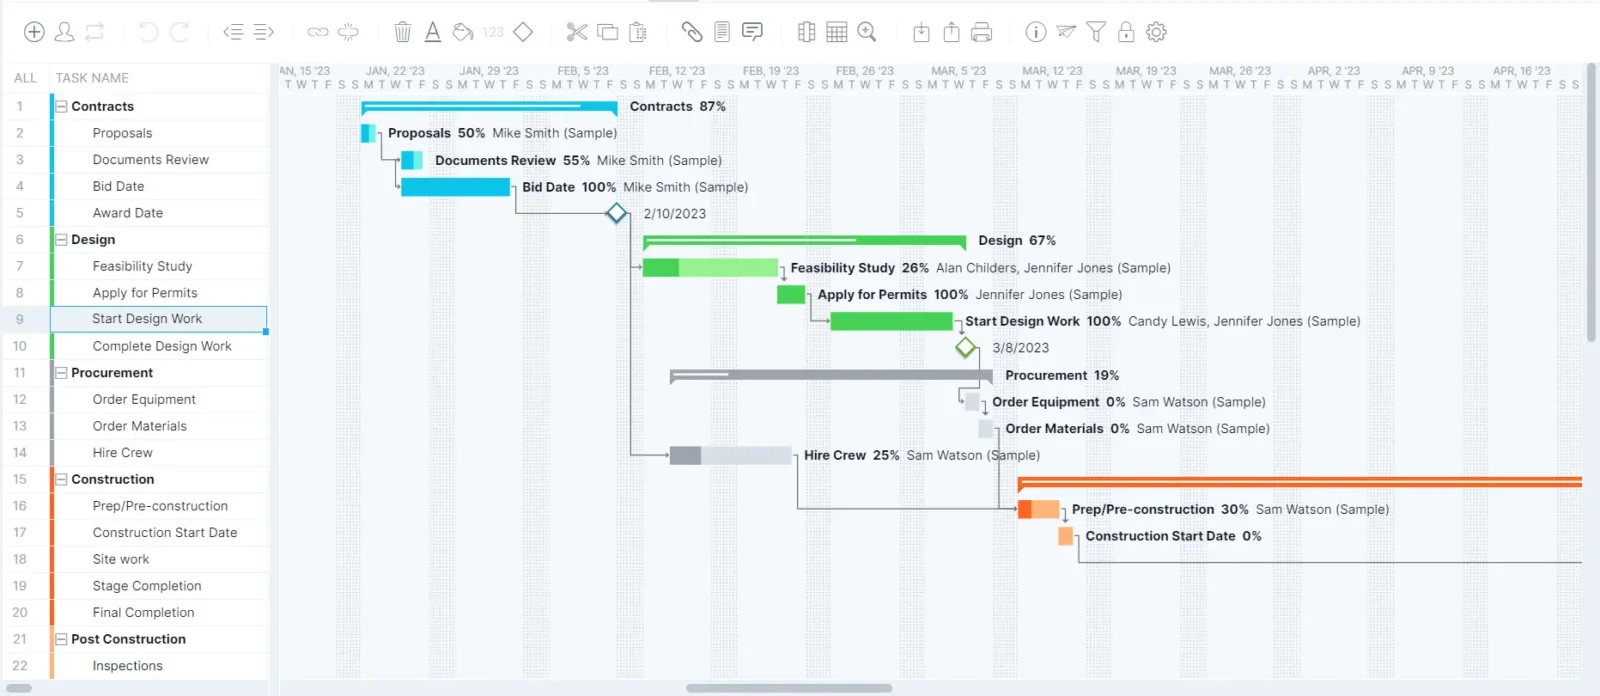
7. Link Task Dependencies Using the Gantt Chart Timeline
Linking task dependencies is an advanced project planning feature that lets you create a realistic project schedule. There are four types of task dependencies that allow you to understand how your projects’ task sequences are interrelated. In the picture below, you can see how Gantt chart bars are connected by arrows, which indicates there’s a dependency between tasks.
8. Identify Critical Path Activities & Project Milestones
The Gantt chart maker automatically identifies the critical path of your project, which helps you focus on the critical tasks or the tasks that must be completed on time so that your project is completed on time. In addition, you can mark any project task as a milestone, which lets you pinpoint an important achievement, deliverable or the end of a project stage for detailed project tracking.
9. Customize Your Gantt Chart
You can customize your Gantt charts in whatever way suits your team. Here, you can see that different people are represented by different colors on the Gantt taskbars so it’s easy to see at a glance who is responsible for which tasks. Others might use colors on the stacked bar chart to represent different phases of a project or different teams responsible for a group of tasks.
10. Attach Files, Comments or Notes
When your team works collaboratively on an online Gantt chart maker, you can do so much more than just plan tasks. You can add images, videos, links, notes or comments right at the task level, so all the relevant task work is captured and easily accessible in one place.
11. Track Your Team’s Progress
All the updates on the Gantt diagram can be seen in one view. You can see what the team is working on and when tasks have been updated. Team collaboration is easy with online Gantt charts.
Gantt Chart FAQs
If you still have questions about Gantt charts, they should be answered in the following frequently asked questions.
Can You Make a Gantt Chart in Excel?
Microsoft Excel doesn’t have a Gantt chart feature but you can create one by customizing the stacked bar chart or using one of the free Gantt chart templates available online.
We’ve created a how-to guide with detailed instructions on how to make a Gantt chart in Excel from scratch. Learning to do so allows you to better understand how an Excel Gantt chart works as well as its key features and limitations.
Can You Make a Gantt Chart In Word?
Making a Gantt chart in Word can be very useful as most project teams use Word for creating their project documents. You can create a Gantt chart in Word by inserting a stacked bar chart into a document, adding your project schedule information (such as start, end dates and duration) and customizing the Gantt diagram for greater readability.
Then, once you’ve created your Gantt diagram in Word, you can copy and paste it into any project document you’d like such as a project plan or project proposal.
Can You Make a Gantt Chart in PowerPoint?
Like Word or Excel, PowerPoint allows you to insert stacked bar charts which can be transformed into a Gantt chart. We’ve created a how-to guide with detailed instructions you can follow along if you’d like to make a Gantt chart in PowerPoint.
The best part is that once you create a PowerPoint Gantt chart, you can use it for all your project presentations. Simply copy and paste the PowerPoint Gantt chart into a new presentation and edit its data.
Can You Make a Gantt Chart in Microsoft Project?
Yes, Microsoft Project is project management software equipped with a Gantt chart tool. Some of the key features of Microsoft Project’s Gantt chart are its cost and resource monitoring, critical path analysis, task dependency mapping and milestone tracking.
If you’d like to try Microsoft Project’s Gantt diagram, but need help to get started with this tool, check out our blog on how to make a Gantt chart in Microsoft Project. This blog also goes over the key features, pros and cons of a Microsoft Project Gantt chart.
Can You Make a Gantt Chart in Google Sheets?
To make a Gantt chart in Google Sheets, open a new blank spreadsheet, add the tasks data for your project (including duration, start and end dates), insert a stacked bar graph and then transform the bar graph into a Gantt chart. There are Gantt chart templates for Google Sheets too.
We also have a blog that explains how to make a Gantt chart in Google Sheets, with easy-to-understand steps and images, which makes it ideal for sharing with your team members.
What Does Gantt Stand For?
The Gantt chart was named after Henry Gantt, and many think he was the one who first had the idea of project planning on bar charts. This isn’t entirely true.
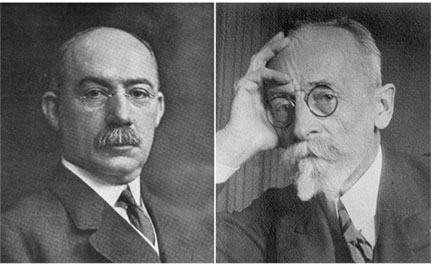
Left: Henry Gantt | Right: Karol Adamiecki
Karol Adamiecki devised the first Gantt diagram back in 1896. He was a Polish engineer turned management professor who came up with the idea of displaying processes visually so that he could make it easier to see production schedules. (He did most of his work in the steel industry.) He called it the harmonogram (a much better word) but Adamiecki published his articles on it in Polish and Russian, so the English-speaking world didn’t know much about it.
Henry Gantt had the same idea as Karol Adamiecki, but about 15 years later. In 1910, Gantt started planning visually with bar charts to allow supervisors in the steelworks to see if production was on track or behind schedule. It was Gantt’s name that got attached to this way of project planning, but today it’s generally recognized that Adamiecki had the idea first.
Gantt Chart Resources
Software
Templates
Articles
- Best Gantt Chart Software: Paid & Free Options Ranked
- How to Make a Gantt Chart In Excel
- Gantt Chart Task Dependencies
- Easy Ways to Make a Gantt Chart with Google Sheets
- How to Make a Gantt Chart on Mac
- How to Make a Gantt Chart In PowerPoint
- How to Make a Project Schedule
- How to Make a Project Plan
- The Ultimate Guide to the Critical Path Method
- The Ultimate Guide to Work Breakdown Structure (WBS)
- Printable Gantt Chart by ProjectManager
- Guía Para el Uso del Diagrama de Gantt en la Gestión de Proyectos
- Gantt-Diagramm: Leitfaden für effektives Projektmanagement
- Gráfico de Gantt: o guia completo
Start your free 30-day trial
Deliver faster, collaborate better, innovate more effectively — without the high prices and months-long implementation and extensive training required by other products.
Start free trial