Use this free PERT chart template for Excel to improve the planning phase of project management. A PERT chart template is a great tool to help build a schedule and track progress to ensure all activities are completed by the deadline.
What Is a PERT Chart?
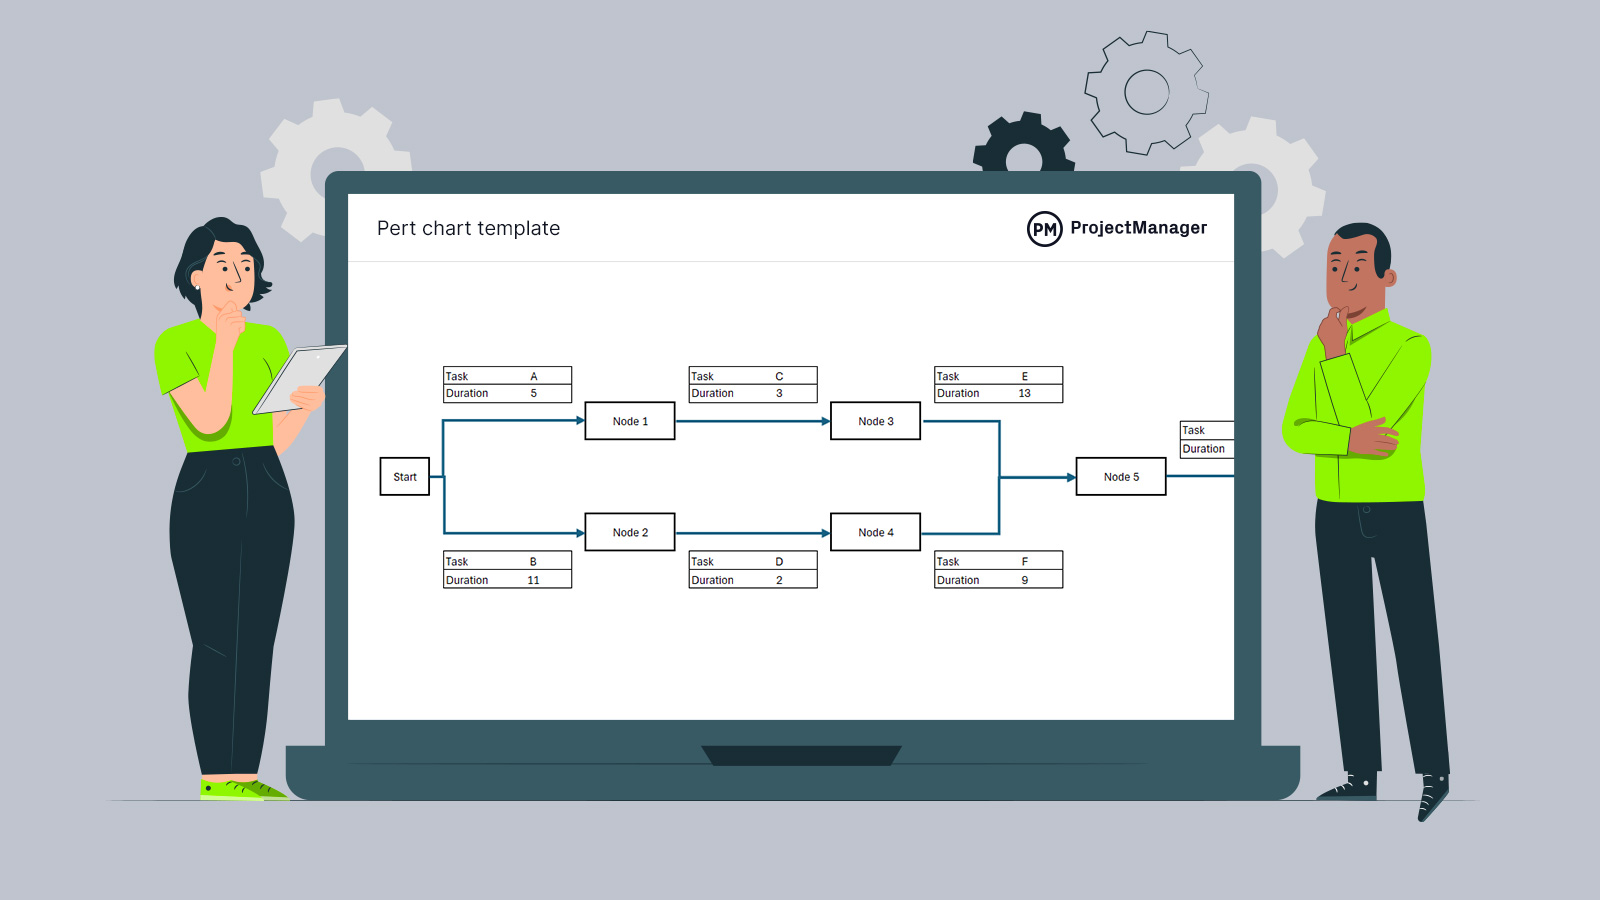
A PERT chart is used in project management to schedule, organize and coordinate project tasks. Often referred to as a PERT diagram, the word PERT is an acronym for program evaluation review technique. Project managers use this tool to visually represent the project timeline.
The PERT chart template can be used to break down each task so the project manager can analyze them. It does this by using nodes, which are represented by rectangles or circles and the events and milestones that occur throughout the project. Vectors connect the nodes are, which are lines that stand for the various tasks that must be executed.
The U.S. Navy first developed this methodology for scheduling in the 1950s. It was used to manage the Polaris submarine missile program. Around the same time, a method similar to the PERT chart called the critical path method (CPM) was developed in the private sector. PERT charts are used for more flexible timelines that have more uncertainty, while CPM is used for projects with a fixed timeline.
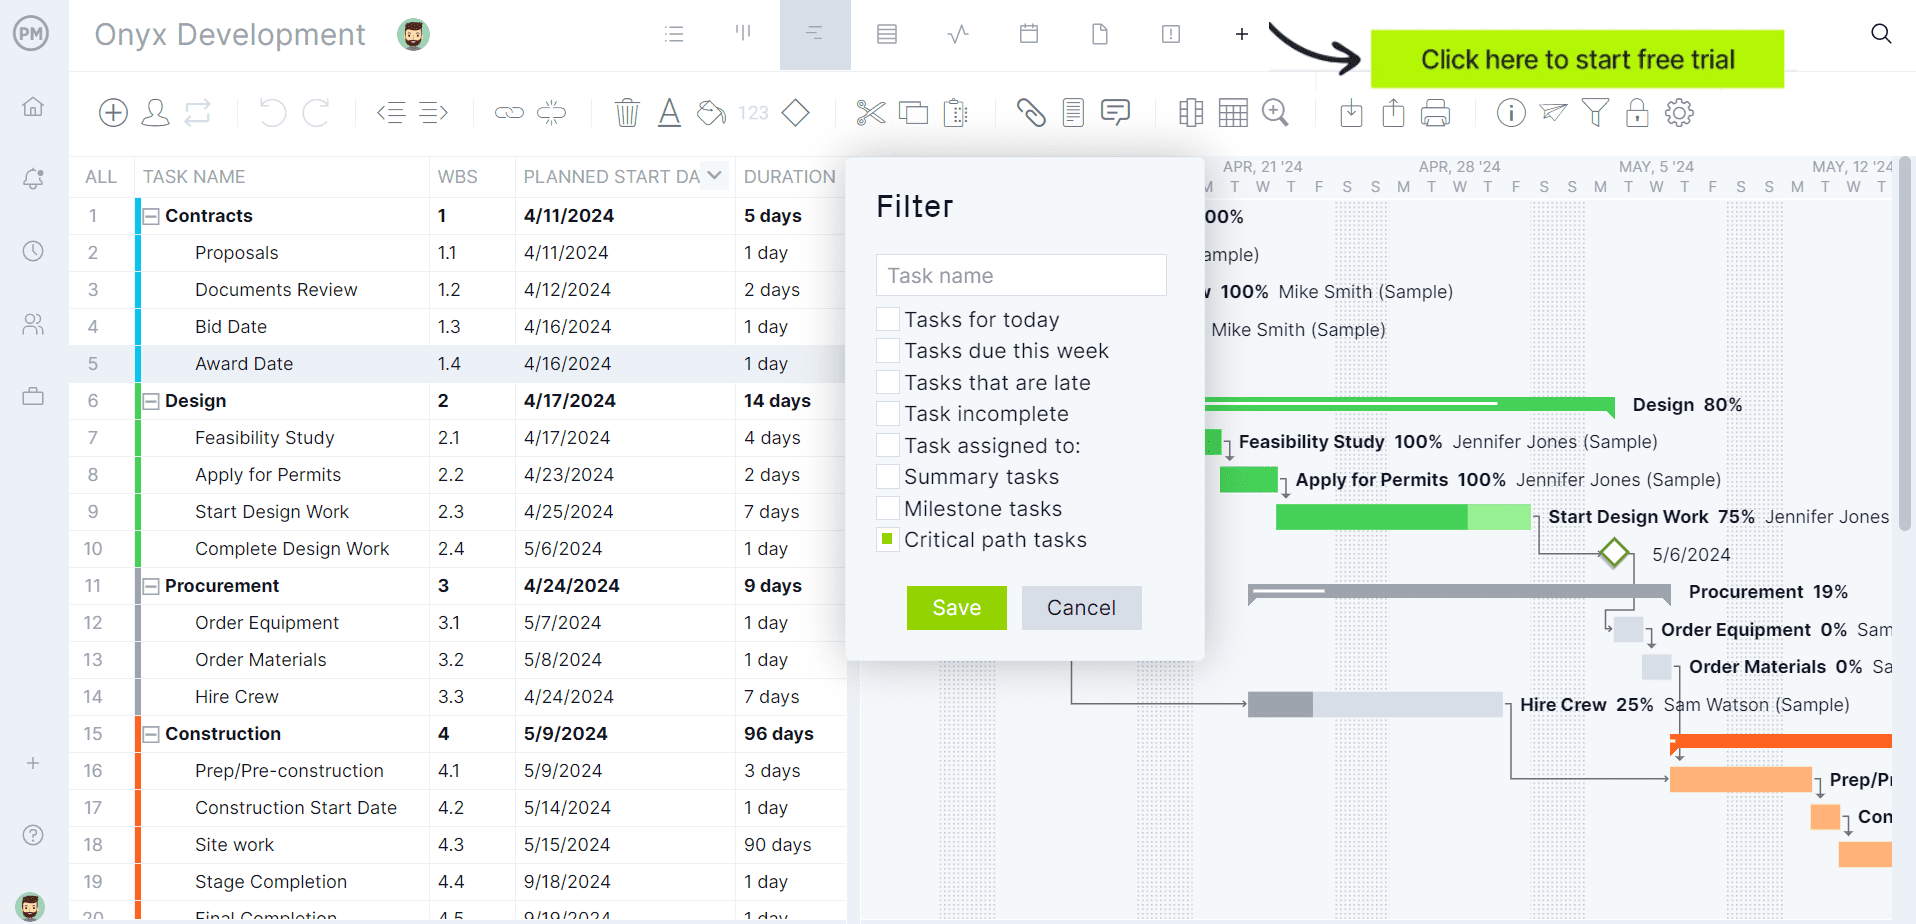
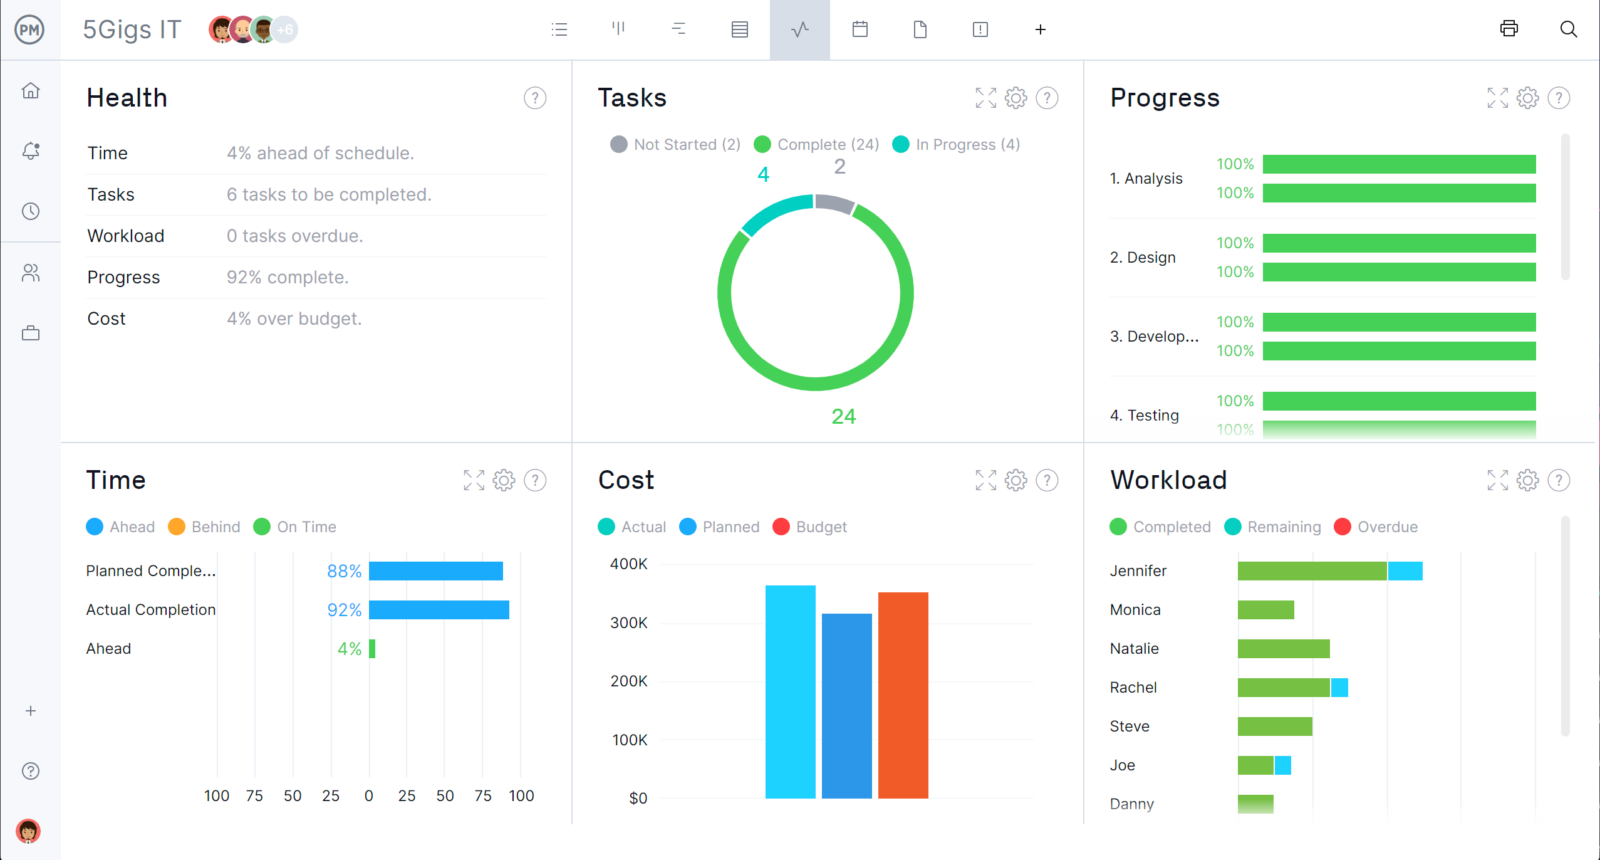
While the PERT chart template is a great tool for planning a project schedule, it becomes far more powerful when used with project management software. ProjectManager is award-winning project and portfolio management software with robust Gantt charts that represent the project as a timeline and offers more than a PERT chart template can. For example, there’s no need for complicated CPM calculations on the Gantt chart. It filters the critical path instantly. Users can also link all four types of task dependencies and set a baseline to track planned vs. actual progress in real time. Get started with ProjectManager today for free.
Why Use a PERT Chart Template?
Project managers use a PERT chart to estimate the minimum time needed to complete a project. By analyzing the work breakdown, task connections and the risks associated with the project, they can organize even complex projects by visualizing the dependencies between each step.
Using a PERT chart template simplifies the process by having the diagram already made so that users can fill in the spaces and follow the simple instructions to create the PERT chart. This creates continuity as project managers use the PERT chart template during and after the project, archiving the documentation of completed projects for future reference.
Project managers also use a PERT chart template to illustrate dependent tasks, make a project timeline and calculate the critical path. They’re great for organizing and managing projects that are large or complex. A PERT chart template simplifies the project management process and increases efficiency.
When to Use This PERT Chart Template
As noted, the PERT chart template is an essential tool for the planning stage of a project. It helps determine a project’s critical path so that all deadlines are met. It also helps to identify interdependencies of tasks and the knowledge of this helps avoid costly delays.
In fact, the PERT chart template can be employed before project planning. It’s a useful tool when determining if a project is viable during the initiation phase. That’s because it helps estimate the time needed to complete the project, which is valuable information as to whether the project is worth pursuing.
The PERT chart template is also valuable when preparing for a more complex and larger project. It can organize all the tasks and make something that feels unmanageable into a controlled and successful project. They can also help to explore what-if scenarios so that the right workflows can be chosen. Finally, project managers can use a PERT chart template when they want to clearly communicate the strategic position of the project to the project team.
Who Should Use This PERT Chart Template?
It should be clear by now that a PERT chart template is a tool project managers use for scheduling purposes. However, anyone responsible for planning a project will find a PERT chart template a powerful tool and method they’ll want to employ.
What Does This PERT Chart Template for Excel Include?
This PERT chart template allows you to estimate the duration of tasks to make an accurate project schedule. But before you do so, here are some important definitions you should be familiar with before starting.
PERT Chart Formula
A traditional PERT chart relies on the weighted average of three numbers that are based on the most pessimistic (P), the most optimistic (O) and the most likey (M) estimates for the project’s length.
- Optimistic Time (O): The least amount of time to accomplish a task or activity
- Pessimistic Time (P): The maximum amount of time to complete a task or activity. This is the worst-case scenario, assuming that anything that can go wrong does
- Most Likely Time (M): The most realistic time estimate for the task or activity, assuming no issues occur
- Expected Time (E): The time you’ll obtain after using the PERT chart formula, which weighs the optimistic, pessimistic and most likely times to find the most accurate time estimate. Based on these values, the PERT chart formula is:
E=(O + (4*M) + P) / 6
PERT Chart Standard Deviation
Use the formula below to find the PERT chart standard deviation. The larger your results, the less confidence you have in your estimate, and vice versa.
(P-O) / 6
Now that you understand what these important PERT concepts mean, let’s look at the elements that make up the PERT chart.
- Nodes: These are the symbols used to visualize project milestones, which are the outcomes of each task
- Arrows: Visual representation of the sequence of a task, diverging arrows indicate tasks that can be completed simultaneously
- Predecessor: An activity that precedes another and must finish before its successor can start
- Lead Time: How much time you should complete a task or activity without impacting the following
How to Use ProjectManager’s PERT Chart Template for Excel
Now that the nomenclature for a PERT chart is clear, it’s time to learn how to use this free PERT chart template for Excel. The formulas are embedded. All one needs to do is add their project information and follow these three steps.
1. List Tasks and Their Time Estimates
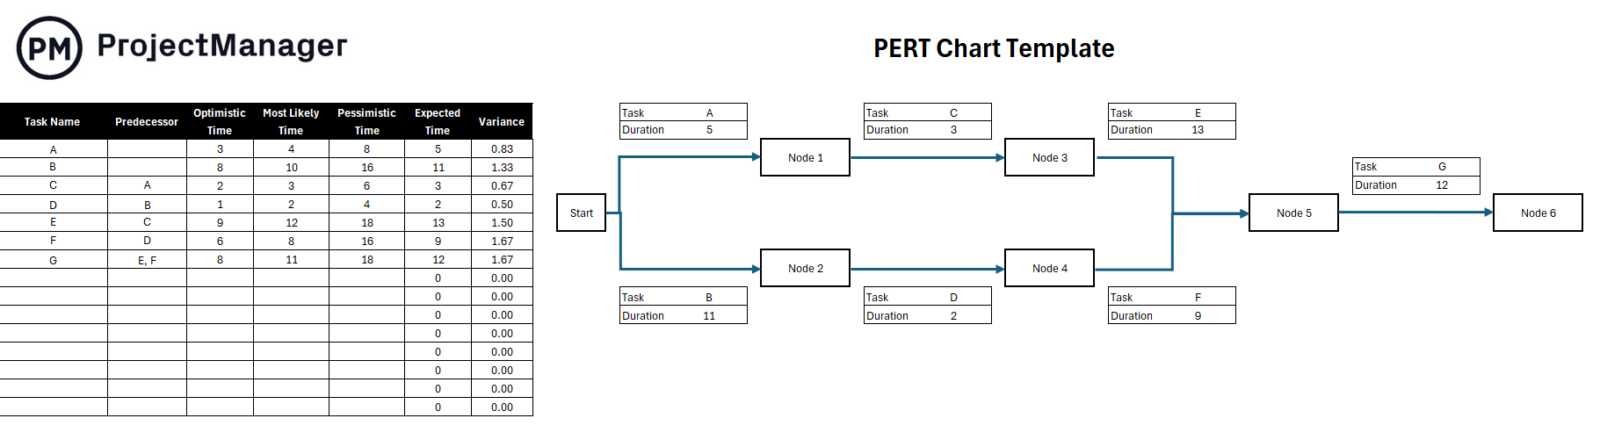
List the project tasks using the PERT chart table at the left side and then make an optimistic, pessimistic and a most likely time estimate for their completion. Once these three estimates have been entered in their corresponding columns, this template will automatically apply the PERT chart formula and fill the “Expected Time” and “Variance” columns.
2. Use Arrows and Nodes to Map Tasks and Milestones
A PERT chart uses arrows to represent tasks and show dependencies among them. Edit the task names and their duration on the PERT chart to show the project tasks you listed in step one as shown by the sample data in this PERT chart template for Excel. Copy and paste the sample PERT chart nodes and arrows to create a diagram that reflects your project workflows.
Then edit the project milestone names using the PERT chart nodes as shown in the sample PERT chart.
3. Identify Preceding Tasks
Now that the project tasks have been mapped using the PERT chart. It’s easy to visualize them more clearly, which facilitates filling out the “Preceding Tasks” column.
ProjectManager Helps Manage Project Schedules
While a PERT chart template is a valuable tool for scheduling a project, it won’t help implement or control that schedule as it’s executed. Templates are static documents. While the PERT chart template can help schedule a project, project management software is designed to manage it. ProjectManager is award-winning project and portfolio management software that has the features project managers and their teams want to do their work more efficiently and effectively.
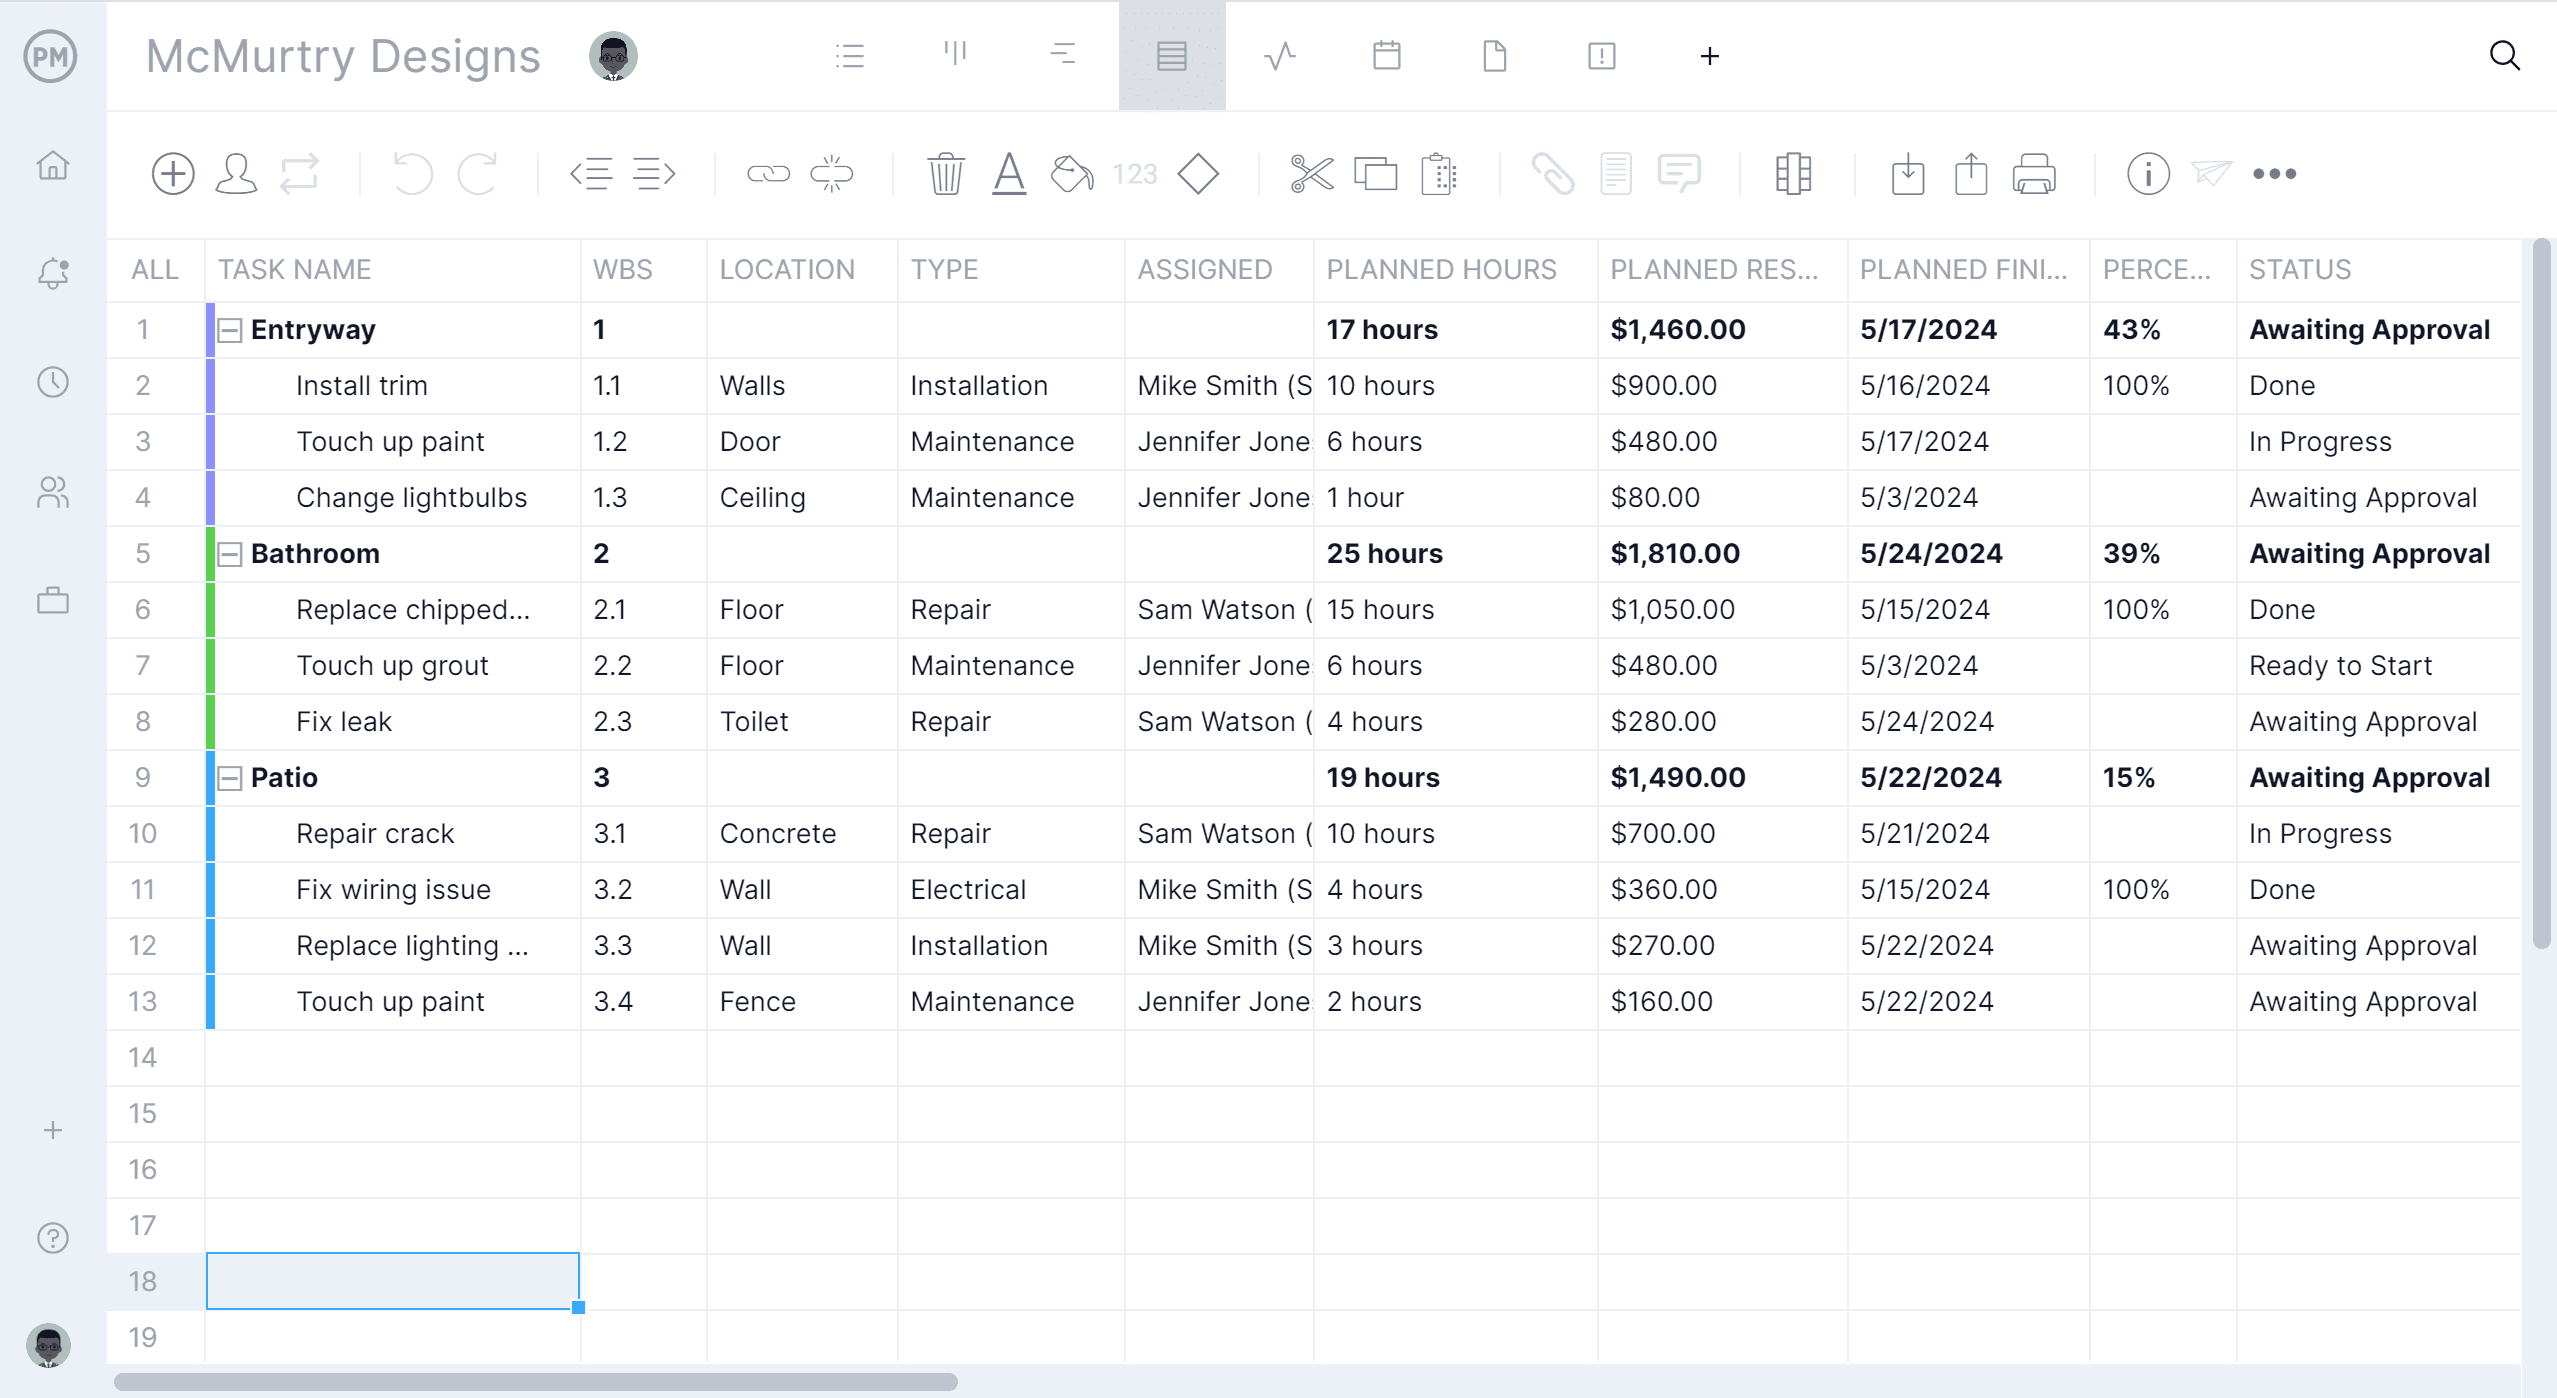
Use Multiple Project Scheduling Views
Gantt charts work with the PERT chart template to organize tasks, identify task dependencies and set baselines to track scheduling and budget variance in real time. Project managers use them to plan, manage and track projects, but teams don’t need all those bells and whistles when executing their tasks. That’s why multiple project views all update simultaneously to keep everyone working on the same pages. Teams can visualize workflow with kanban boards or manage tasks with the list view. There’s a sheet view, which is the Gantt without a timeline, and a monthly calendar overview that helps stakeholders stay updated.
Manage Resources and Track Costs
To stay on schedule requires monitoring and controlling the project as it’s being executed. Project managers can get a high-level view of time, cost and more with real-time project and portfolio dashboards or use customizable reports for a closer look at the data. Labor costs can be monitored with secure timesheets that do more than streamline payroll, they also provide visibility into how much time and money each team member spends on their tasks. The team page or color-coded workload chart allows project managers to see the whole team’s allocation and balance their workload to keep them working at capacity and productive.
More Free Project Scheduling Templates
For those who aren’t ready to upgrade and still want to schedule projects with templates, here are a few more free project management templates that can help deliver projects on time.
Gantt Chart Template
While not as feature-rich as Gantt chart software, this free Gantt chart template for Excel can organize tasks, list their start and end dates and duration on the spreadsheet’s left side of the template. Then, the right side of the timeline automatically populates with a bar chart showing the whole project in one place.
Project Calendar Template
Another way to schedule tasks is using the familiar grid of a calendar, which shows the project over the course of a month’s time. This free project calendar template for Excel allows users to plot their tasks over days with colored bars to indicate which project phase it’s a part of.
Resource Plan Template
Use this free resource plan template to ensure that projects have the resources they need when they need them. Identify, list and organize resources and determine the quantity and costs required. Then schedule resources across a weekly calendar over a month or customize the template to add more time as needed.
Related PERT Chart Content
There’s more to PERT than a PERT chart template. For those interested in going deeper, the following links to some articles on planning software, an ultimate guide to PERT charts and comparing PERT charts to Gantt charts and network diagrams.
- 12 Best Project Management Charts for Project Planning
- PERT Chart: The Ultimate Guide (with Examples)
- PERT and CPM: Their Differences and How to Use Them
- Gantt Chart vs. PERT Chart vs. Network Diagram
- Plantilla de Diagrama de PERT para Excel (Descarga Gratis)
- Modèle de diagramme PERT pour Excel
- PERT-Diagramm-Vorlage für Excel
ProjectManager is online project and portfolio management software that connects teams whether they’re in the office, out in the field or anywhere else. They can share files, comment at the task level and stay updated with email and in-app notifications. Join teams at Avis, Nestle and Siemens who use our software to deliver successful projects. Get started with ProjectManager today for free.