Complex projects still demand clarity when plans leave the screen and enter meetings, reviews or job sites. A printable Gantt chart gives teams a clean, visual timeline they can share, mark up and discuss. ProjectManager delivers a professional version designed for real-world collaboration and decision-making across industries and organizational contexts.
When to Use a Printable Gantt Chart
Organizations rely on printable Gantt charts when stakeholders need offline visibility, approvals require hard copies, schedules must be shared in boardrooms, training sessions or client reviews and regulated environments demand documented timelines that remain accessible to reference without software access.
Why Use ProjectManager’s Printable Gantt Chart?
ProjectManager stands out because its Gantt chart is built into a complete project management platform rather than isolated software. Users can plan tasks, assign resources, track costs, manage dependencies and adjust schedules in real time. When those plans need to be shared offline, the platform makes it easy to print clear, professional Gantt charts that reflect live project data without manual rework while supporting complex portfolios, cross-functional teams and evolving timelines across organizations of varying size and operational maturity levels.
While the printable Gantt chart template we include in this blog is great, it doesn’t have all the features that come with online Gantt chart software. If you want a Gantt chart that updates in real time and is still printable, sign up for ProjectManager. It’s easy to create a Gantt chart in seconds where you can plan, schedule and assign work. Track tasks, slippage, costs, time and workload in one place. Then, print the software’s online Gantt chart to share it with stakeholders. Get started by taking a free 30-day trial.
ProjectManager’s Printable Gantt Chart Features
Behind printed schedules is a set of features that preserve accuracy and structure. ProjectManager’s printable Gantt chart includes visual controls and planning elements that translate complex project data into a format teams can understand, review and manage beyond the screen. With our software’s Gantt chart, here’s what you can expect.
Four Types of Task Dependencies
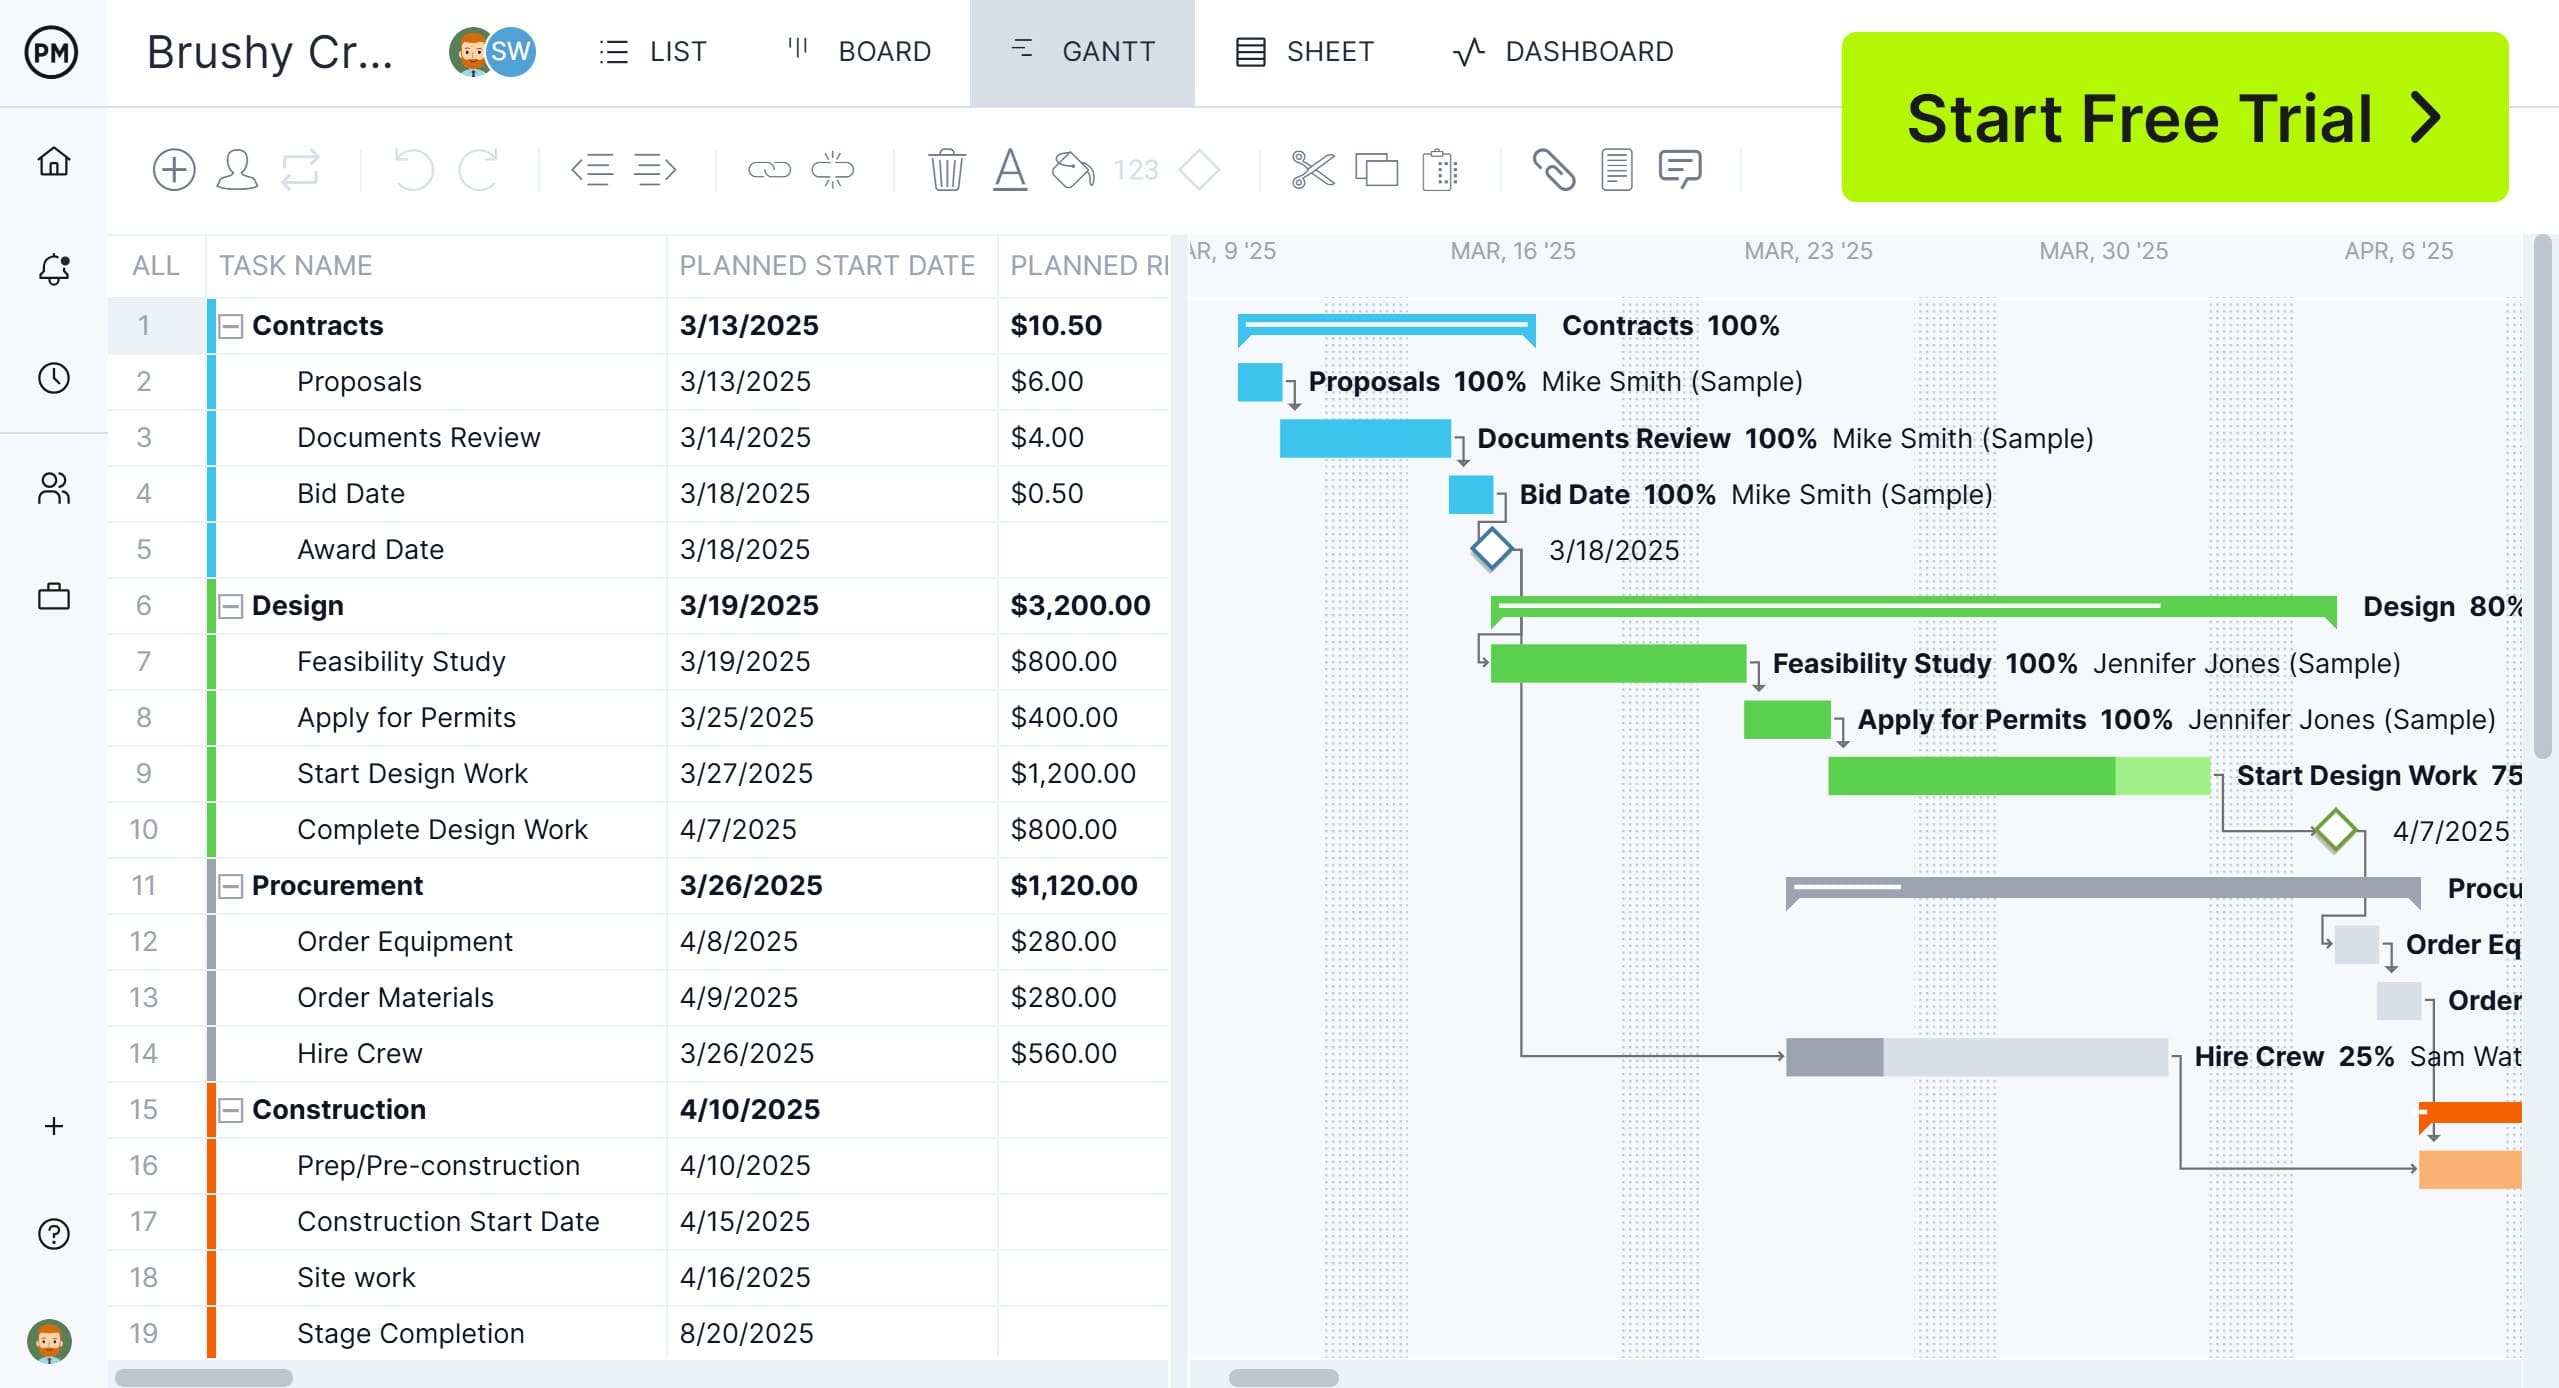
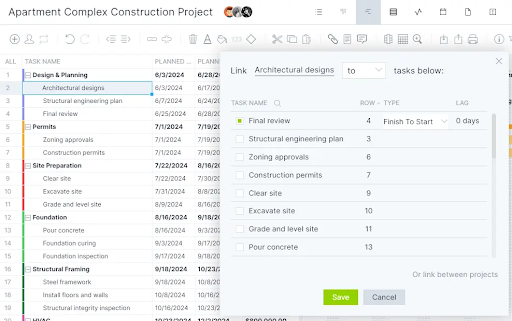
Scheduling logic matters when tasks interact. ProjectManager’s Gantt chart identifies all four dependency types—finish-to-start, start-to-start, finish-to-finish and start-to-finish—so teams understand how work flows. Visual links reveal sequencing constraints, prevent conflicts and help managers forecast schedule impacts when timelines shift or tasks change during execution across complex, multi-phase projects involving parallel activities and interdependent deliverables at scale over time.
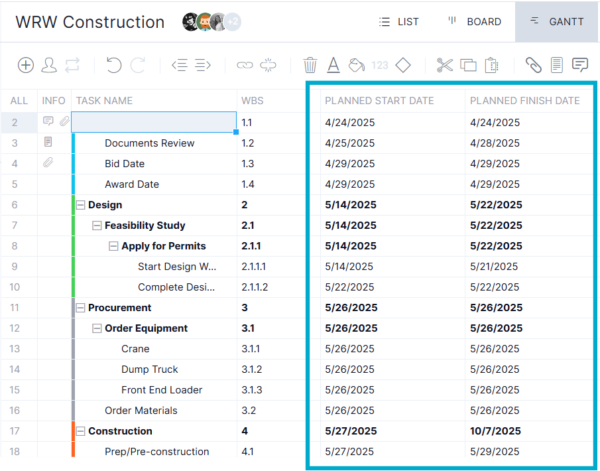
Work Breakdown Structure
Structure keeps large schedules readable. ProjectManager’s Gantt chart displays a dedicated WBS column that organizes work hierarchically. Users can define project phases, group parent tasks and break work into subtasks. This structure clarifies scope, supports planning accuracy and allows teams to collapse or expand task levels while reviewing printed schedules for stakeholders and auditors across formal project reviews and approvals.

Project Milestones
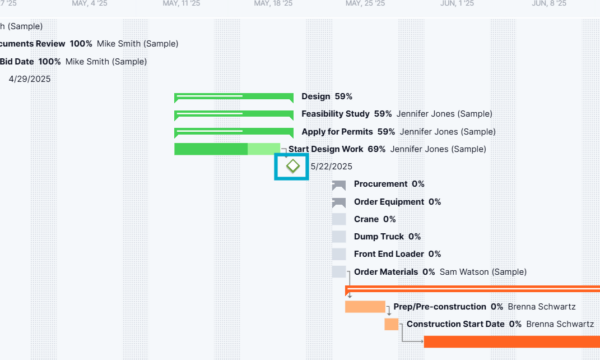
Key moments deserve instant visibility. ProjectManager’s Gantt chart uses a modern interface that highlights project milestones directly on the timeline. Diamond icons visually separate milestones from tasks, making them easy to spot at a glance. This clarity helps teams track critical achievements, communicate progress and maintain focus during planning sessions and printed status reviews across complex organizational initiatives and portfolios.
Get your free
Printable Gantt Chart
Use this free Printable Gantt Chart for Excel to manage your projects better.
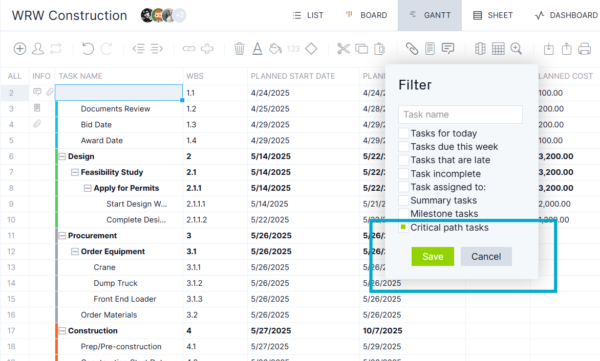
Critical Path Analysis
Schedule risk becomes visible when logic drives timelines. ProjectManager’s Gantt chart automatically calculates and displays the critical path using task dependencies alongside estimated and actual start and finish dates. As schedules evolve, the critical path updates dynamically, allowing teams to identify activities that directly impact delivery dates and focus attention on tasks with zero float before delays cascade through the project.
Related: 20 Best Gantt Chart Software of 2026 (Free & Paid)
Resource Allocation
Planning work without resources creates blind spots. ProjectManager’s Gantt chart supports allocating both human and non-human resources, including materials and equipment, directly to tasks. Capacity and workload charts complement the schedule by revealing overallocations and idle time, helping teams rebalance assignments, optimize utilization and maintain productivity while coordinating complex projects across departments and shared resource pools.

Project Cost Management
Cost control starts at the planning stage and continues through execution. ProjectManager’s Gantt chart enables teams to set project budgets, estimate task-level costs and monitor spending as work progresses. Actual costs are tracked alongside planned values, making variances immediately visible. Built-in timesheets capture labor hours for accurate labor cost tracking, while real-time comparisons between estimates, budgets and actuals support informed decisions, corrective actions and financial accountability throughout the entire project lifecycle.
Robust Project Tracking
Visibility improves when tracking adapts to the project, not the other way around. ProjectManager’s Gantt chart includes customizable columns that let managers define their own tracking categories directly within the schedule grid. Planned performance is measured by comparing estimated task start and finish dates against actual dates as work progresses.
The same side-by-side logic applies to estimated versus actual costs, making deviations immediately clear. Task-level percentage completion is displayed visually, allowing teams to assess progress at a glance. Together, these capabilities turn the Gantt chart into a centralized tracking system that supports schedule control, cost oversight and informed decision-making throughout execution.
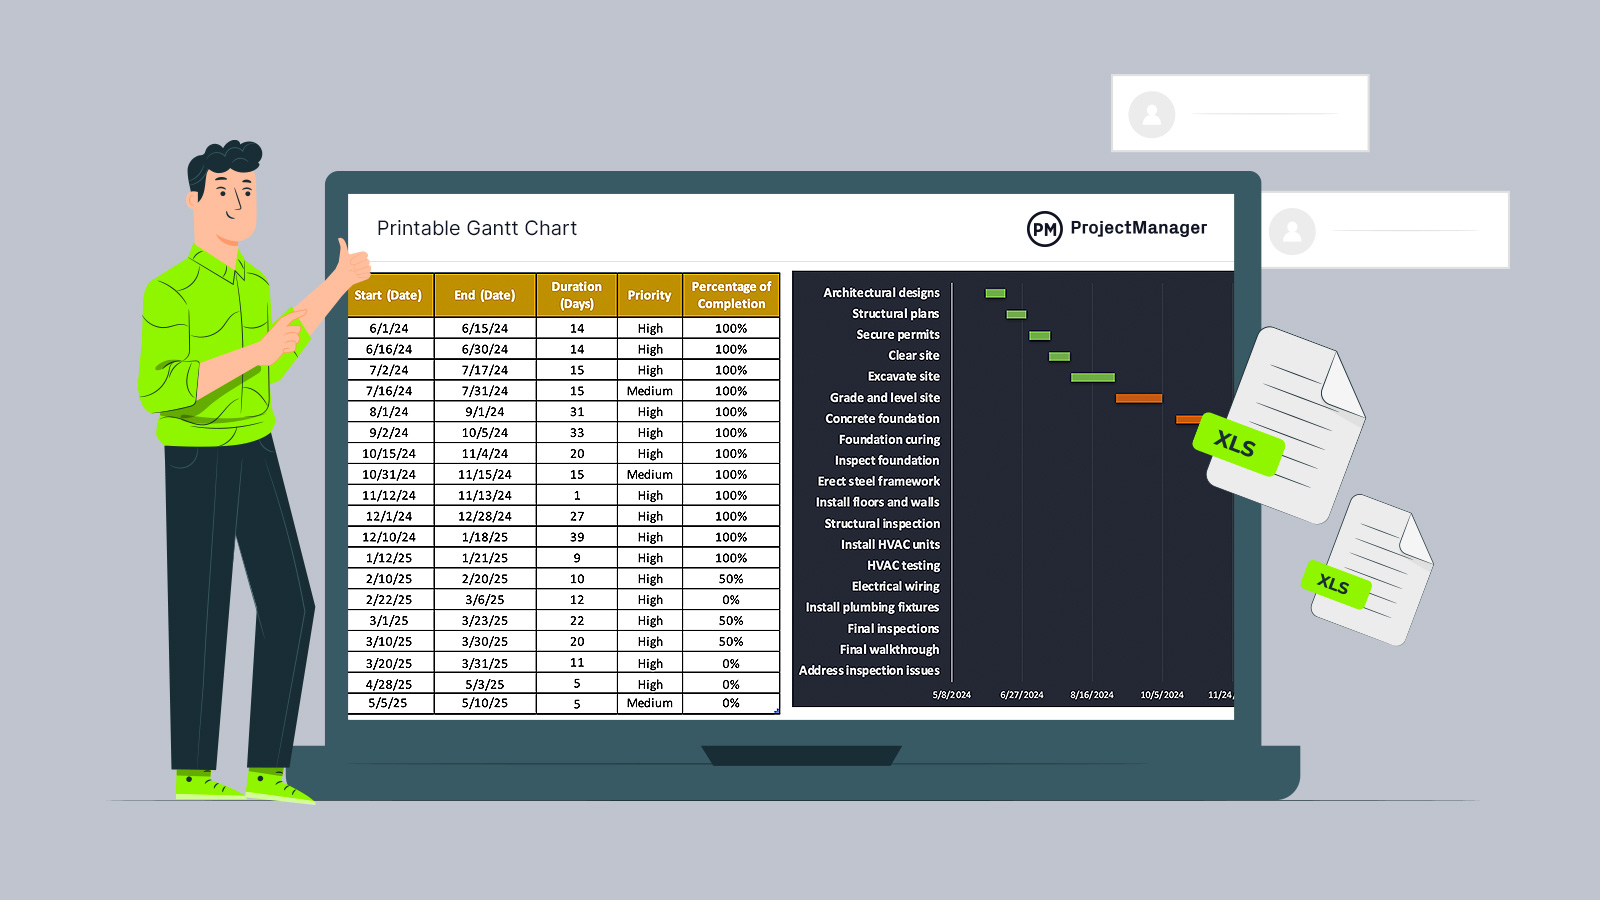
Free Printable Gantt Chart Template
For teams that prefer spreadsheets, this free printable Gantt chart template for Excel is built with printing in mind. Simply click on the image below to download the template. The layout is optimized to fit cleanly across two landscape-oriented pages, making it ideal for meetings, reviews and offline schedule sharing without manual resizing or adjustments.
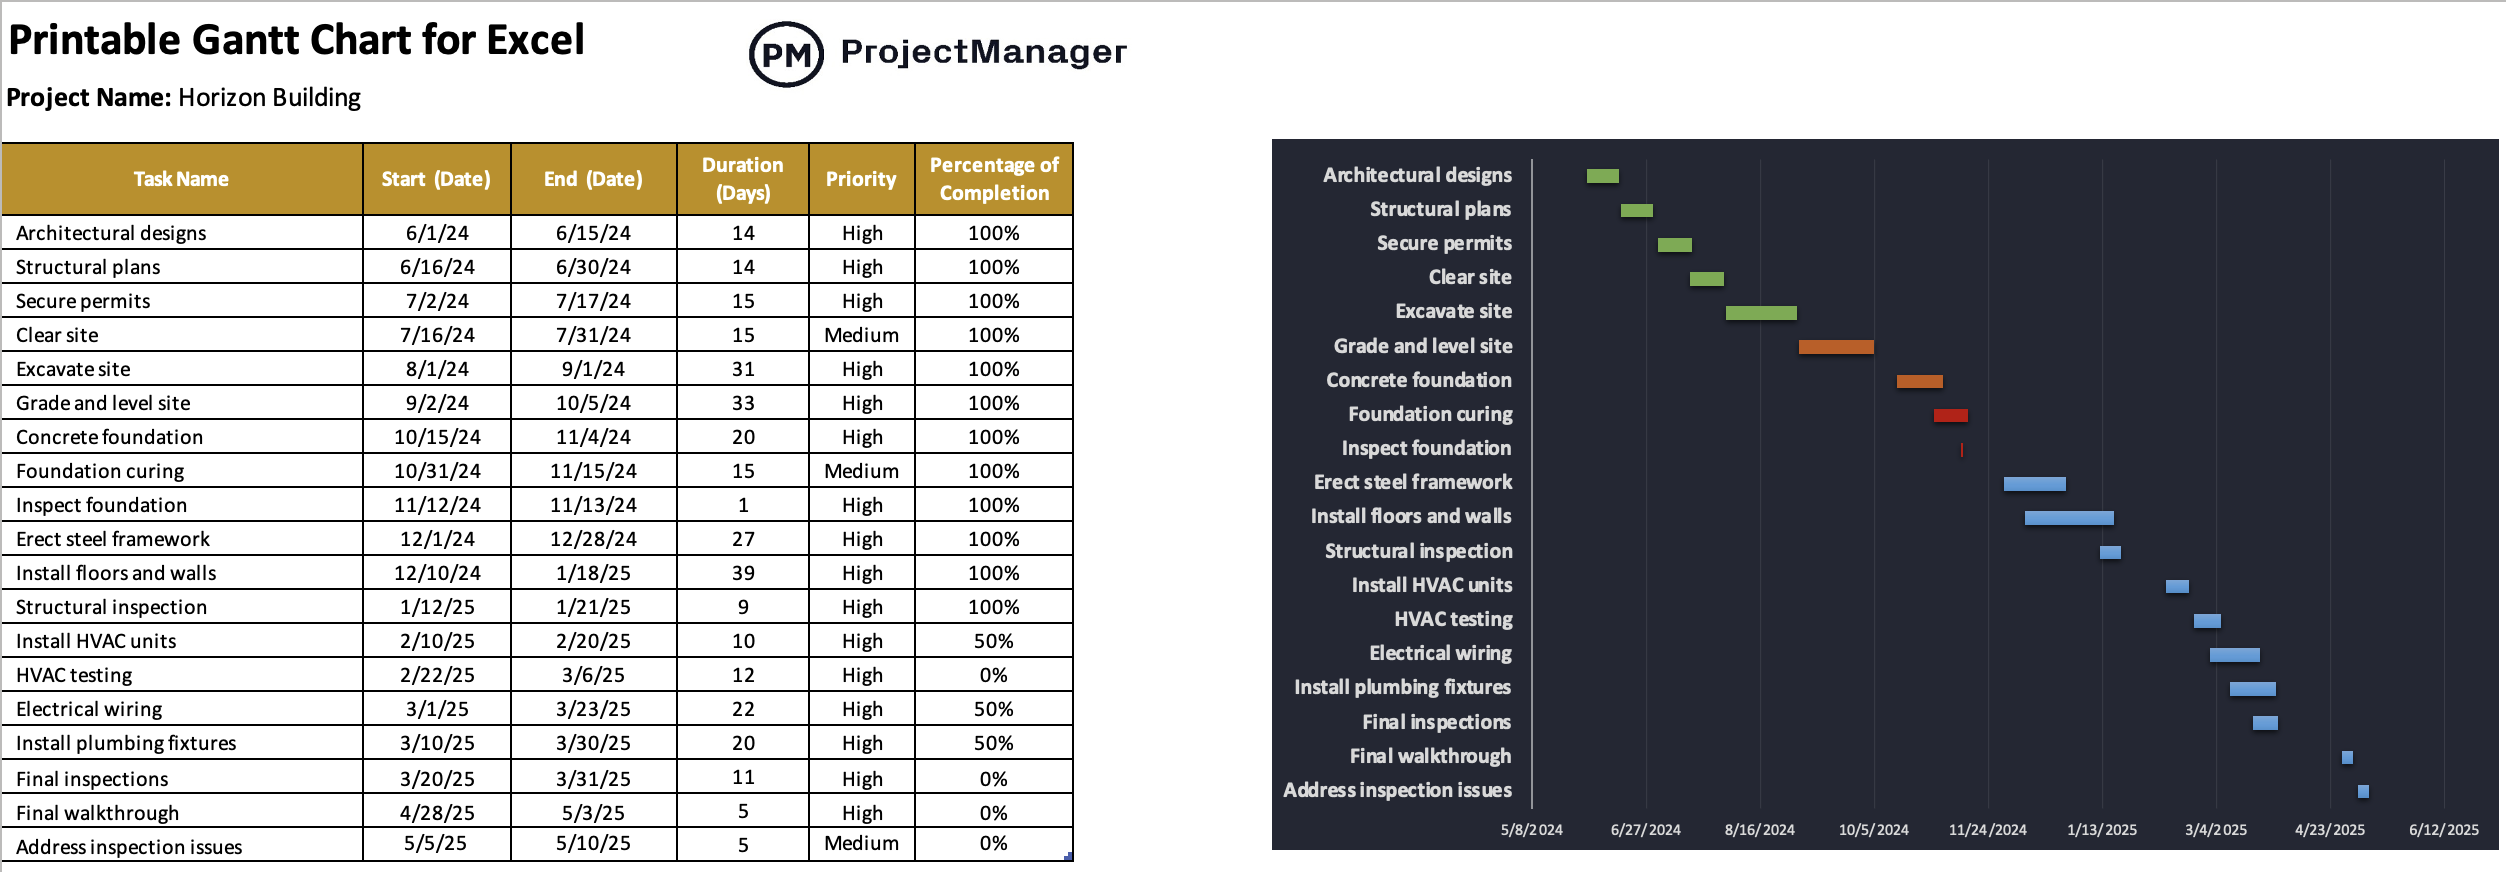
Instead of spending time formatting charts, this template focuses on speed and simplicity. Users generate a complete Gantt timeline by entering basic schedule data, while the file handles layout and visualization automatically.
- List project tasks in the spreadsheet grid
- Enter start and due dates for each task
- Let the template auto-generate a stacked bar Gantt timeline
- No chart formatting or scaling required
- Print directly in a two-page landscape layout with correct spacing
Free Related Project Management Templates for Excel
We’ve created over 100 project management templates that can help with every stage of the project life cycle. Here are some of them that could work well with a printable Gantt chart template for Excel.
Project Charter Template for Excel
This Excel project charter template captures authority, scope, risks and success criteria in a single document. It aligns sponsors, project managers and stakeholders by documenting goals, milestones, budgets and approvals, creating a clear governance reference before planning and execution begin.
Project Plan Template for Excel
Designed for execution-focused teams, this Excel project plan template connects objectives, scope, schedule, resources, budget and risks. It centralizes roles, milestones and success criteria, helping managers coordinate work, track progress and maintain control from kickoff through closeout across complex initiatives.
Project Budget Template for Excel
Built for detailed cost control, this Excel project budget template tracks labor, materials and fixed costs at the task level. Planned and actual amounts roll up automatically, making variances visible while supporting WBS-based budgeting, resource assignments and accurate financial oversight throughout execution.
ProjectManager Offers Much More than a Printable Gantt Chart
ProjectManager’s software offers much more than just Gantt charts. Teams in industries like construction, manufacturing, professional services, IT and more love to use various other project views, including the sheet, list, kanban board and calendar. From workflow and automation to the latest AI technology, our software has everything you need to stay productive.
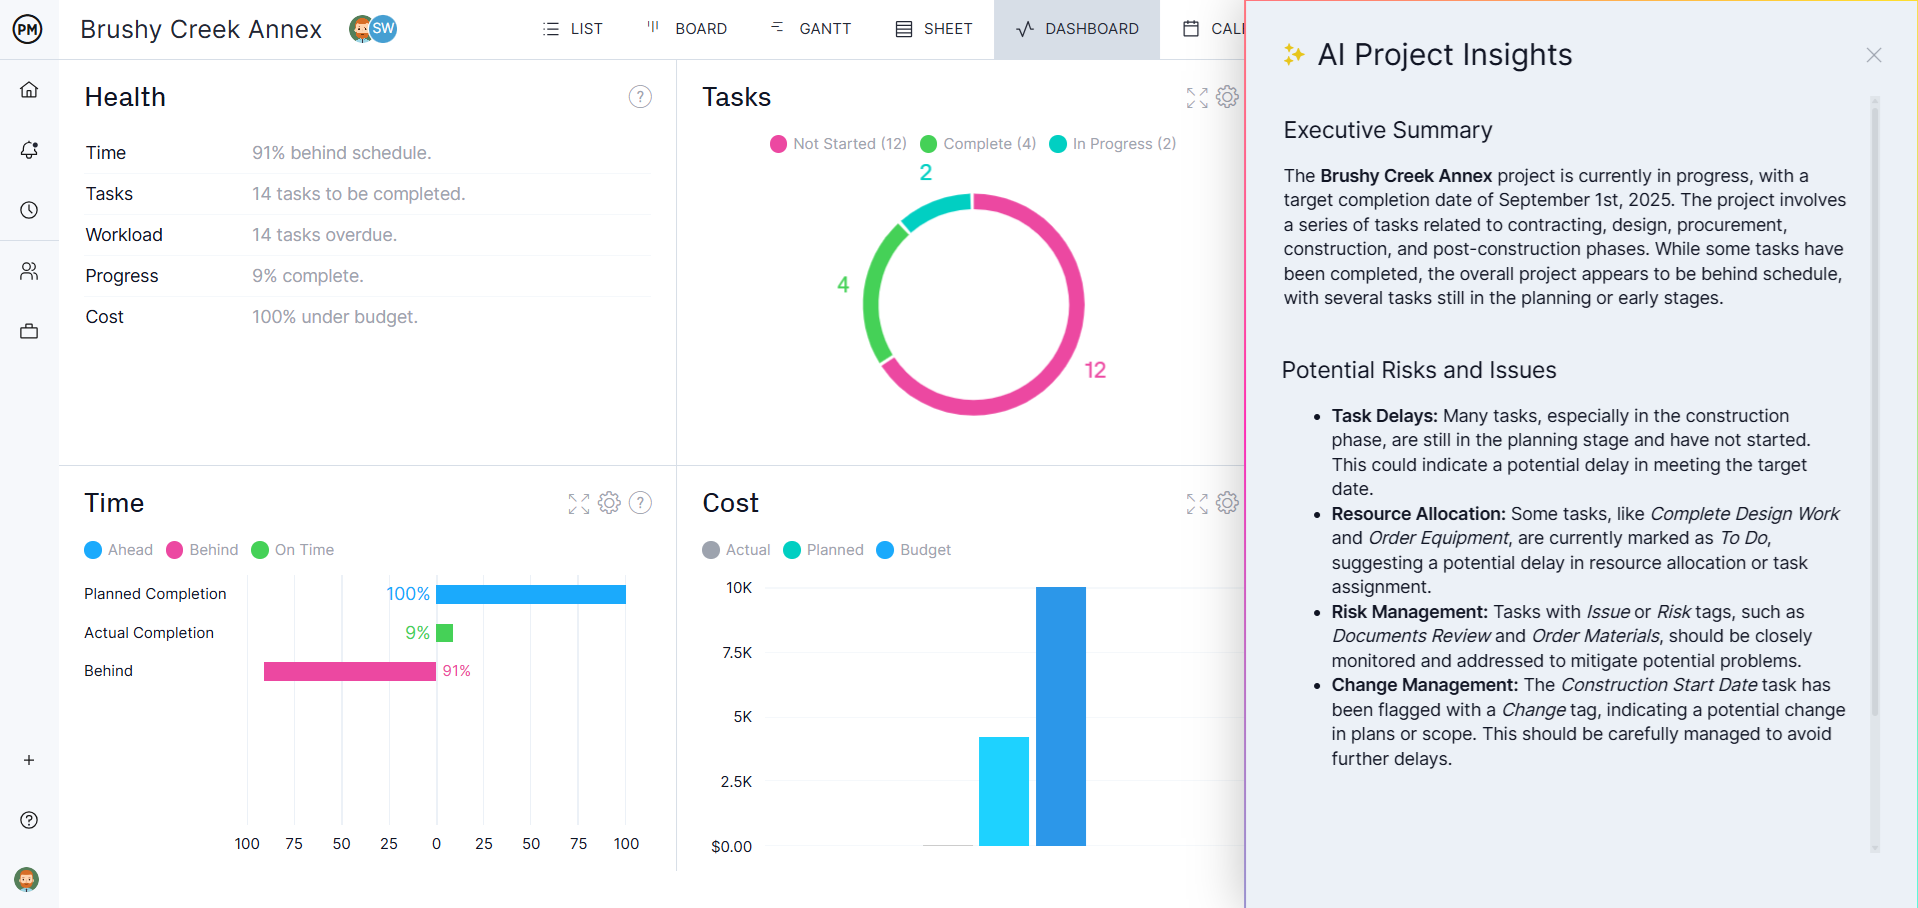
Use AI Project Insights to Minimize Risks
In just a click, AI Project Insights analyzes your project data and makes specific recommendations. It can help you identify potential risks and issues, providing you with tangible steps on how to keep your project on track.
Share Reports with Stakeholders
Keeping project stakeholders updated on project progress is essential. Generate custom reports in a few clicks, allowing you to keep stakeholders in the loop on various aspects of your project. You can use reports alongside our project and portfolio dashboards to track data in real time.

Related Gantt Chart Content
- How to Make a Gantt Chart in Excel Step By Step
- Free Gantt Chart Templates for Excel, Google Sheets & More
- Benefits of a Gantt Chart for Project Management
- How to Make a Gantt Chart: Steps, Tools & Tips
- Displaying the Critical Path on a Gantt Chart
- WBS and Gantt Chart: How to Use This Project Management Duo
- 20 Best Gantt Chart Software of 2026 (Free & Paid)
ProjectManager is online software that helps teams organize their work no matter where they are or how they work. Get real-time data for better decision-making while connecting teams and fostering collaboration. Deliver products on time, within your budget and with the level of quality that your customers expect. Try ProjectManager for free today!
