Gantt charts are a type of bar chart that’s used in project scheduling. The first design for a Gantt chart was made by Henry Gantt some time between 1920-1915. In the 100+ years of its existence, the Gantt chart has moved from paper to digital tools, such as a Gantt chart in Excel.
If you’re not using a Gantt chart to schedule your tasks and see your entire project on a visual timeline, then you’re at a disadvantage. While complicated to create and edit on paper, a Gantt chart in Excel is easier to use. Let’s go into why to use a Gantt chart in Excel, how to make one and where to download a free Gantt chart template in Excel.
Why Should You Make a Gantt Chart In Excel?
A Gantt chart is an essential tool in project management, especially for projects that use traditional methodologies, such as waterfall. That’s because the Gantt chart for Excel details the structure of a project that moves forward linearly, phase by phase.
Get your free
Gantt Chart Template
Use this free Gantt Chart Template to manage your projects better.
Get the template
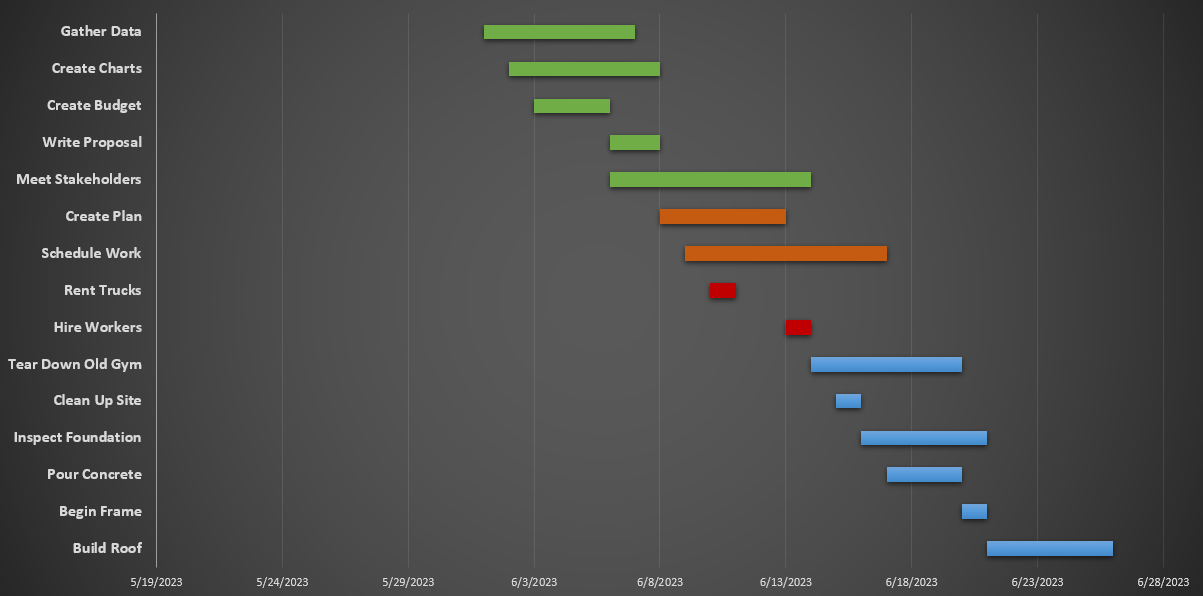
The Gantt chart for Excel organizes tasks, including their start dates and end dates. This duration is then reflected on the timeline as a bar. You can even track the progress of those tasks by shading that bar according to what percentage of the task has been completed.
When Should You Make a Gantt Chart in Excel?
Gantt charts are an essential tool throughout the project, but especially during the project planning phase. It’s ideal to make an Excel Gantt chart while planning the project, using it to make the project schedule. The tool will continue to be used throughout the project to help project managers monitor data.
What Should Be Included in an Excel Gantt Chart?
A Gantt chart for Excel consists of two main elements. On the left-hand side is a normal-looking spreadsheet, commonly referred to as the Gantt chart task list or project table. Here, you can list your tasks, due dates and resources needed including the costs related to that line item. The Gantt chart for Excel spreadsheet can capture a large volume of valuable project information.
Related: Printable Gantt Chart for Excel by ProjectManager
Here are some of the key elements that an Excel Gantt chart task list or project table should include:
- List of project tasks
- Start and end dates
- Task duration
- Priority level of each task
- Percentage of completion
- Task owner
- Required resources
- Estimated cost
The timeline side of the Gantt chart for Excel can pinpoint milestones. These are usually diamond-shaped icons that indicate important project dates, such as the end of one phase and the beginning of another or a deliverable, etc. You can even indicate tasks that are dependent on another task in order for them to start or finish.
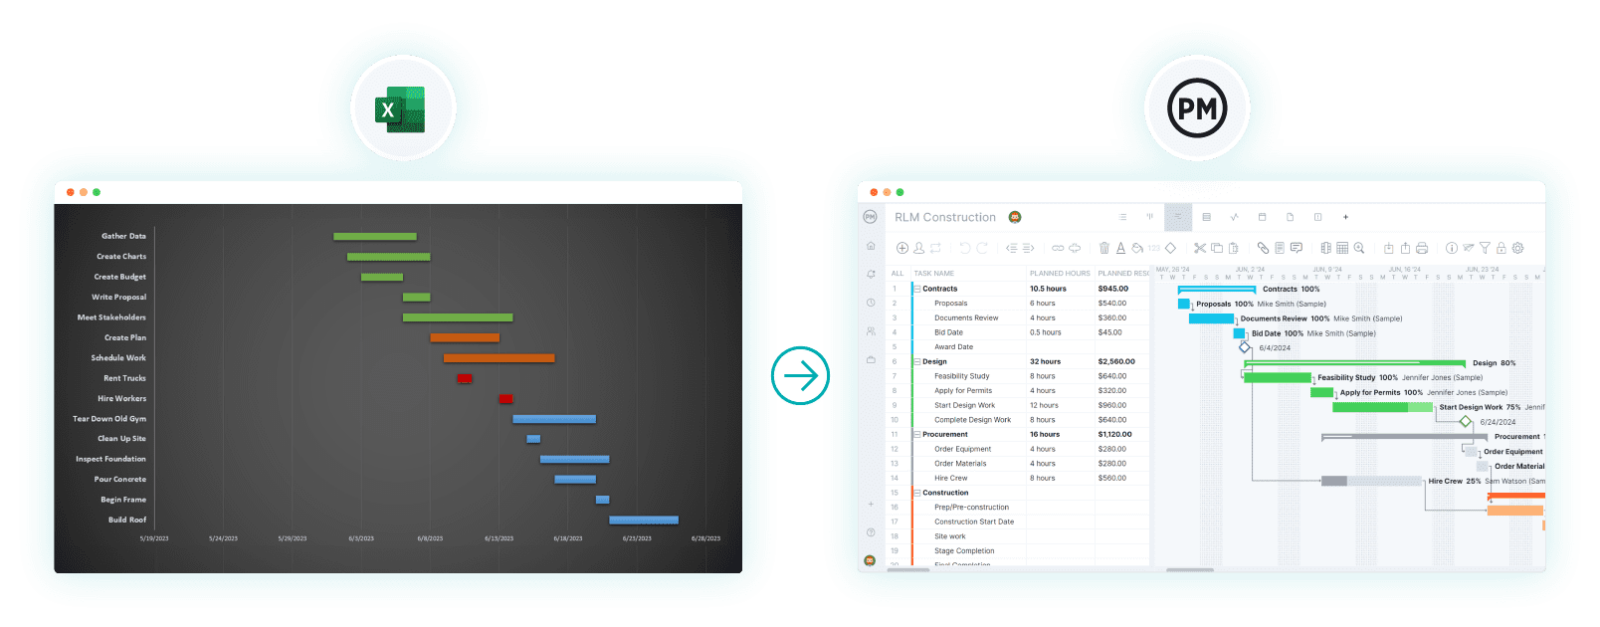
As useful as a Gantt chart for Excel can be, there are limitations. Even a digital Gantt chart requires manually updating data, which takes time away from the project. There has been another evolution as Gantt charts on paper moved to Gantt charts for Excel and, now, Gantt charts as part of a larger project management software solution.
ProjectManager is award-winning project management software with powerful Gantt charts that go beyond the limitations of Gantt charts for Excel. Define project phases, link tasks, build a WBS, filter for the critical path and set a baseline, which allows you to track actual progress against planned progress. Everything is online, too, so you can collaborate with your team and see data populate in real time. It’s easy to import an Excel file to make your Gantt in minutes. Get started with ProjectManager today for free and build a better Gantt chart.
How to Make a Gantt Chart In Excel
Making a Gantt chart in Excel is a time-consuming and labor-intensive process because Microsoft Excel doesn’t have built-in features for making Gantt charts like ProjectManager. However, you can still manually create Excel Gantt charts if you’re an advanced Excel user, as complex Excel formulas and formatting is required to shape a spreadsheet into a Gantt chart from scratch. Here’s a quick overview of what this process looks like.
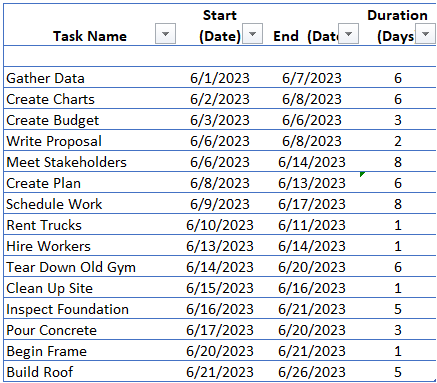
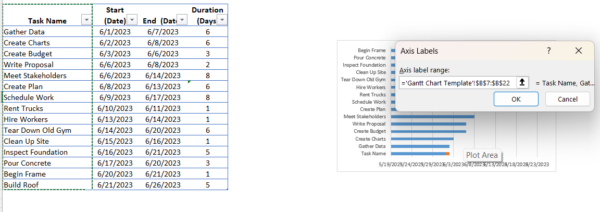
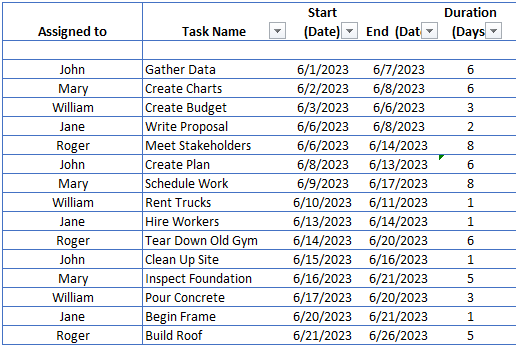
1. Make a Project Task List
Make a table with four columns as shown in the image to list your project tasks. Then, add a formula to calculate the duration of each task by subtracting the end date from the start date. This is the duration value.
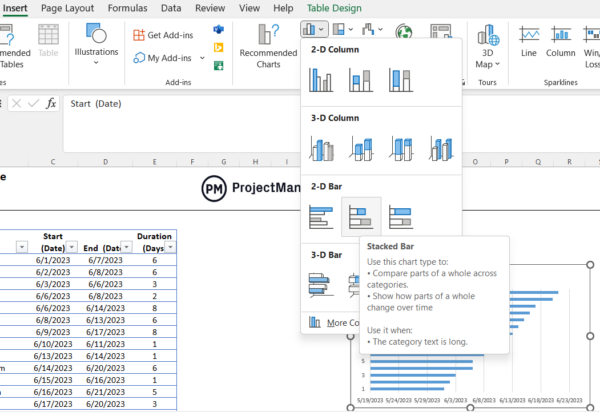
2. Make a Stacked Bar Chart
Make a standard stacked bar chart with data from your project table. The first thing you’ll need to do is to select the “Start (Date)” column and then click on insert and select the stacked bar chart from the graph menu, as shown in the image below.
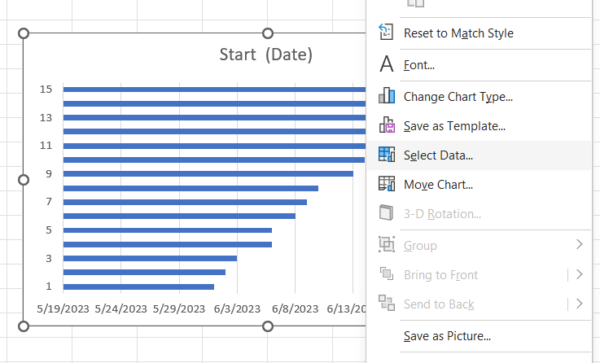
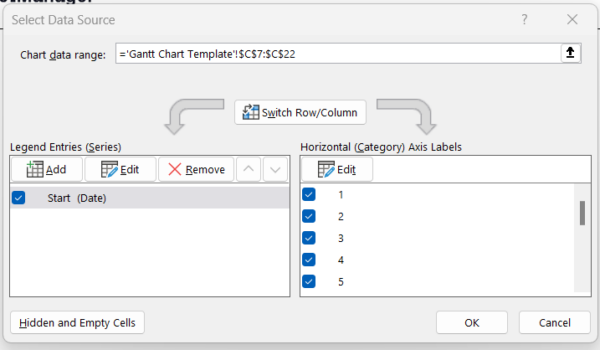
3. Add Data to Your Excel Gantt Chart
Right-click the stacked bar chart and then click on “select data” from the dropdown list.
Then click “Add” under “Legend Entries (Series)” and use the data selection tool to grab values from the “Duration (Days)” column. Select only the “Duration (Days)” cell to set it as the “Series name.”
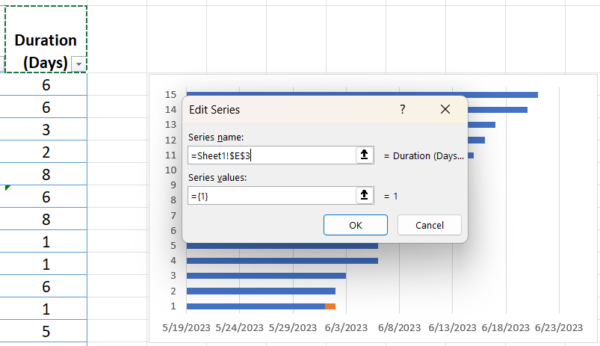
Then select the rest of the column as the “Series Values.”
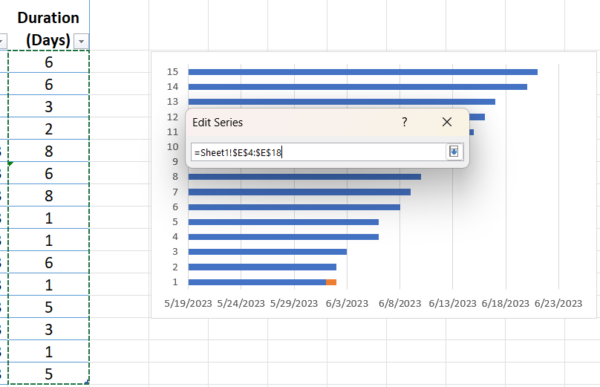
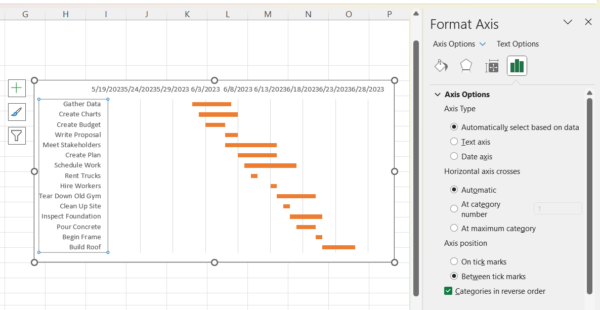
4. Edit the Horizontal Axis of Your Excel Gantt Chart
Right-click your stacked bar chart again and click on “Select Data,” but this time, click on “Edit,” under “Horizontal (category) Axis Labels.
Next, select all values from the “Task Name” column.
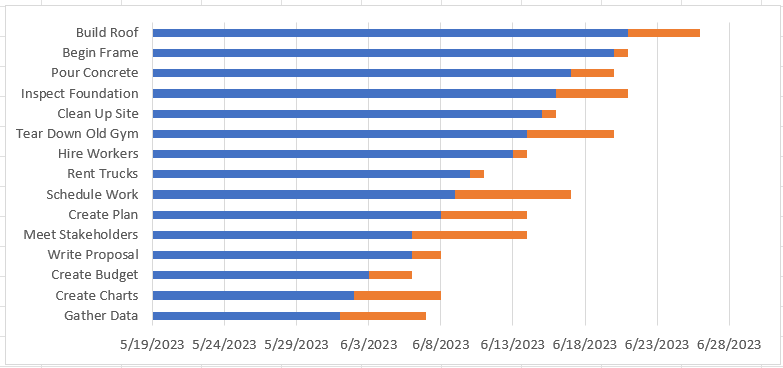
After you’ve taken these steps, your stacked bar chart should look like this.
5. Format Your Excel Gantt Chart
To turn this stacked bar chart into a Gantt chart timeline, you’ll need to format this stacked bar chart to show the task bars like a Gantt chart. To do so, follow these two steps:
Right-click the blue bars, go to format data series and then remove the fill color.
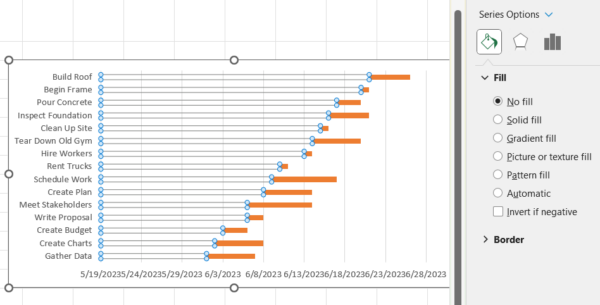
Now right-click the task names, go to the format axis and then check the “categories in reverse order” checkbox.
6. Assign Tasks to Your Team Members
Once the Gantt chart timeline is formatted properly, it’s time to add another column to assign tasks to team members to ensure tasks are executed by the appropriate team member. This streamlined schedule will act as a reference point for them throughout the project and enable them to plan for what work they’ll need to complete at various points throughout the project.
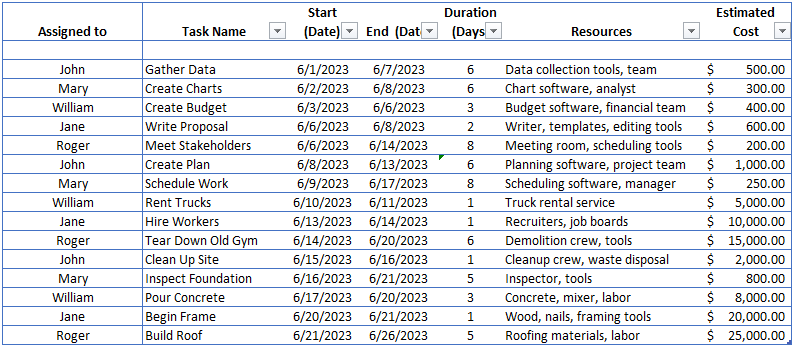
7. Allocate Resources and Estimate Costs
Resource allocation and cost estimation come next. This is an essential step when making a Gantt chart in Excel because it helps prevent overallocation; individuals won’t be overworked and feel burned out. If a resource is underutilized, it can be reallocated to more critical tasks. By assigning costs with each task, it’s also easier to create a more realistic project budget.
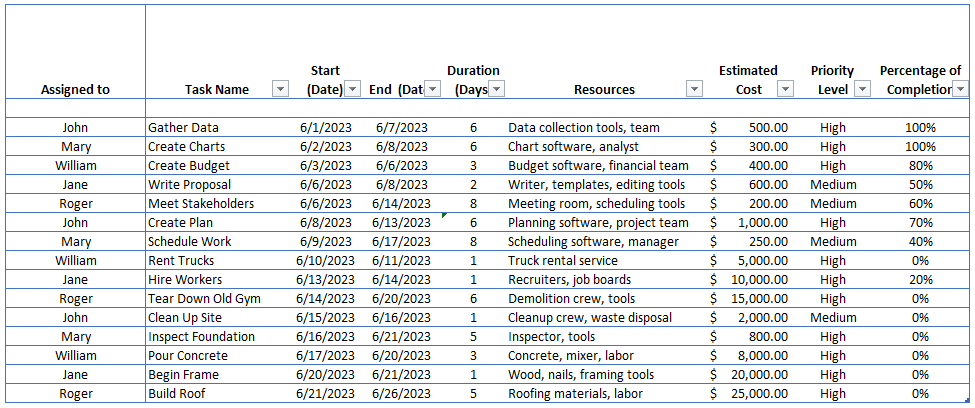
8. Add More Details to the Project Task List
The purpose of an Excel Gantt chart is to act as a reference for how the project schedule is evolving so you might want to include details such as the priority level and the percentage of completion for each task. It makes it easy to see at a glance how the project is progressing and alerts the project manager if action needs to be taken.
9. Customize the Appearance of the Excel Gantt Chart
The appearance of the Gantt chart is fully customizable, too. Feel free to color-code it to represent different project stages or assignees. You can also add your brand logo, brand colors or other touches that will make this asset even more appealing to your team and to stakeholders who will be viewing it.
And that’s how you make a Gantt chart in Excel. However, if you’d like to save some time, you can use our Gantt chart template for making an Excel Gantt chart in minutes.
Gantt Chart Excel Template
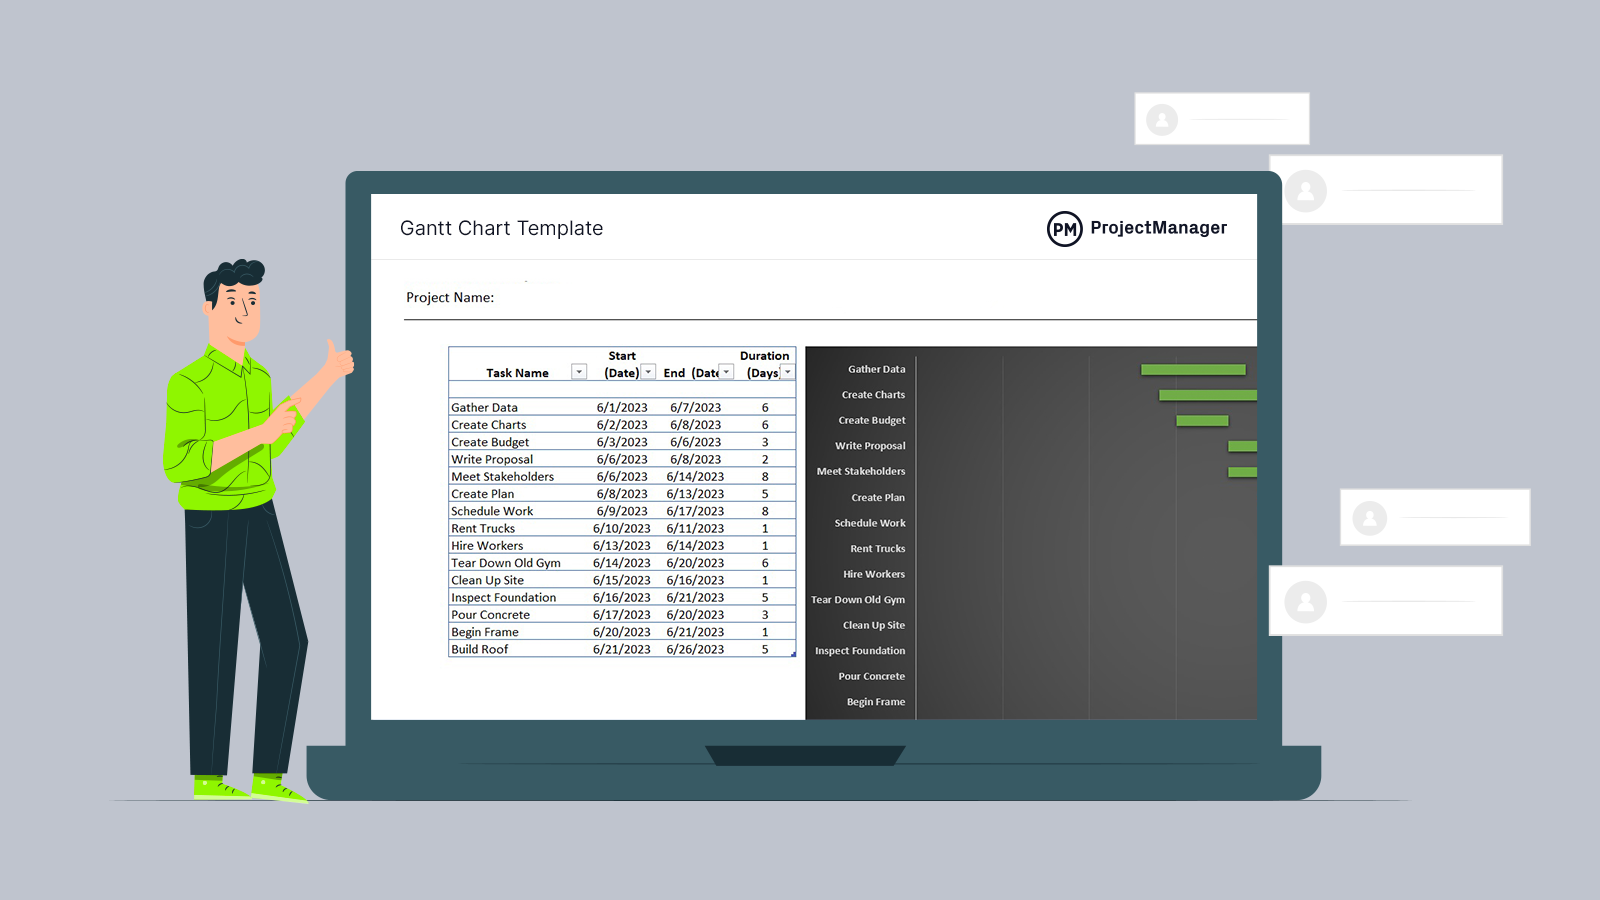
Yes, building a Gantt chart for Excel from scratch is a lot of work. But it’s worth it. Still, there are workarounds. For example, ProjectManager has a free Gantt chart template for Excel that you can download and use right now. Our free Gantt chart for Excel is formatted so you can just add your tasks and start and end dates and they’ll automatically populate the timeline to the right. Download your free Gantt chart template for Excel now and save yourself the time and effort of building one from scratch.
Advantages of an Excel Gantt Chart
We’ve already mentioned some of the advantages of using a Gantt chart for Excel, but there are many more. The most obvious advantage is that a project manager can see everything that’s going on in the project, but also it improves communication with stakeholders and the project team. Managers know who’s working on what, when it’s due and whether it’s on track.
A Gantt chart for Excel also helps with avoiding resource overload. You can plan your resources efficiently and make sure you have what you need when you need it. Using task dependencies makes it easier to avoid overlapping activities, which can cause bottlenecks that impact your schedule. This also improves time management, which is important for keeping to your project schedule.
You can also build better communication with your team and that’ll lead to improved productivity. The work is transparent on a Gantt chart for Excel, which helps teams collaborate. And, if you’re working on more than one project at a time, you can view all those projects on a Gantt chart for Excel to better share resources and get the most value out of the portfolio or program.
Disadvantages of an Excel Gantt Chart
All that doesn’t mean Gantt charts for Excel are without their problems. As you can see from the how-to tutorial above, building a Gantt chart in Excel can be difficult. There’s a lot you have to manually add and the more complex the project, the more arduous the task of creating a Gantt chart in Excel. That doesn’t even speak to having to edit the Gantt chart in Excel, which is almost like starting from scratch.
You can try to add formulas to build the bar chart part of the Gantt chart, but Excel isn’t really built for this type of work. It’ll involve coding beyond a simple formula to populate the bar chart from the spreadsheet. While you can get templates that do this, they still require manually inputting the data. Suddenly, the cost in terms of time is trumping whatever savings you might suggest you’re getting from not investing in project management software.
The advantages of using a Gantt chart are undisputable, however, a Gantt chart for Excel puts the brakes on the efficiency of the tool to the point many will shy away from using it. That’d be a mistake. Gantt charts don’t have to live in Excel spreadsheets. When part of a project management software they are easy to create, edit and share with the team.
ProjectManager Is Better Than Making a Gantt Chart In Excel
Once you get tired of manually updating your templates, which are always behind the project you’re tracking, then you’ll want to upgrade to project management software. ProjectManager is award-winning project management software that delivers real-time data to make more insightful decisions. Our Gantt charts leave Gantt charts for Excel in the dust, automatically updating with live data so you’re seeing the actual project’s progress and performance, not a snapshot of yesterday’s news.
Fully Featured Gantt Chart View
Gantt charts are incredibly useful in Excel, but Excel versions don’t have the same features as award-winning project management software. ProjectManager’s Gantt chart is incredibly powerful as it can link all four types of task dependencies. We also have features such as critical path analysis, the ability to compare planned versus actual costs and live data integrations with timesheets, reports and dashboards. Unlike an Excel Gantt chart, ours updates in real time with the most recent data.

Work on Multiple Project Planning Tools
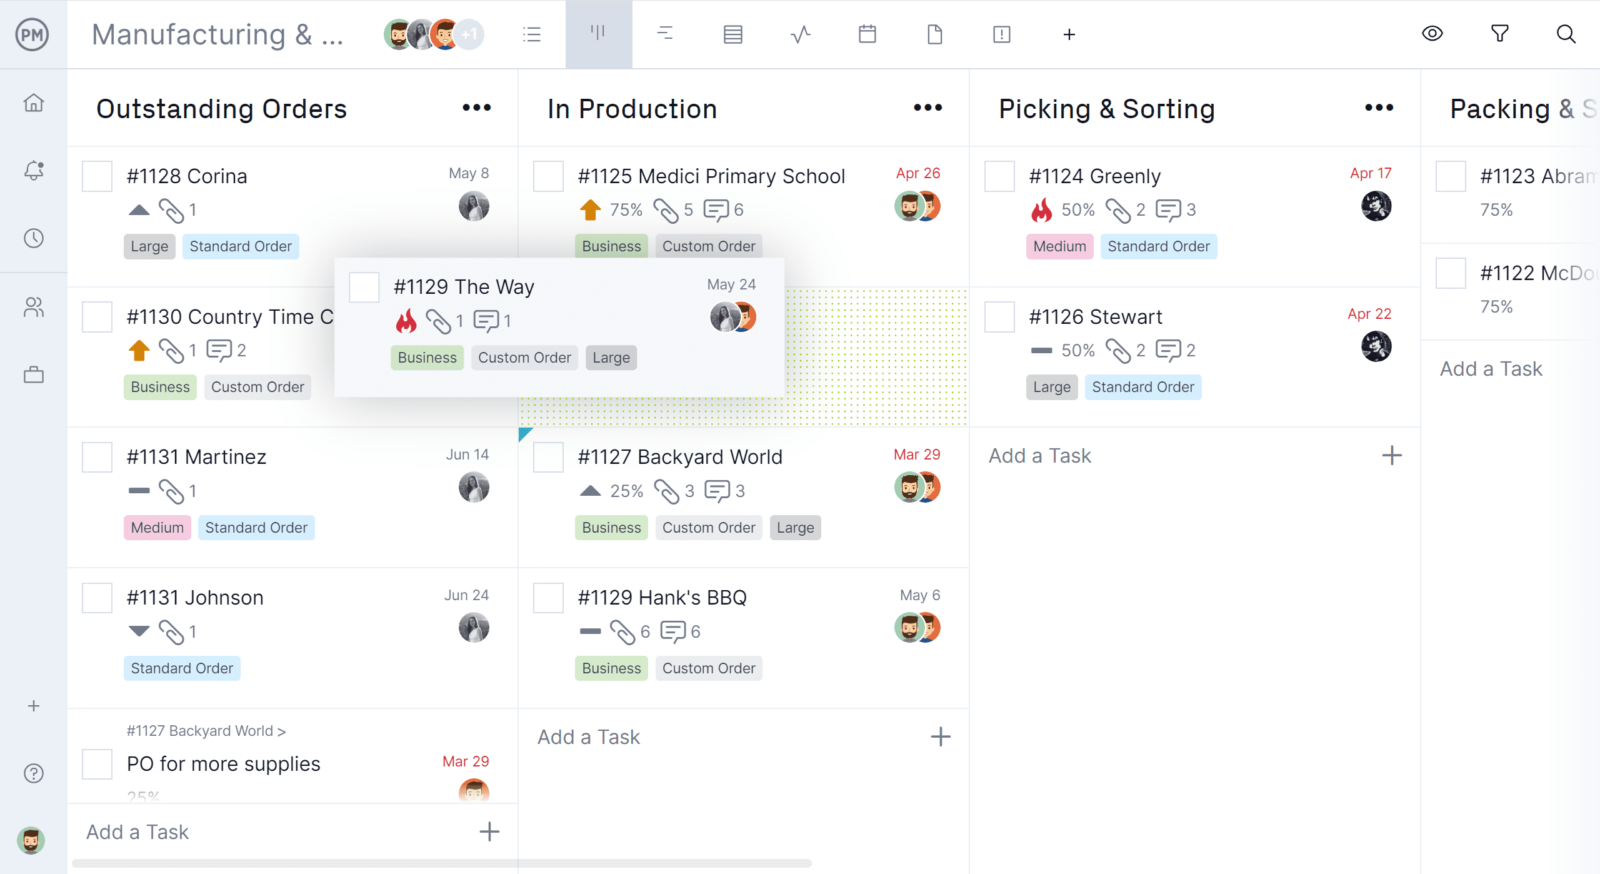
But the Gantt chart is only one of the multiple project views you get with our software. Gantt charts are great for managers, but teams usually don’t need all that data. They want to focus on their tasks, which is exactly what they can do with robust task lists. Or they can manage their backlog and collaborate with kanban boards that visualize workflow and give managers visibility into the process so they can spot bottlenecks early and reallocate resources quickly to keep production moving forward. The calendar view is great for stakeholders who want to make sure milestones are being met. All views update simultaneously so everyone is always on the same page.
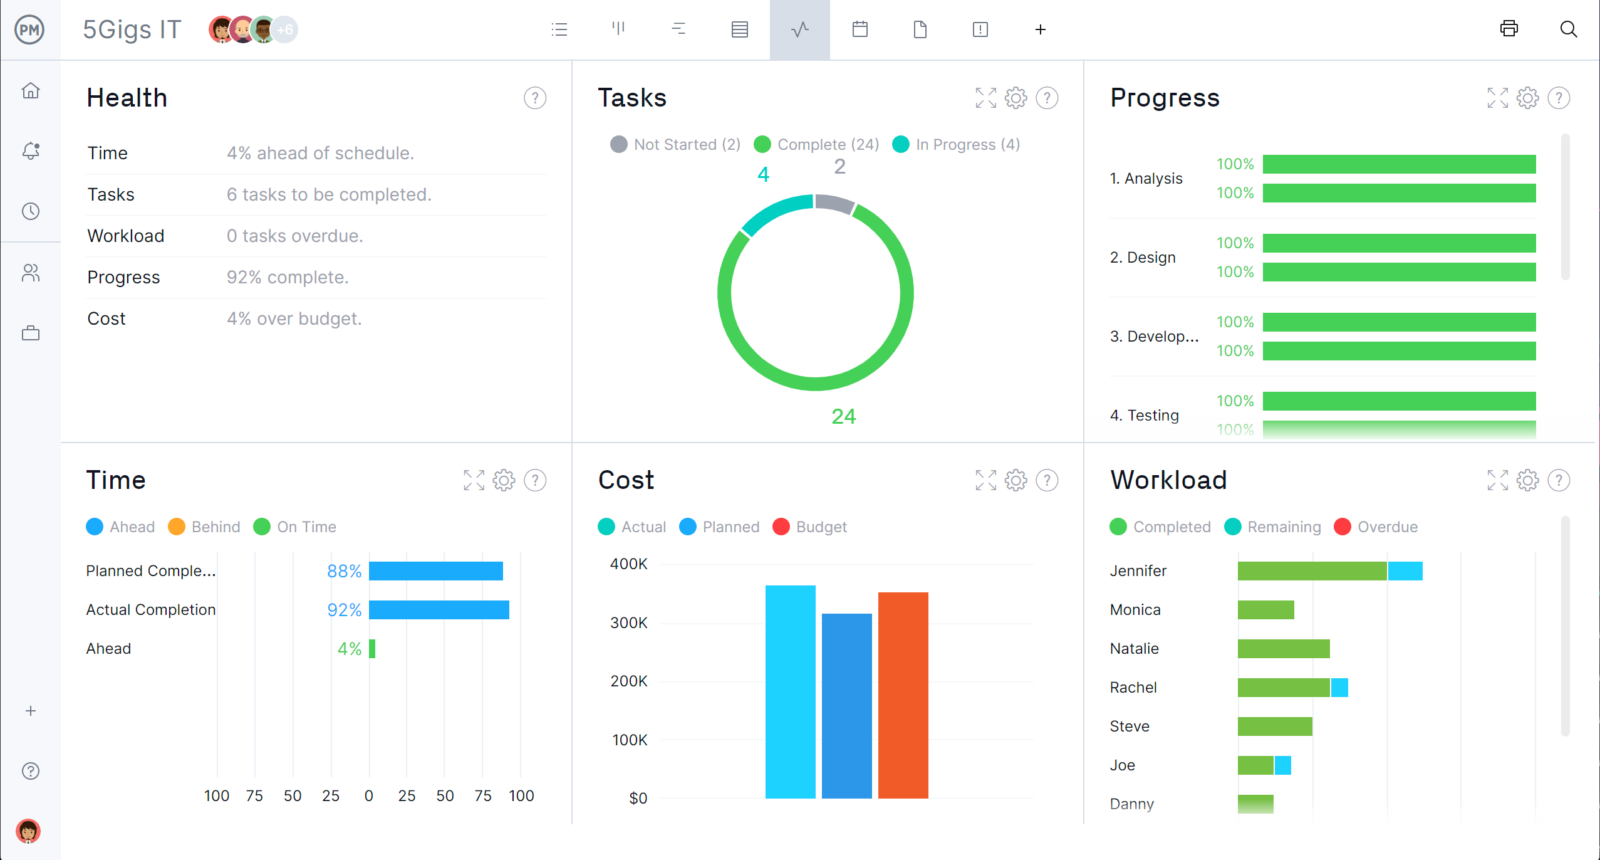
Track With Real-time Project Dashboards
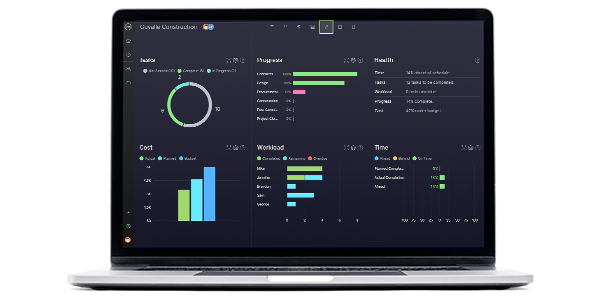
You can use the free dashboard template for Excel, but why waste all that time setting it up and manually inputting the data? Our real-time dashboard works automatically and captures live data, which is then displayed in easy-to-read graphs and charts that show project metrics such as time, cost and more. Other project management tools have dashboards, but just like an Excel spreadsheet, you’ll have to spend a lot of time configuring them. Ours is ready to give you a high-level overview of the project whenever you want. Just toggle over and it’s ready.
Our software also has risk management features to identify project risks when planning and then track and resolve issues as they arise in the project. Resource management tools make it easy to set the availability of your team to streamline assignments and then monitor their work to balance workload and keep them productive. There’s automated workflow and task approvals and so much more than a Gant chart for Excel can’t even dream of.
More Free Project Management Templates for Excel
Of course, everyone loves free templates. If you’re not ready to upgrade to project management software, ProjectManager has dozens of free project management templates for Excel and Word that you can download right now. We have free templates for every phase of your project. Here are a few that work well with the Gantt chart for Excel.
Project Budget Template
To help make more accurate estimates when budgeting a project, use our free project budget template for Excel. Our free budget template for Excel lists all your tasks, the accompanying labor and material costs and even has columns to track your actual costs against your budget.
Project Plan Template
Before you can fill in your Gantt chart for Excel you have to have created a thorough project plan. Use our free project plan template for Word to write everything from your project scope, milestones and tasks to budget, risk and change management.
Project Dashboard Template
A Gantt chart for Excel can help you plan and even track your work to an extent. But when you need an instant high-level overview use our free dashboard template for Excel. It converts raw data into charts showing costs, workload and much more.
Related Gantt Chart and Excel Content
- Best Gantt Chart Software
- How to Make a Gantt Chart in 5 Steps
- How to Make a Gantt Chart in PowerPoint
- Five Gantt Chart Alternatives
- Easy Ways to Make a Gantt Chart with Google Sheets (Plus Templates)
- 25 Must-Have Project Management Excel Templates and Spreadsheets
- Microsoft Planner Gantt Chart: How to Make a Gantt Chart in Microsoft Planner
- ¿Cómo hacer un diagrama de Gantt en Excel? guía paso a paso
ProjectManager is online project management software that connects teams whether they’re in the next office, at the job site or anywhere in between. We foster collaboration by making it easy to share files, comment at the task level and much more. Join teams from Avis, Nestle and Siemens who use our software to deliver successful projects. Get started with ProjectManager today for free.
