A work breakdown structure (WBS) and a Gantt chart are two of the most powerful tools for scheduling projects. Together, a WBS and a Gantt chart provide a roadmap for breaking down complex projects into manageable tasks and organizing them into a visual timeline. While the WBS helps define what needs to be done, the Gantt chart shows when and how those tasks will be completed, ensuring better control and execution.
What Is a Work Breakdown Structure (WBS)?
A work breakdown structure (WBS) is a hierarchical chart that breaks down a project into smaller, more manageable components. It organizes the work required to complete the project into sections and work packages, making it easier to plan, assign and monitor tasks.
What Is a Gantt Chart?
A Gantt chart is a visual project scheduling tool that displays tasks on a calendar-based timeline. A bar represents each task, showing its start and end date, duration and dependencies. It helps project managers track progress, manage deadlines and allocate resources effectively.
Project management software has Gantt charts that seamlessly incorporate WBS. ProjectManager is award-winning project and portfolio management software with the best Gantt chart to create task hierarchies with parent and child relationships. A WBS column enables teams to break projects into manageable sections. It’s also easy to filter for the critical path to identify essential tasks and slack.
They can also link all four types of task dependencies with visual connectors between tasks on the timeline. Baseline tracking allows project managers to compare the planned timelines against actual progress to identify slippage. Automatically recalculate timelines when tasks shift to help keep projects on track. This creates a dynamic hub for planning, tracking and adjusting complex projects in real time. Get started with ProjectManager today for free.
When to Use a WBS and Gantt Chart Together?
Use a WBS and Gantt chart together when you need to plan, schedule and monitor a project from start to finish. The WBS helps define the full scope of work, while the Gantt chart builds on that structure to schedule tasks in time. This combination is ideal for complex projects with multiple phases, task dependencies and cross-functional teams.
For example, the WBS and Gantt chart duo is especially helpful in construction projects, where defining scope, sequencing activities and managing subcontractors is critical. IT project teams also use this duo to manage software development cycles, while event planners rely on it to coordinate logistics, vendors and timelines across large-scale productions.
How to Use a WBS and a Gantt Chart Together for Managing Projects
A WBS lays the foundation by identifying all deliverables and tasks, while the Gantt chart transforms that structure into a time-based plan. This tandem approach allows project managers to establish deadlines, allocate resources and track progress, all while ensuring that no task is overlooked. Follow the steps below, which are illustrated with examples from ProjectManager’s Gantt chart.
1. Begin by Creating a Thorough Task List
The first step in using a WBS and a Gantt chart is identifying all the tasks required to complete your project. Review your project scope, stakeholder inputs and historical data from similar projects. Break down deliverables into actionable steps that can be clearly understood and executed.
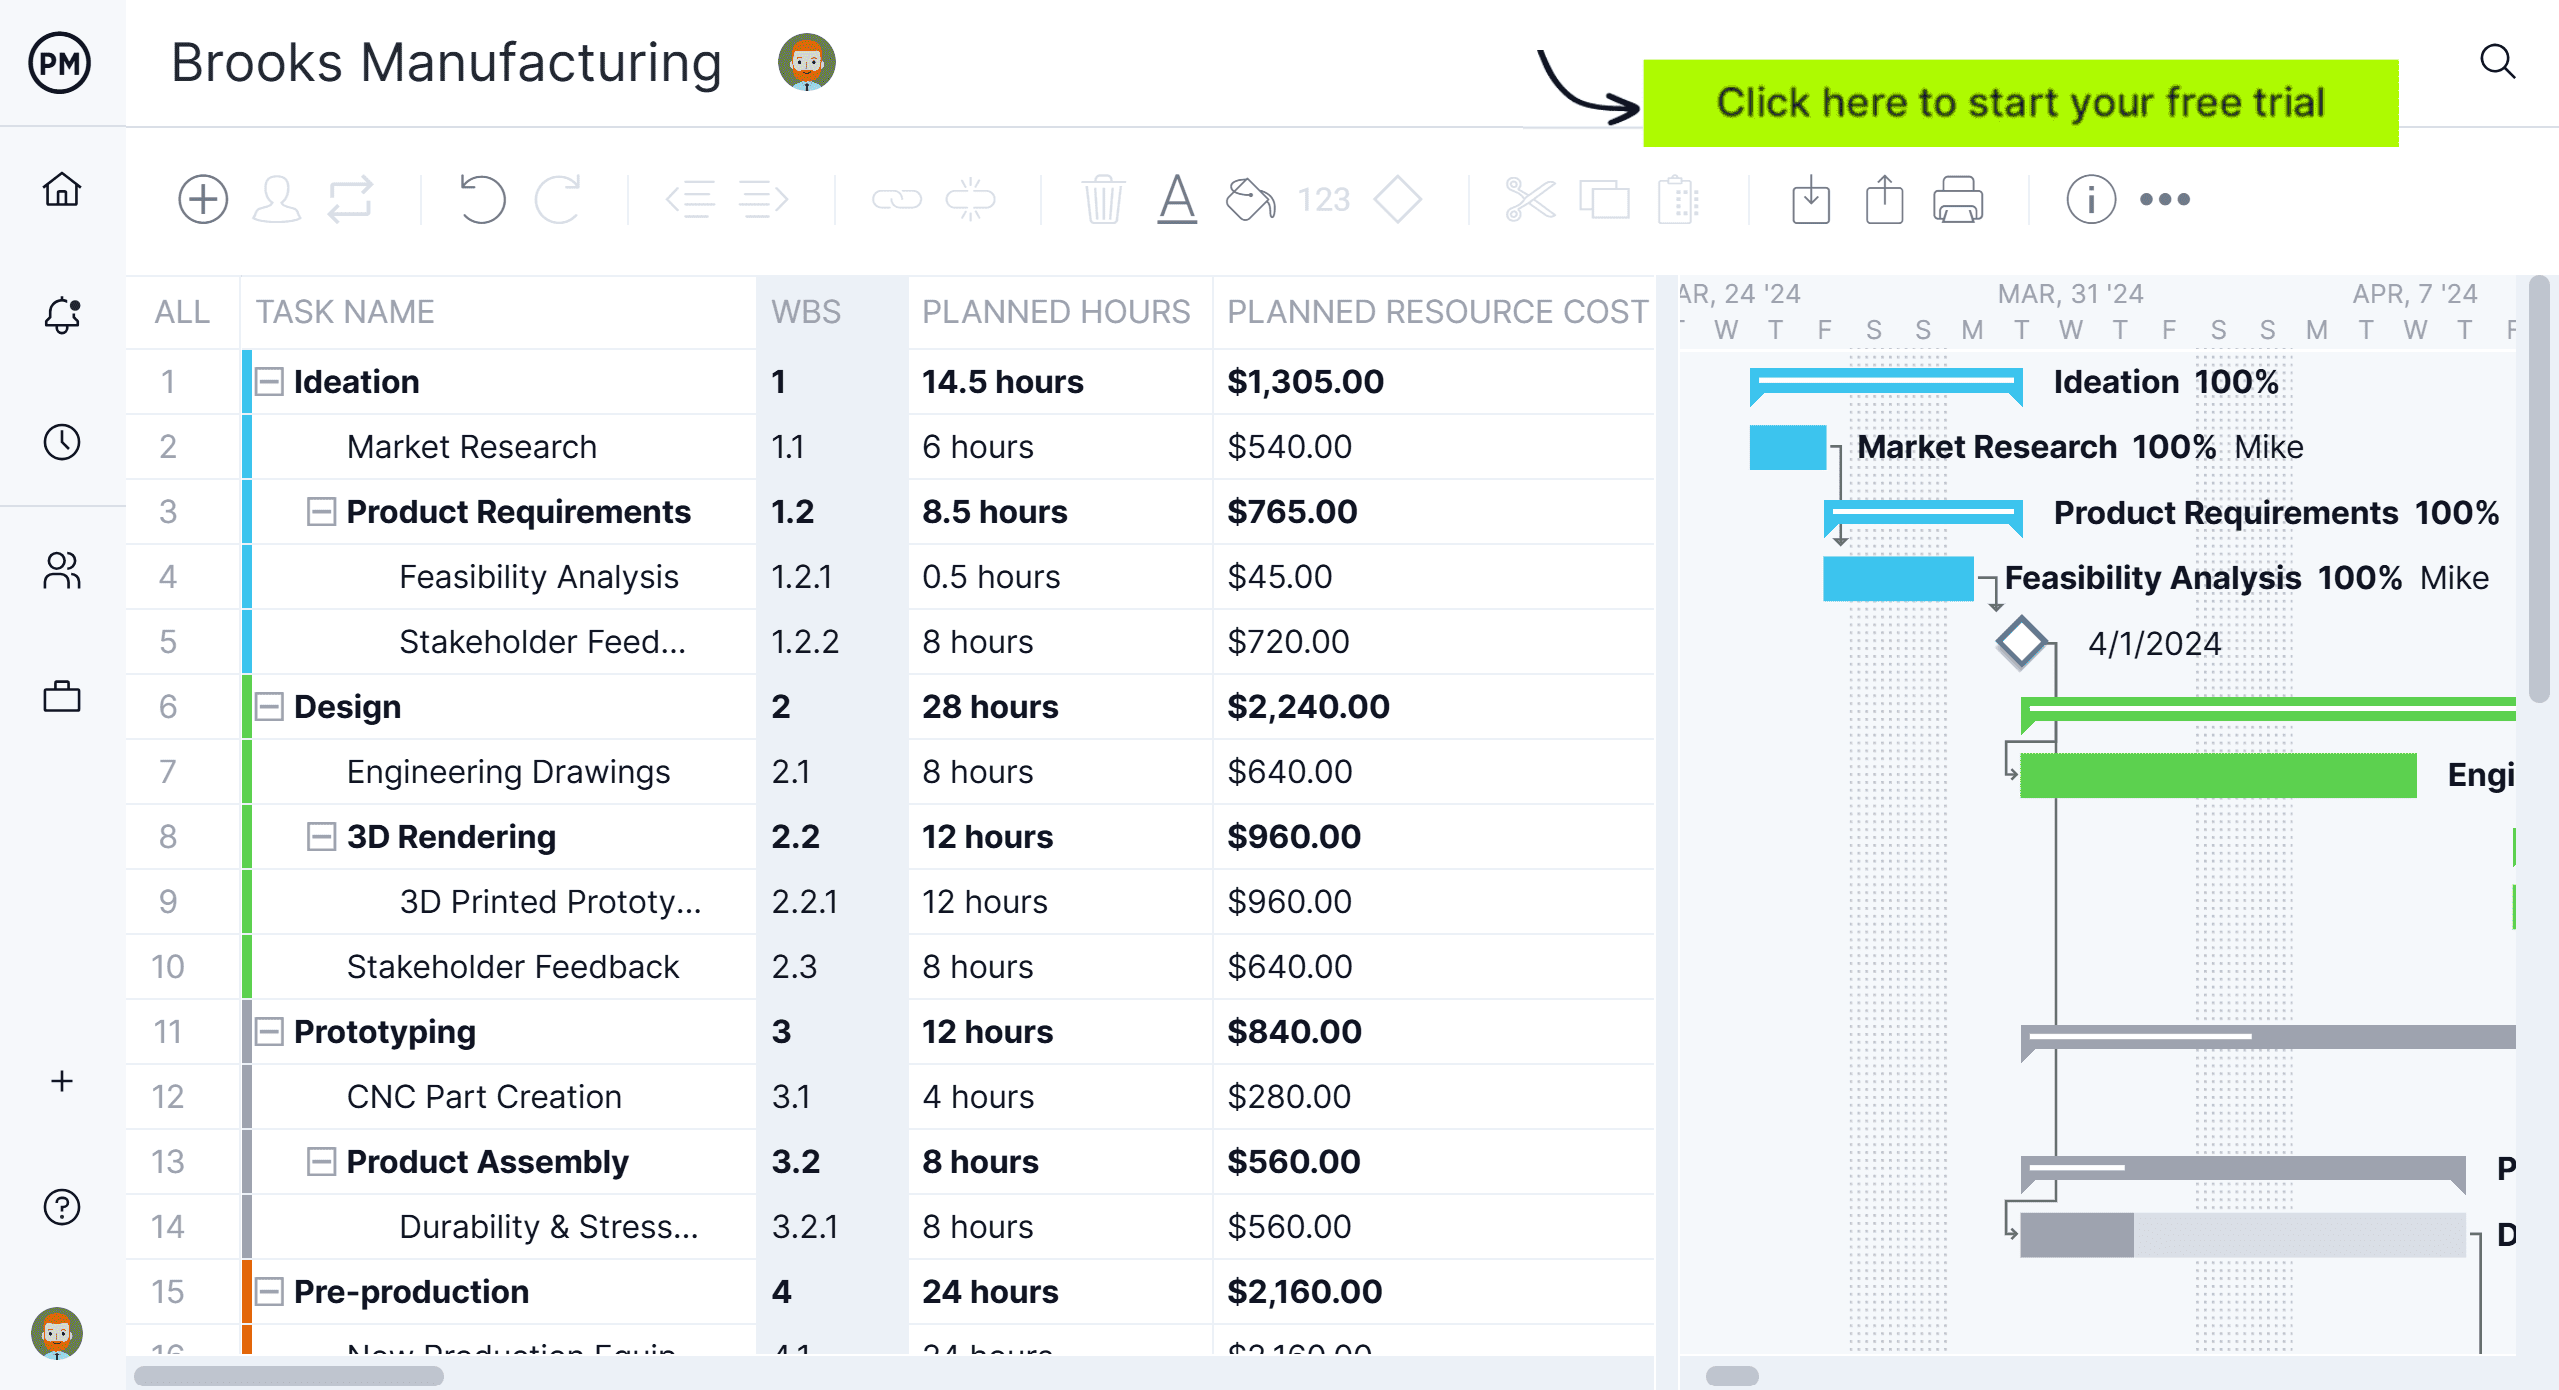
This step ensures that you’re not missing any critical activities and forms the base of your work breakdown structure. A comprehensive task list prevents scope creep and sets expectations early. Below is an example of a detailed task list on a Gantt chart.
2. Categorize Project Tasks Into Work Packages
Once you’ve listed all tasks, group them into work packages. A work package is a series of related tasks that should be executed sequentially to produce a deliverable. It’s like a small project section that a person or team can own from start to finish. Both a WBS and a Gantt chart can represent work packages.
In a numbered WBS, each work package fits under a main section. For example:
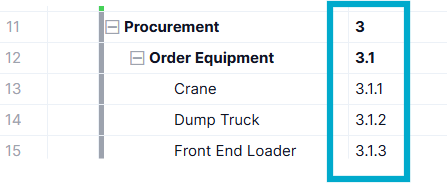
- 1.0 Order Equipment
- 1.1 Crane
- 1.2 Dump Truck
- 1.3 Front End Loader
Here, “1.0 Order Equipment” is the work package. It includes smaller tasks that all lead to the same outcome. This method keeps things organized and easier to manage.
These categories make the task list more detailed, which helps project managers assign ownership, track costs and measure progress. Each work package should be manageable and clearly defined. This step improves clarity and aligns with how teams are structured or specialized within the project.
3. Establish a Hierarchy of Tasks
Structure your work packages into a hierarchical format. Start with the main deliverables at the top and break them into smaller components. This hierarchy forms your WBS, making it easy to visualize how all project parts connect. The top-down structure improves accountability and transparency by showing how each task contributes to the overall goal. It also simplifies reporting and performance tracking.
4. Estimate Start and End Dates for Project Tasks
With your WBS in place, determine the expected duration for each task. Collaborate with team members and use past project data to create realistic estimates. Consider factors such as resource availability, potential risks and time constraints. Accurate scheduling is key to ensuring that the WBS and Gantt chart reflect a feasible timeline. This step provides a bridge between planning and execution.
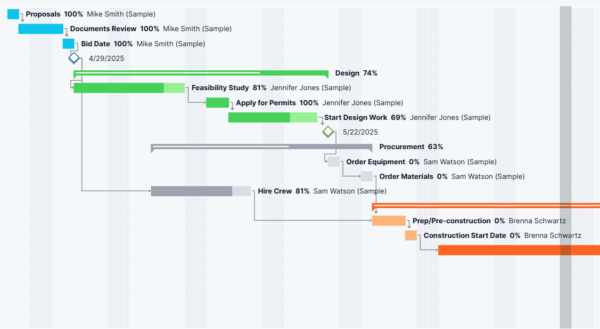
5. Create a Visual Project Timeline with the Gantt Chart
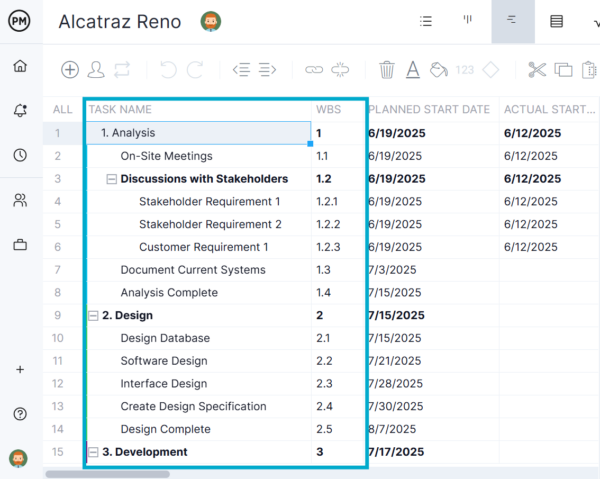
Now transfer the WBS structure and task dates into your Gantt chart tool. Each task becomes a horizontal bar along a timeline, positioned according to its start and end dates. You can see each timeline represented by the colorful bars below. The chart gives you a bird’s-eye view of the project schedule. Use it to identify overlapping tasks, critical paths and overall progress. It’s a visual way to bring your project plan to life.
6. Link Task Dependencies Together
Many project tasks depend on others being completed first; both the WBS and Gantt chart are used to identify task dependencies. In the Gantt chart, use connectors or arrows to indicate dependencies between tasks. This allows you to identify the critical path—the sequence of tasks that directly impacts the project timeline. Managing dependencies helps avoid bottlenecks and delays. It also helps adjust schedules dynamically if something unexpected occurs.
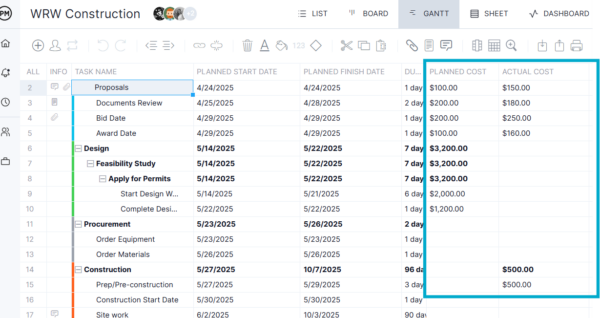
7. Allocate Resources and Estimate the Costs of Project Tasks
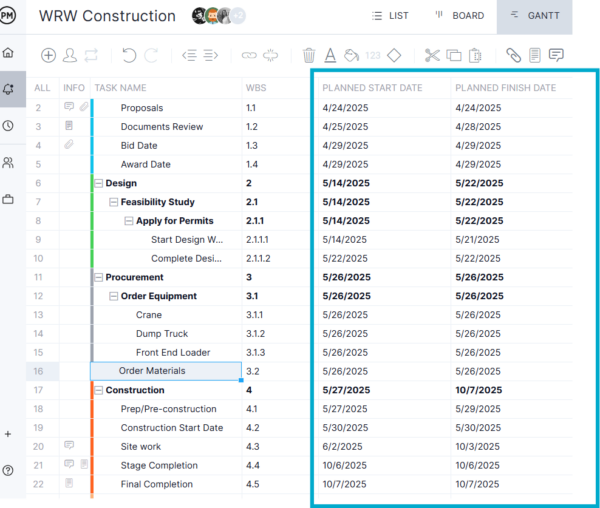
Assign team members, equipment and materials to each task in the Gantt chart. Also, include cost estimates based on hourly rates, fixed expenses or material costs. This level of detail helps you manage your project budget and ensures that resources aren’t overbooked. In the image below, we’ve highlighted the columns for planned and actual costs for each task. Linking resources and costs directly to the timeline provides clarity and helps forecast cash flow needs more accurately.
8. Monitor Projects Throughout the Project Execution with the Gantt Chart
Once the project is underway, use the WBS and Gantt chart to track task completion and identify delays or issues. Update progress regularly by adjusting task bars to reflect what’s happening. This real-time monitoring helps you stay on the schedule and make informed decisions. It also improves stakeholder communication by providing a clear picture of project status.
Free Related Project Management Templates
For those not ready to upgrade to project management software, some templates can help get the most out of a WBS and a Gantt chart. We have over 100 free project management templates for Excel and Word that can be immediately downloaded. They cover all aspects of managing projects. Here are just a few that relate to WBS and a Gantt chart.
Gantt Chart Template
Download this free Gantt chart template for Excel to visually map tasks and timelines in a horizontal bar chart format. It provides a ready-to-use framework where you can input project details such as start and end dates and task durations. This helps streamline scheduling and coordination without building a Gantt chart from scratch.
Work Breakdown Structure Template
Use this work breakdown structure template to systematically break a project into smaller, manageable components or tasks. It organizes the total scope of work into a hierarchical structure—starting from high-level deliverables and drilling down into detailed work packages—making it easier to plan, assign and track progress.
Critical Path Template
This critical path template can identify and visualize the longest sequence of dependent tasks that must be completed on time for a project to finish on schedule. This helps project managers determine which tasks are critical (i.e., have zero slack) and which ones can be delayed without affecting the overall project deadline.
How ProjectManager Helps Leverage the WBS and Gantt Chart Duo
Templates will only get you halfway there when used to manage projects. These static documents are a poor substitute for dynamic project management software. ProjectManager seamlessly integrates the WBS and Gantt charts, allowing users to organize tasks hierarchically and then automatically visualize them in a timeline format. As teams break down deliverables into manageable components within the WBS, these tasks are instantly mapped onto the Gantt chart, complete with dependencies, durations and milestones.
This integration ensures that planning stays structured while scheduling remains flexible, enabling teams to adjust timelines, track progress and manage scope—all within one synchronized view that enhances overall project clarity and control. They can then execute their work on multiple project views, from the sheet, task and calendar views to kanban boards.
Support Team Performance With Resource Planning
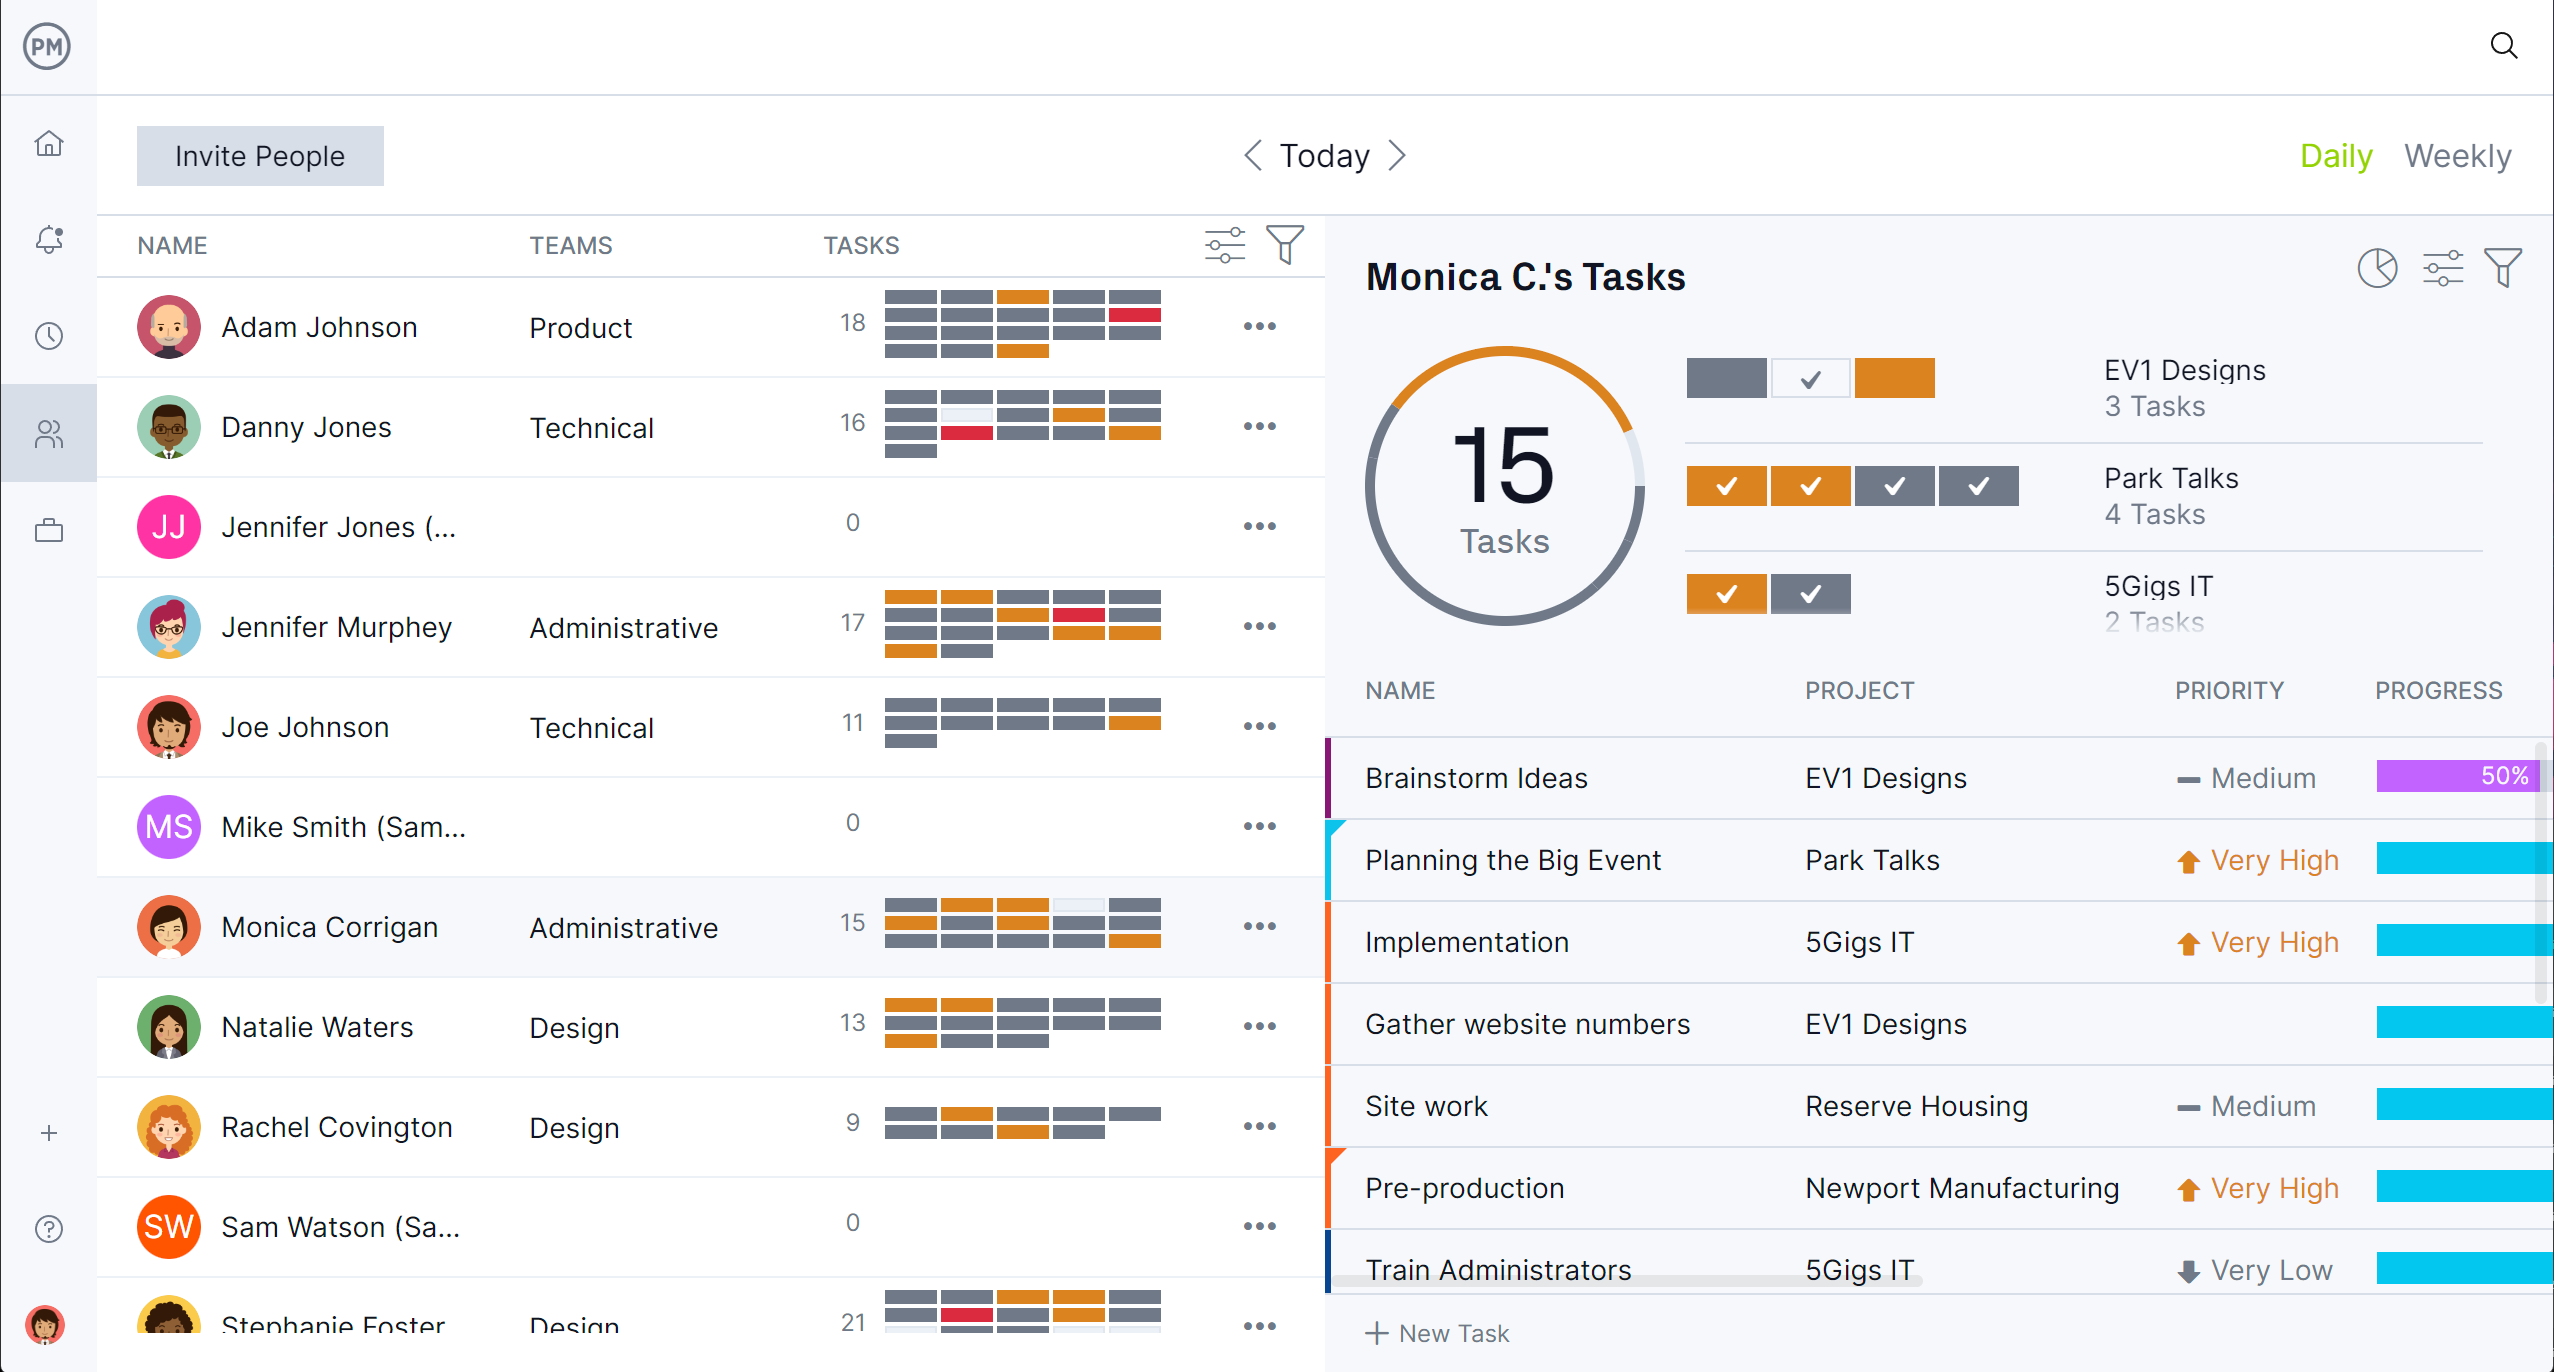
Integrating the WBS and Gantt chart directly powers our resource management capabilities by providing a detailed framework for assigning, scheduling and balancing workloads. As tasks are outlined in the WBS and scheduled in the Gantt chart, they automatically reflect in the platform’s resource planning tools. The color-coded workload chart visualizes each team member’s assignments in real time, showing over- or under-allocation based on availability.
The team page consolidates individual schedules, skills and availability, allowing project managers to make informed adjustments and redistribute tasks as needed without having to leave the page. This end-to-end connection ensures resource decisions are grounded in the actual project plan, supporting optimal team performance and reducing scheduling conflicts.
Track Project Metrics in Real-Time
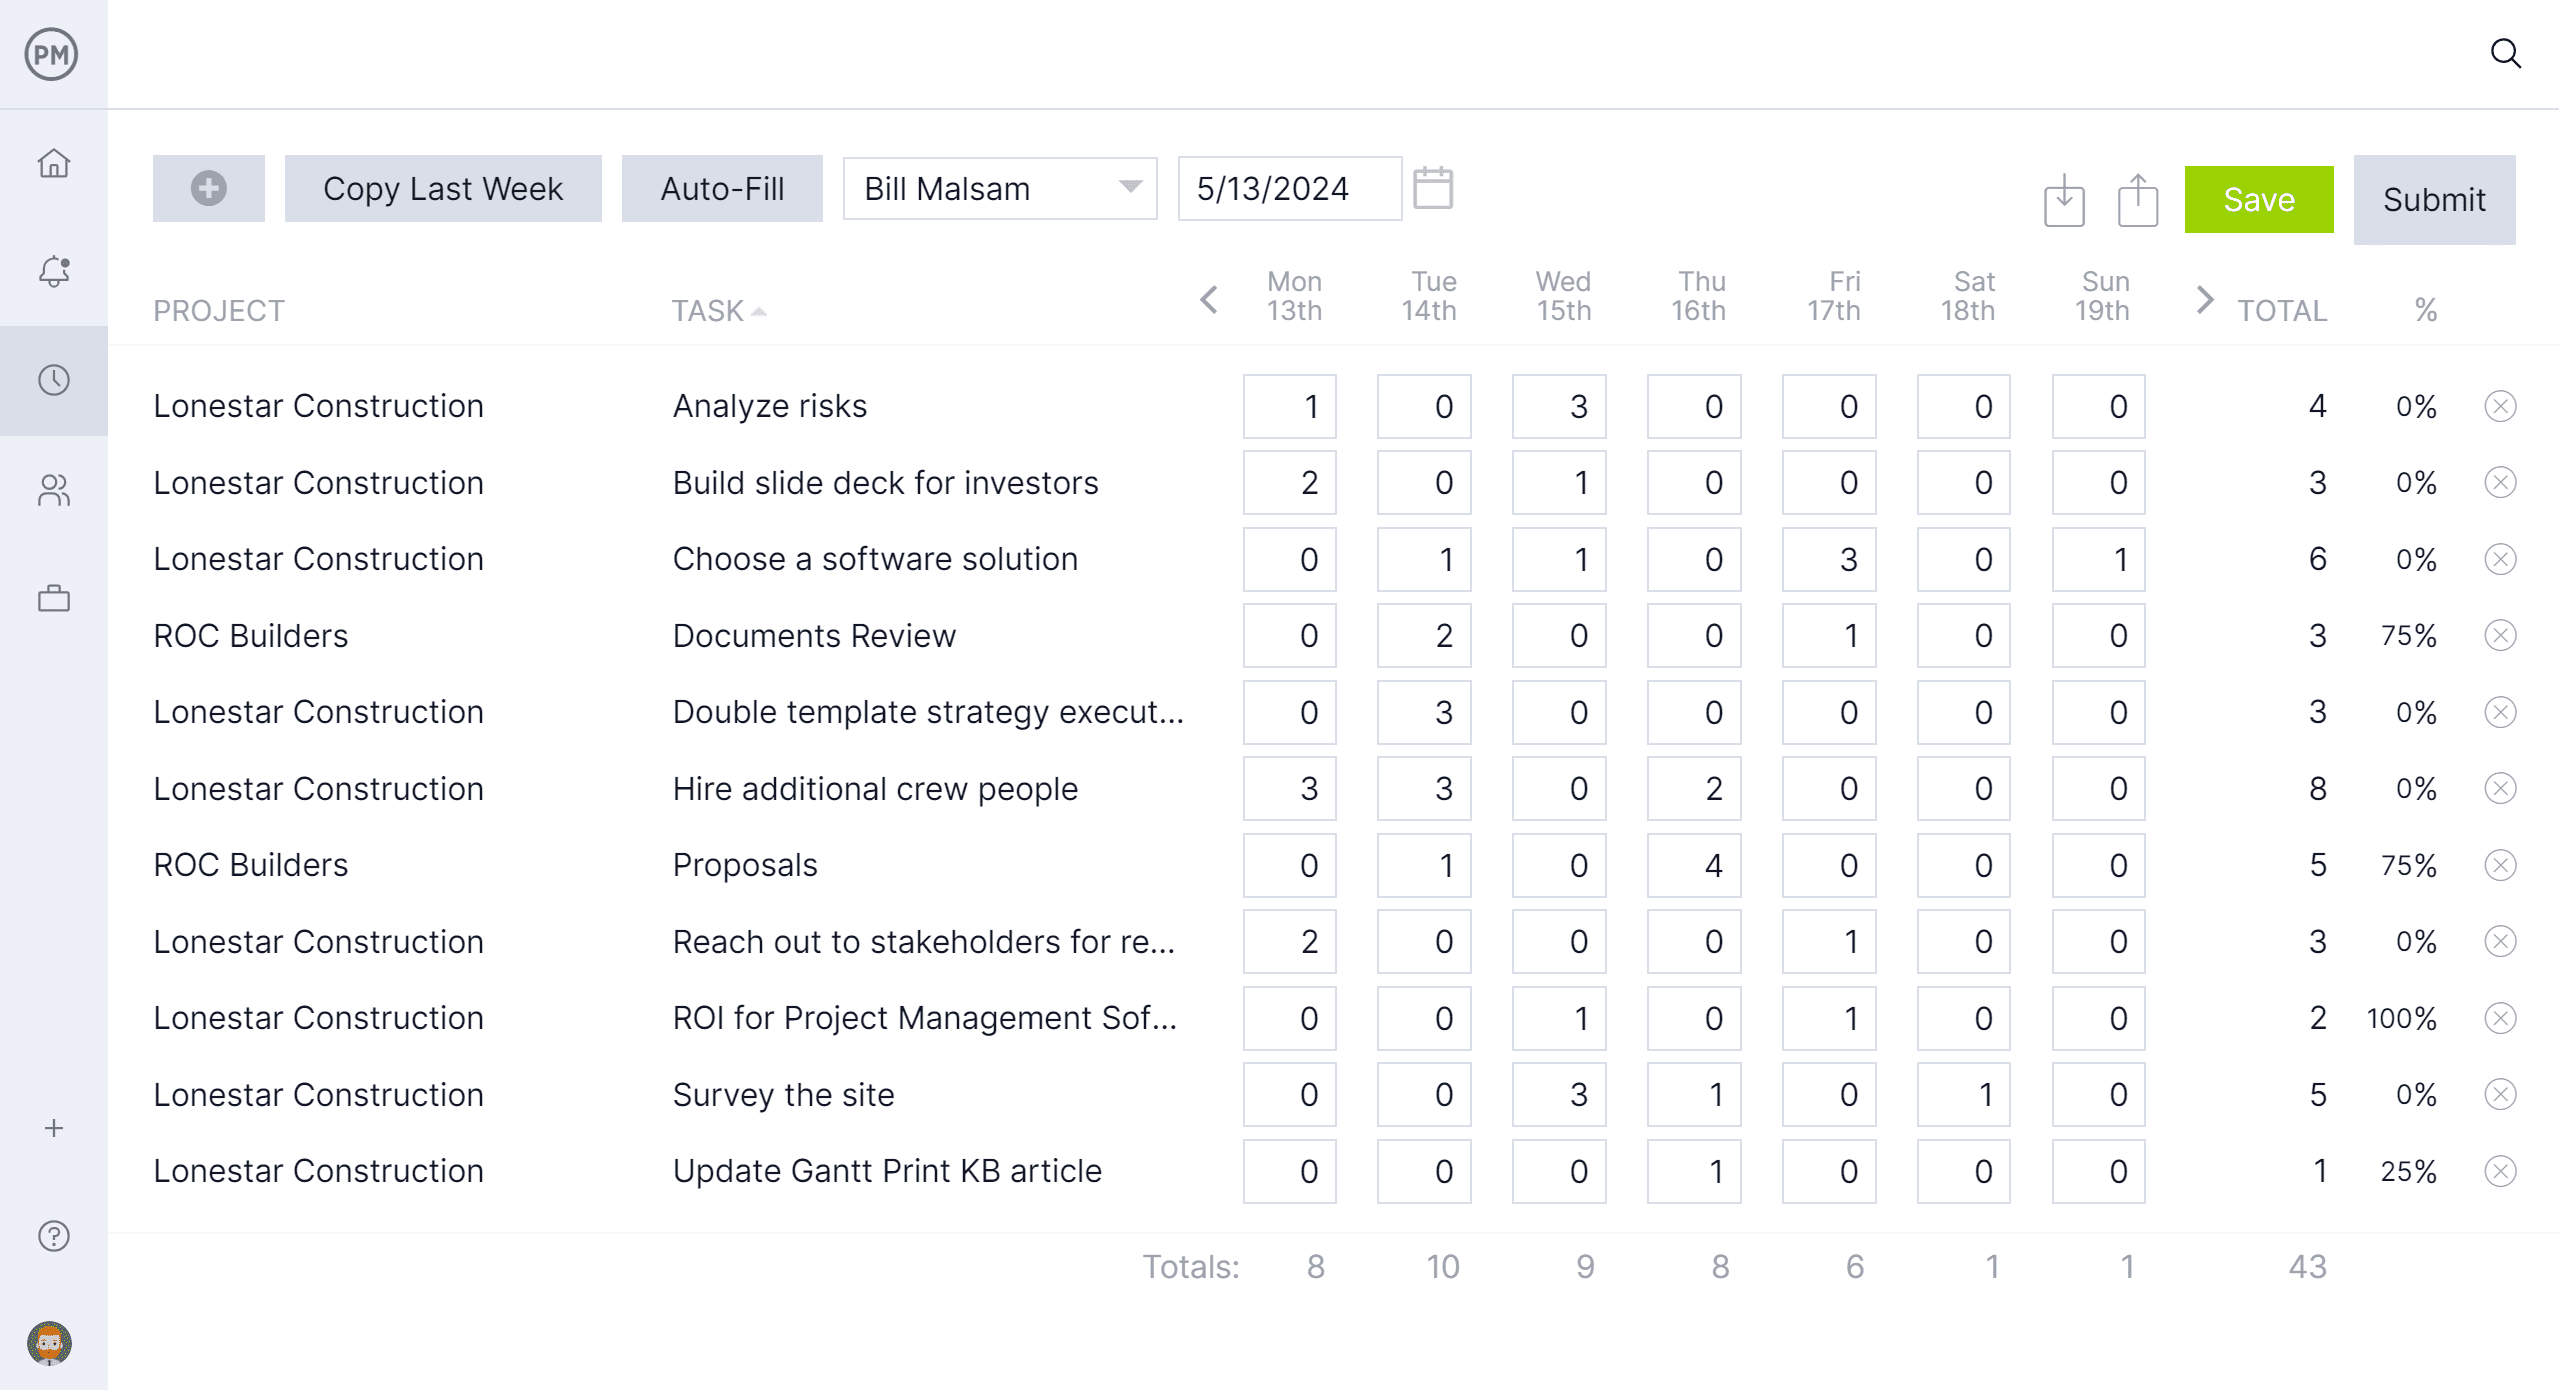
The WBS and Gantt charts in ProjectManager serve as foundational tools for real-time tracking by feeding structured task data directly into the platform’s live dashboards, customizable reports and secure timesheets. As tasks progress or deadlines shift in the Gantt chart, the dashboard instantly reflects updated KPIs such as task completion, budget usage and team performance. This ensures stakeholders always have an accurate snapshot of project health.
Meanwhile, the breakdown from the WBS allows reports to be tailored around specific phases, deliverables or resource groups, offering deeper insights. Timesheets align with this structure, letting team members log hours anywhere, anytime against precise WBS-defined tasks, which improves accuracy in both tracking and forecasting.
Related WBS and Gantt Chart Content
There’s much more to WBS and Gantt charts than we’ve covered in this blog post. For readers who care to further understand the topic, below are links to a handful of recent articles on Gantt charts vs. PERT charts and network diagrams, plus much more.
- 10 Gantt Chart Alternatives for Project Management
- How to Make a Gantt Chart: Steps, Tools & Tips
- Gantt Chart vs. PERT Chart vs. Network Diagram
- 18 Best Gantt Chart Software of 2025 (Free & Paid)
- Why Use a Gantt Chart in Construction Project Management
ProjectManager is online project and portfolio management software that connects teams whether they’re in the office or out in the field. They can share files, comment at the task level and stay updated with email and in-app notifications. Join teams at Avis, Nestle and Siemens who use our software to deliver successful projects. Get started with ProjectManager today for free.
