Scheduling is all about getting things done on time and within budget. It’s one of the most important aspects of planning for a project.
The most popular tool to schedule projects is the Gantt chart, which lets you create a visual timeline for your project. Finding the critical path on a Gantt chart helps you achieve your project goals faster and more efficiently. But before we learn how to identify the critical path in a Gantt chart, let’s start by defining what’s critical path in project management.
What Is the Critical Path?
The concept of critical path comes from the critical path method, a project planning and scheduling technique that uses a network diagram to represent project tasks, their expected start and end dates, duration and the order in which they’re meant to be completed.
One of the fundamental principles of the critical path method is that all projects consist of multiple, parallel sequences of tasks, known as paths, which are shown in a critical path diagram. The critical path of a project is the longest sequence of dependent tasks or activities and the amount of time it takes to complete them from beginning to end.
For example, in the critical path chart below, there are two task sequences (A,C,E) and (B,D,F). The (A,C,E) task sequence is longer in duration as these tasks take 37 days to be completed while tasks (B,D,F) take only 23, so the critical path of this project consists of tasks A, C and E.
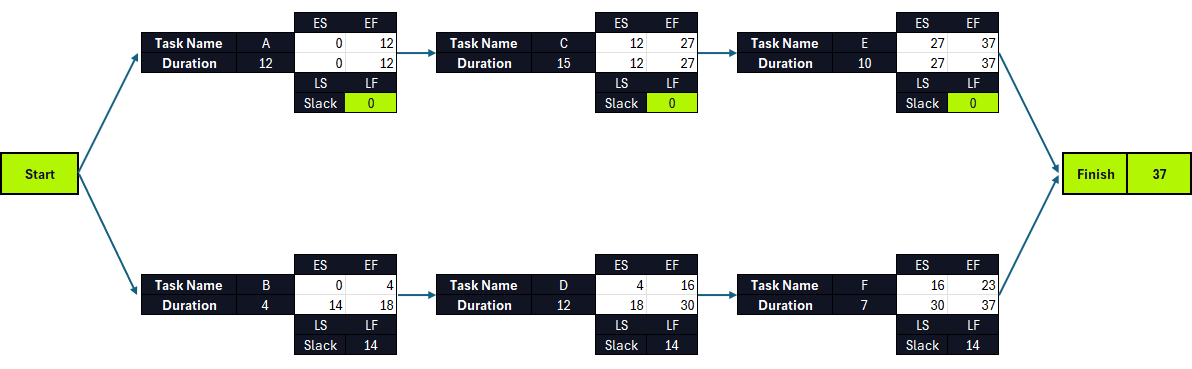
This critical path diagram template for Excel also shows the early start (ES), early finish (EF), late start (LS), late finish (LS) and slack values for each project task all of which are needed to calculate the critical path of a project.
However, while using a critical path diagram is an accurate method, it can be time consuming and prone to human error, so that’s why most project managers use Gantt chart software like ProjectManager, as it automatically identifies the critical path of a project.
ProjectManager is a cloud-based project management software that has multiple project views and allows anyone, anywhere to work how they want. ProjectManager’s online Gantt chart can link task dependencies, set milestones, allocate resources and make interactive project schedules. Get started with ProjectManager for free today.
What Is a Gantt Chart?
A Gantt chart is a bar chart that visualizes the project schedule from start to finish. The Gantt diagram has been a staple of scheduling and a fundamental feature of project management software.
The Gantt chart is divided into two parts. On the left side is a spreadsheet that lists the tasks, start and end dates, priority and more depending on the type being used. On the right side is the bar chart that reflects the information collected on the left side.
Get your free
Critical Path Template
Use this free Critical Path Template to manage your projects better.
Get the templateA Gantt chart is used during the planning stage of the project after all the tasks have been identified using a work breakdown structure (WBS). It’s commonplace to create the schedule on the Gantt with an early start time approach, which means each task starts right after the other ends, which helps maximize floating tasks or float time.
How to Display the Critical Path on a Gantt Chart
The critical path and Gantt charts fit hand-to-glove in project scheduling because the critical path outlines the sequence of tasks that could delay your project. To do so means you need to follow these four steps.
Now let’s dive into the process of using ProjectManager’s Gantt chart to show the critical path of a project.
1. List Project Tasks
Projec tasks are small sets of work that lead to your final deliverable. All the tasks required to complete your project must be listed in your project schedule. As noted above, this can be done with a WBS, which has the final deliverable on top and the tasks that lead there branching downwards. This provides you with a thorough list of tasks, activities and deliverables needed to complete the project.
To make a list of project tasks in ProjectManager, simply open the Gantt chart view and begin adding task names. You can also indent any dependent tasks or subtasks if needed.
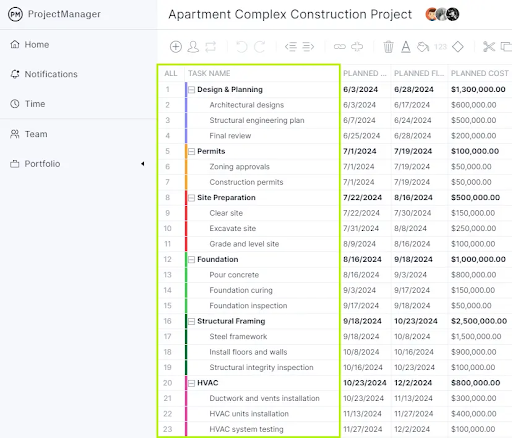
As noted above, a work breakdown structure helps identify project tasks and group them into sequences or work packages. This provides you with a thorough list of tasks, activities and deliverables needed to complete the project.
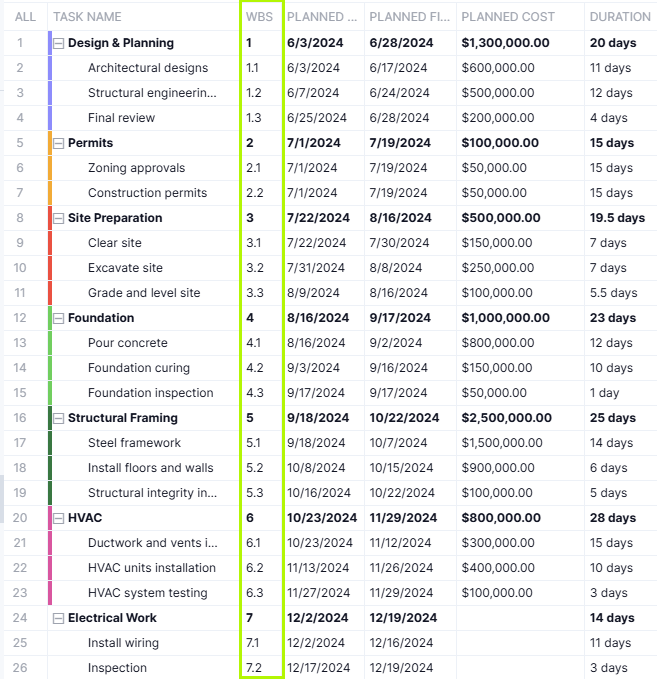
ProjectManager’s Gantt chart has a WBS column, which indicates the hierarchy of tasks and which of them are dependent on each other and belong to the same task sequence. For example, according to the work breakdown structure numerals, the task “Final review” (1.3) is nested under “Design and Planning” (1).
2. Set Duration and Due Dates for Project Task
The duration is the time it takes to complete each of the tasks you collected in step one. Adding these together will give you the full project duration. There are many ways to estimate time. This includes looking up historical data for projects that are similar to the one you are currently managing to meeting with your team, stakeholders and experts to get their opinions.
There are many ways to estimate time. This includes looking up historical data for projects that are similar to the one you are currently managing to meeting with your team, stakeholders and experts to get their opinions.
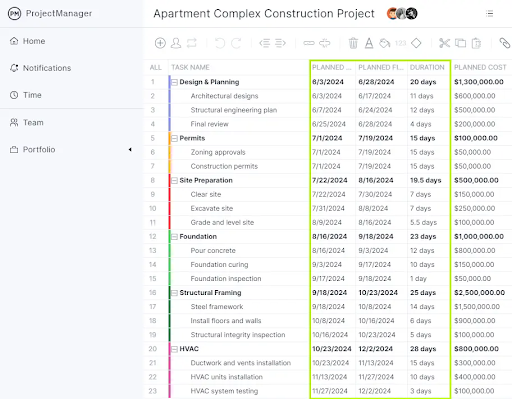
ProjectManager’s Gantt chart has columns to enter the duration and planned start and end dates for project tasks. It also has fields to enter the actual duration, start and end dates and of tasks so that users can compare their estimates against the actual performance of their project.
3. Identify and Link Task Dependencies
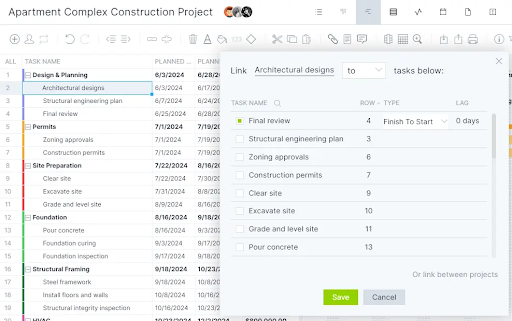
There are four types of task dependencies on a Gantt chart: finish-to-start, finish-to-finish, start-to-start and start-to-finish. Advanced Gantt chart software like ProjectManager makes it easy to link task dependencies together in a few clicks. To do so, simply select a task, right-click it and then select “Link tasks.” A pop up will appear, which will let you choose one of the types of task dependencies and will show the lag or slack of each task.
Being able to identify dependencies in your project can help you to avoid bottlenecks as you can plan ahead and allocate resources (people, materials, equipment, etc.) as needed to keep the project on schedule.
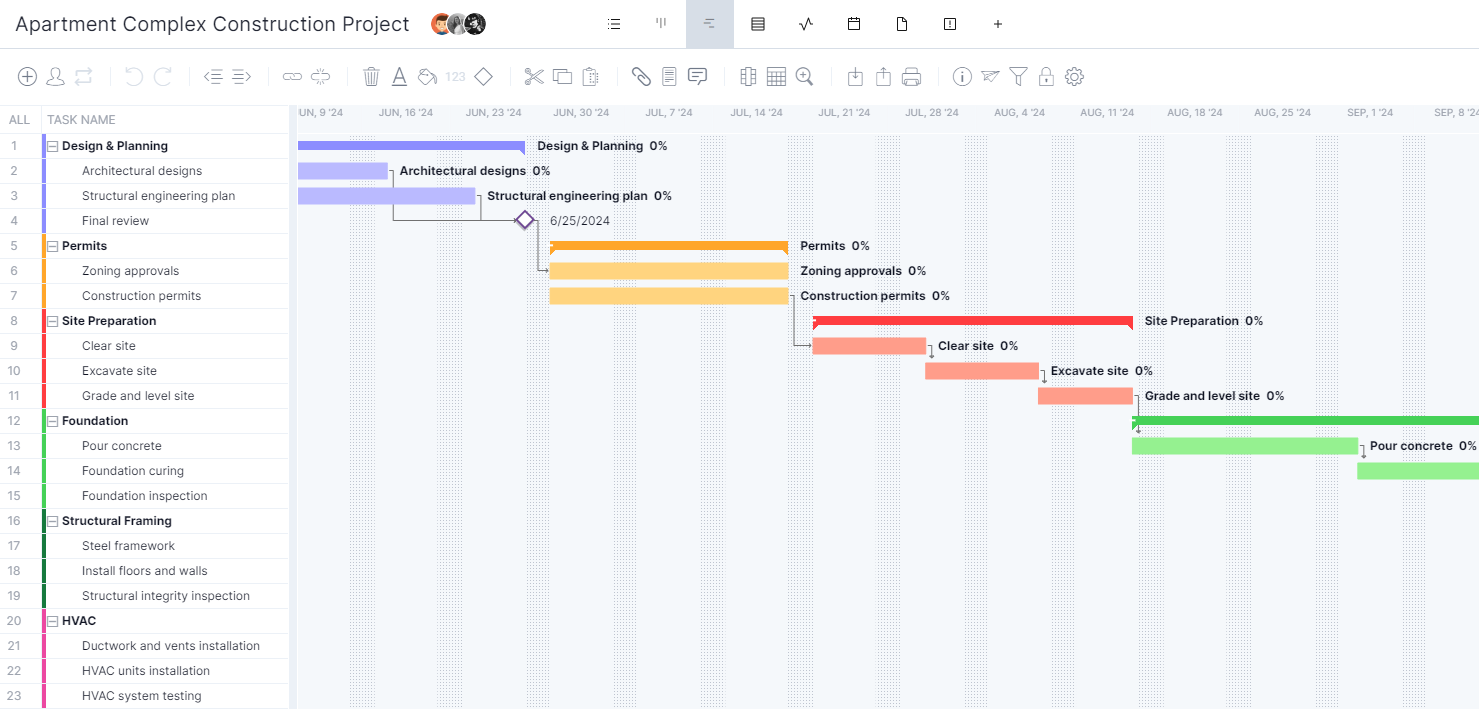
Once you set task dependencies using ProjectManager’s Gantt chart, the project timeline will use arrows to link dependent tasks as shown in the image below.
4. Calculate the Float of Tasks and Identify the Critical Path
In project management, the term slack, lag or float refers to the amount of time a task can be delayed without affecting the project’s overall completion date. This happens in projects in which there are longer task sequences that provide “wiggle room” for the completion of shorter task sequences.
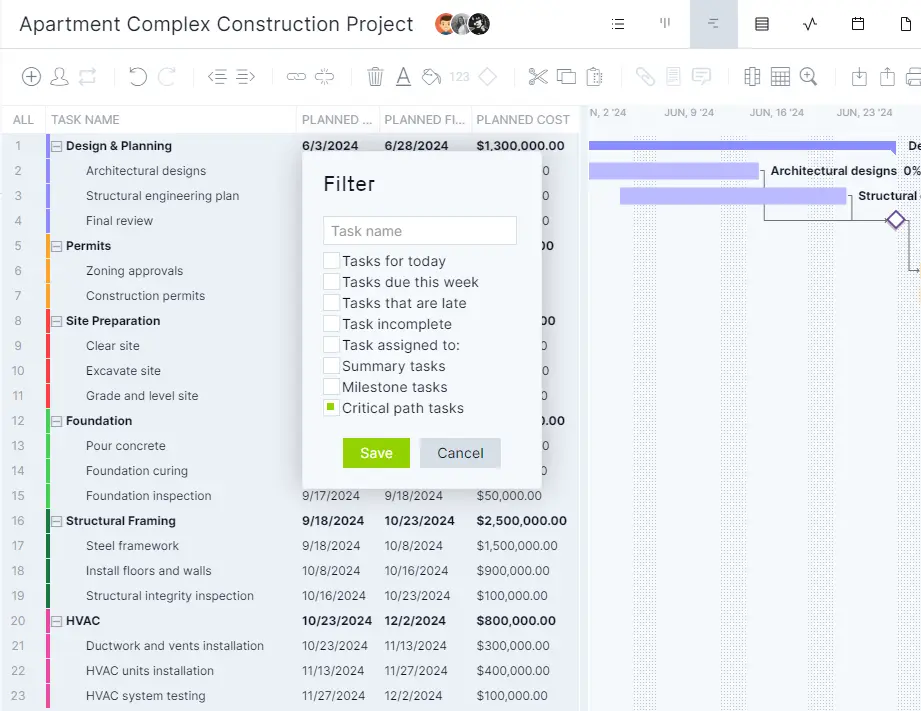
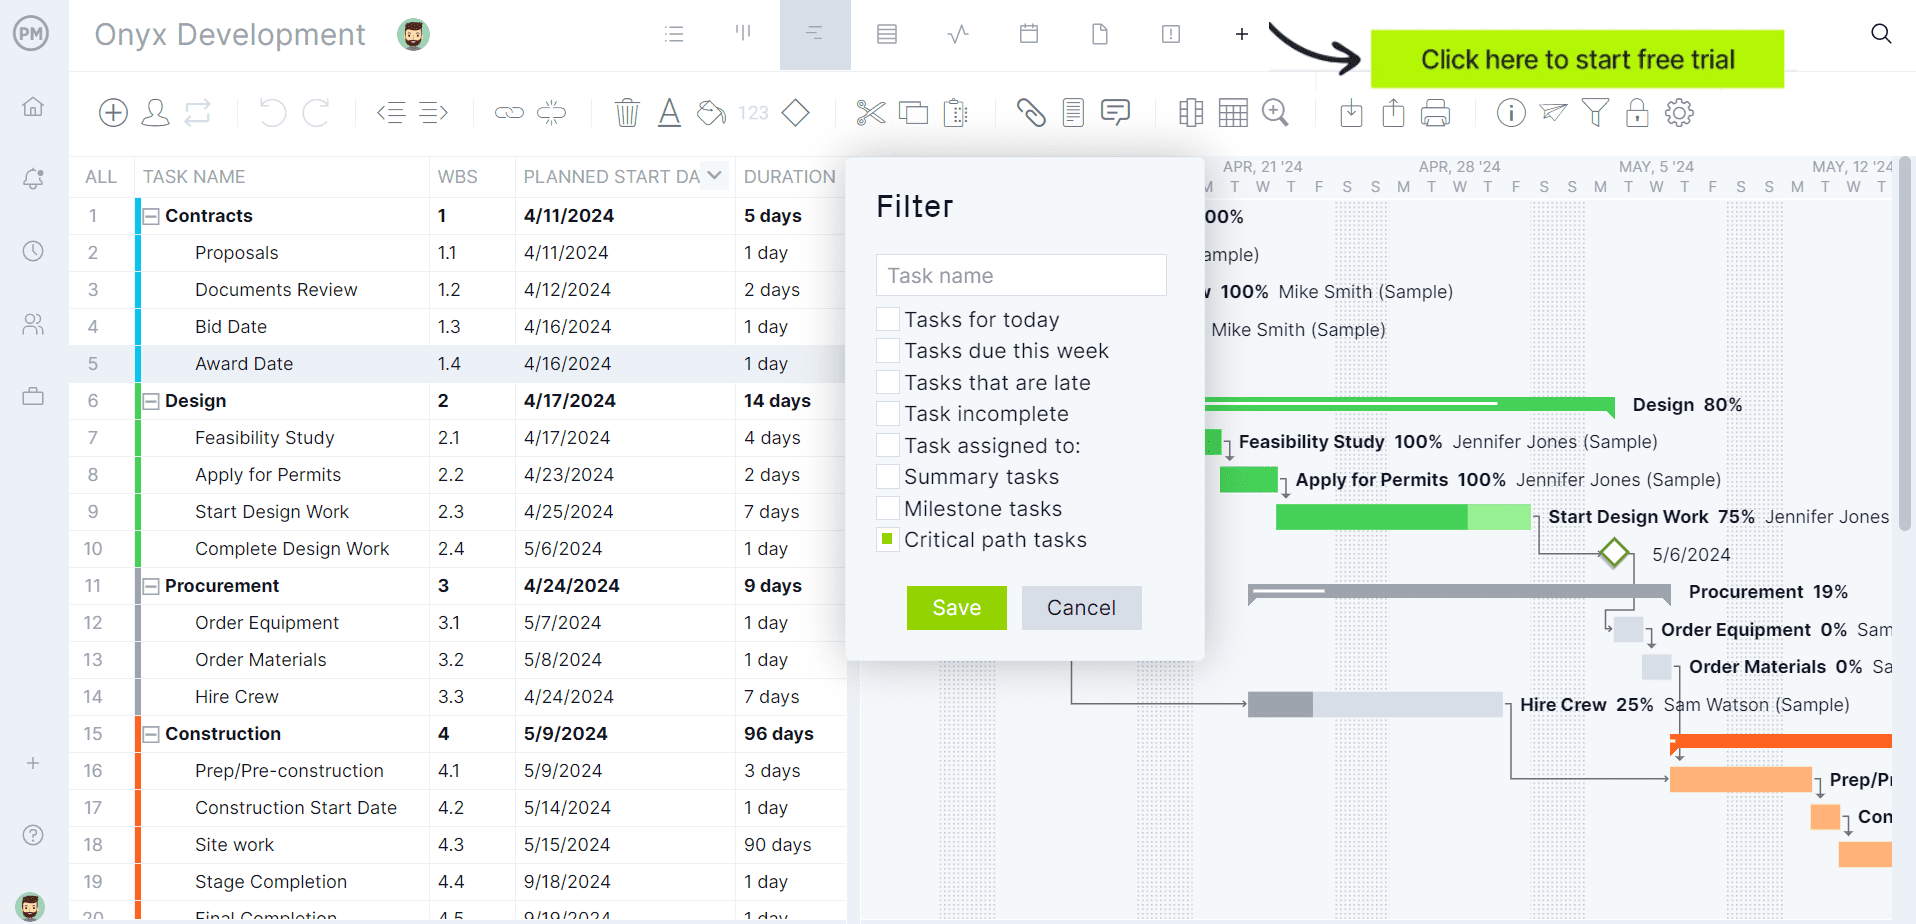
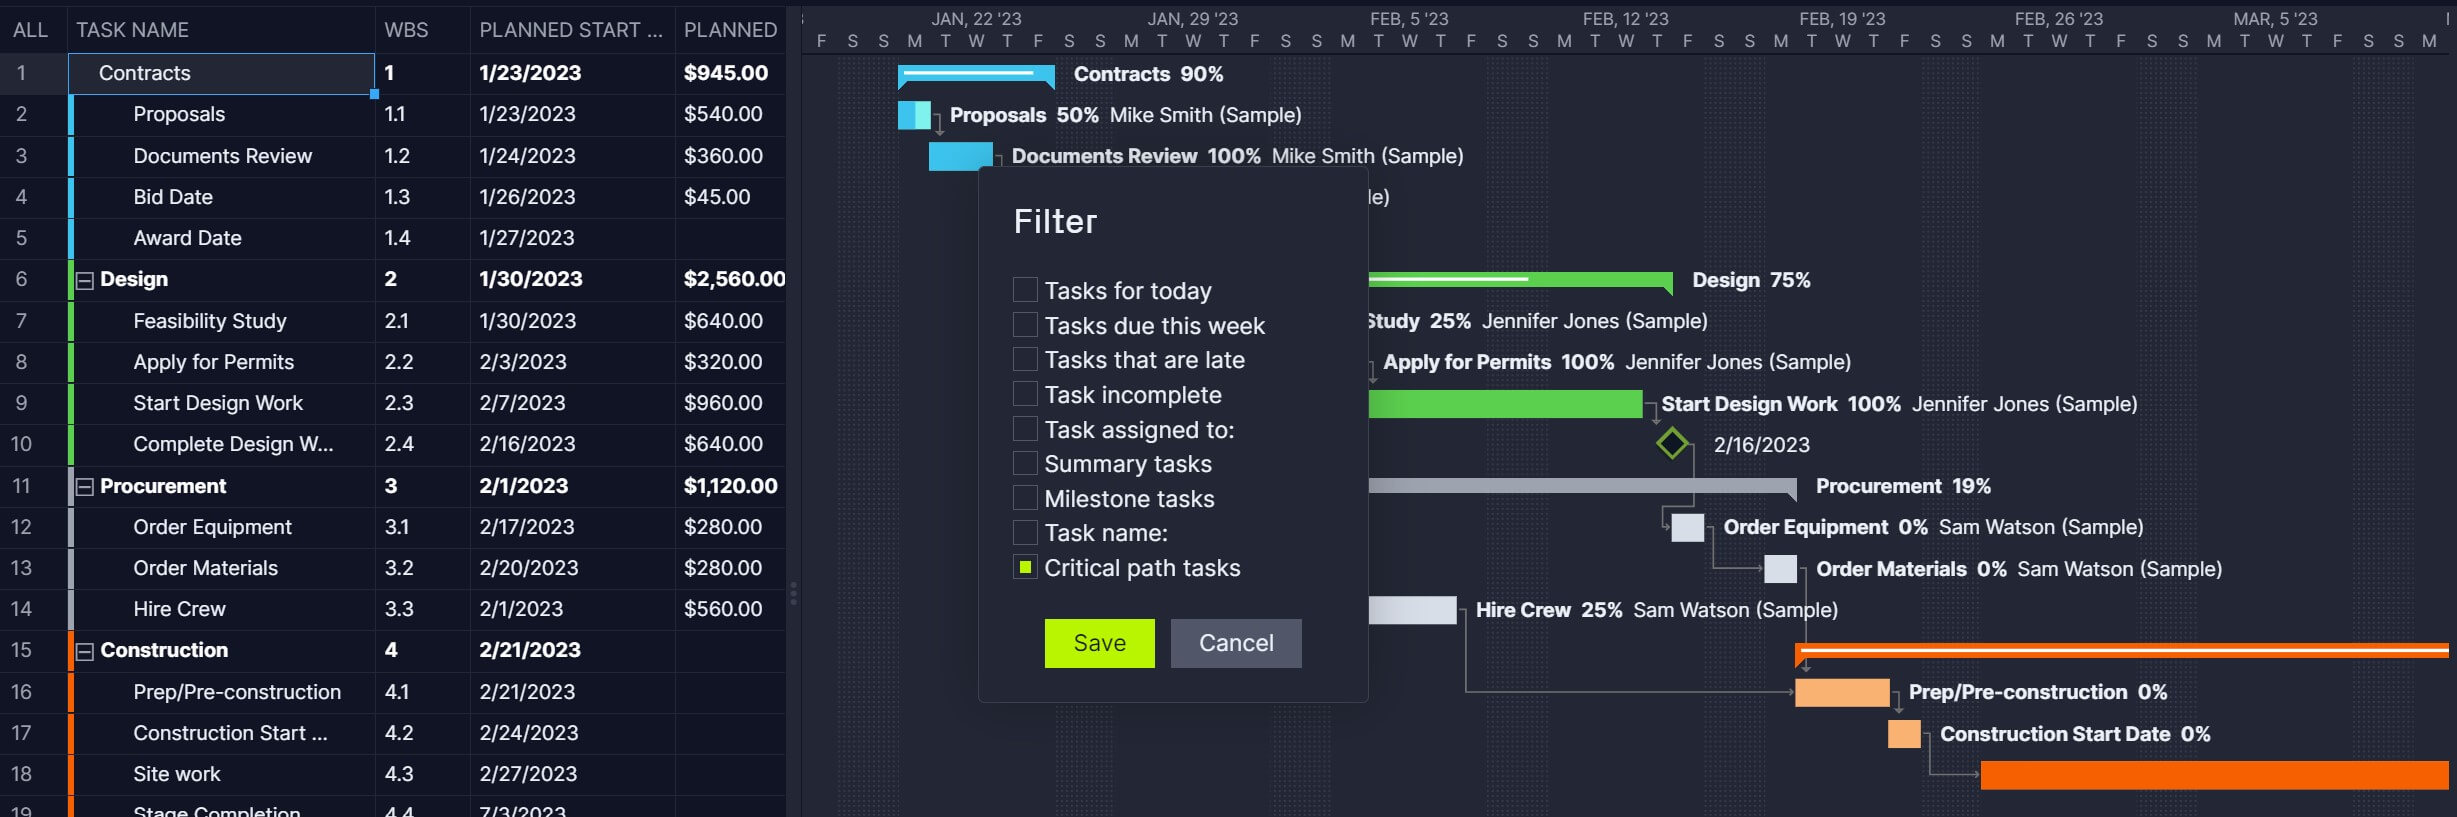
Tasks in the critical path don’t have slack or lag, which allows project managers to identify them using a critical path diagram and CPM calculations. However, this is not needed when using ProjectManager, as the software automatically calculates the slack of each task and highlights the critical path tasks.
With ProjectManager, all you need to do to find the critical path in a Gantt chart is to simply list project tasks, enter their duration and due dates, link task dependencies together and then filter for critical path tasks with one click.
Step 5. Add Project Milestones
While they’re not necessary to identify the critical path in a Gantt chart, project milestones help further visualize the elements that make up the critical path of the project.
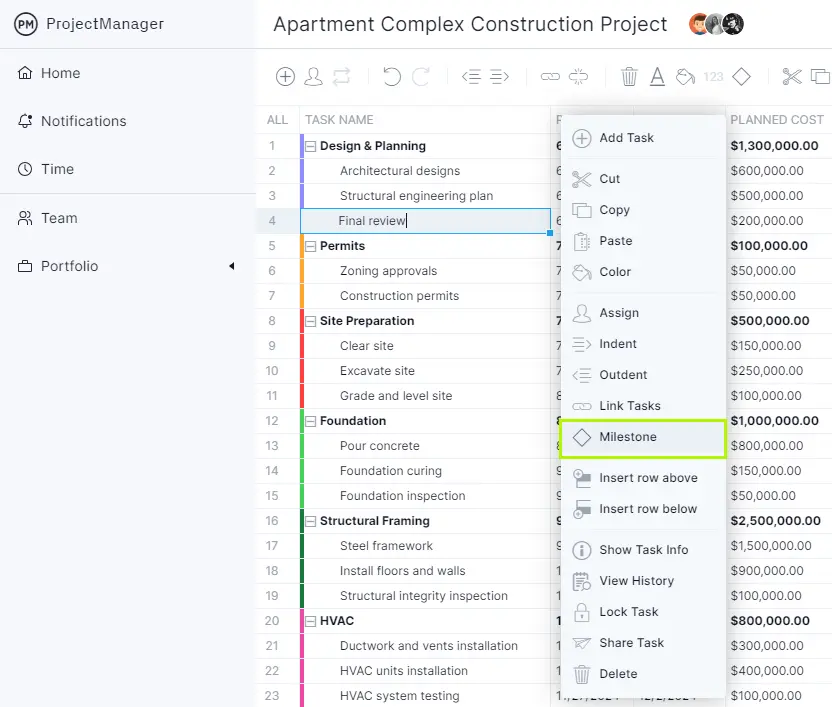
Project milestones are important dates that indicate the end of one project phase and the beginning of the next. You can also add the deliverable items to the Gantt chart. Then, find the longest path of sequence tasks or set of links from start to the project completion and that’s your critical path.
Benefits of Identifying the Critical Path in a Gantt Chart
There are many advantages from using Gantt chart software like ProjectManager instead of manually implementing the critical path method to identify the critical path of projects. Here are some of them.
- Automatically calculates task durations and dependencies without manual diagramming.
- Adjusts the critical path instantly when timelines or tasks change.
- Displays the critical path clearly in a more interactive format than a traditional CPM network diagram.
- Minimizes human error in sequencing and duration calculations.
- Easily model “what-if” scenarios to see impact on project timelines by simply adjusting the project scheduling data.
- Some Gantt chart software like ProjectManager integrates resource allocation, project budgeting, cost tracking and other important features with critical path analysis.
- Allows teams to view and update the critical path in one shared platform.
Free Critical Path Gantt Chart Template
If you want to try that on your own, ProjectManager has dozens of free templates that help with every aspect of project management. Try the free Gantt chart template.
If you choose to use the free ProjectManager in-app template, you’ll be connected to a powerful project management software that helps you organize your work and execute it more efficiently.
More Free Related Project Management Templates for Excel
If you’re not ready to start identifying the critical path of your projects in a Gantt chart, you can still use one of our free project management templates for Excel, Word, Google Sheets or Google Docs.
Critical Path Template
This critical path template is ideal for making a task list, identifying task dependencies, indicating the duration of tasks and calculating their expected start and end dates.
Gantt Chart Template
While not as robust as Gantt chart software, this Gantt chart template for Excel allows project managers to create a project schedule and visualize it using a bar chart timeline that’s automatically generated in Excel based on project tasks’ due dates and duration.
ProjectManager’s Gantt Chart Automatically Calculates the Critical Path
Using the IT project plan free in ProjectManager has many advantages to a standalone template that takes time to update and is cut off from the rest of your project management tools. Our interactive Gantt chart does everything a Gantt chart is famous for, from organizing tasks, setting milestones, linking dependencies and viewing your entire project on a visual timeline.
Lay Out Your Entire Project on Gantt Charts
As mentioned above, once you have your schedule in the Gantt chart, just filter for the critical path. That’s it. There are no complicated equations or calculations necessary. Once you have your schedule and budget completed in the Gantt, you can then set a baseline. This captures your plan and uses it to compare to your actual progress and tracks your progress in real time.
Work With Your Team
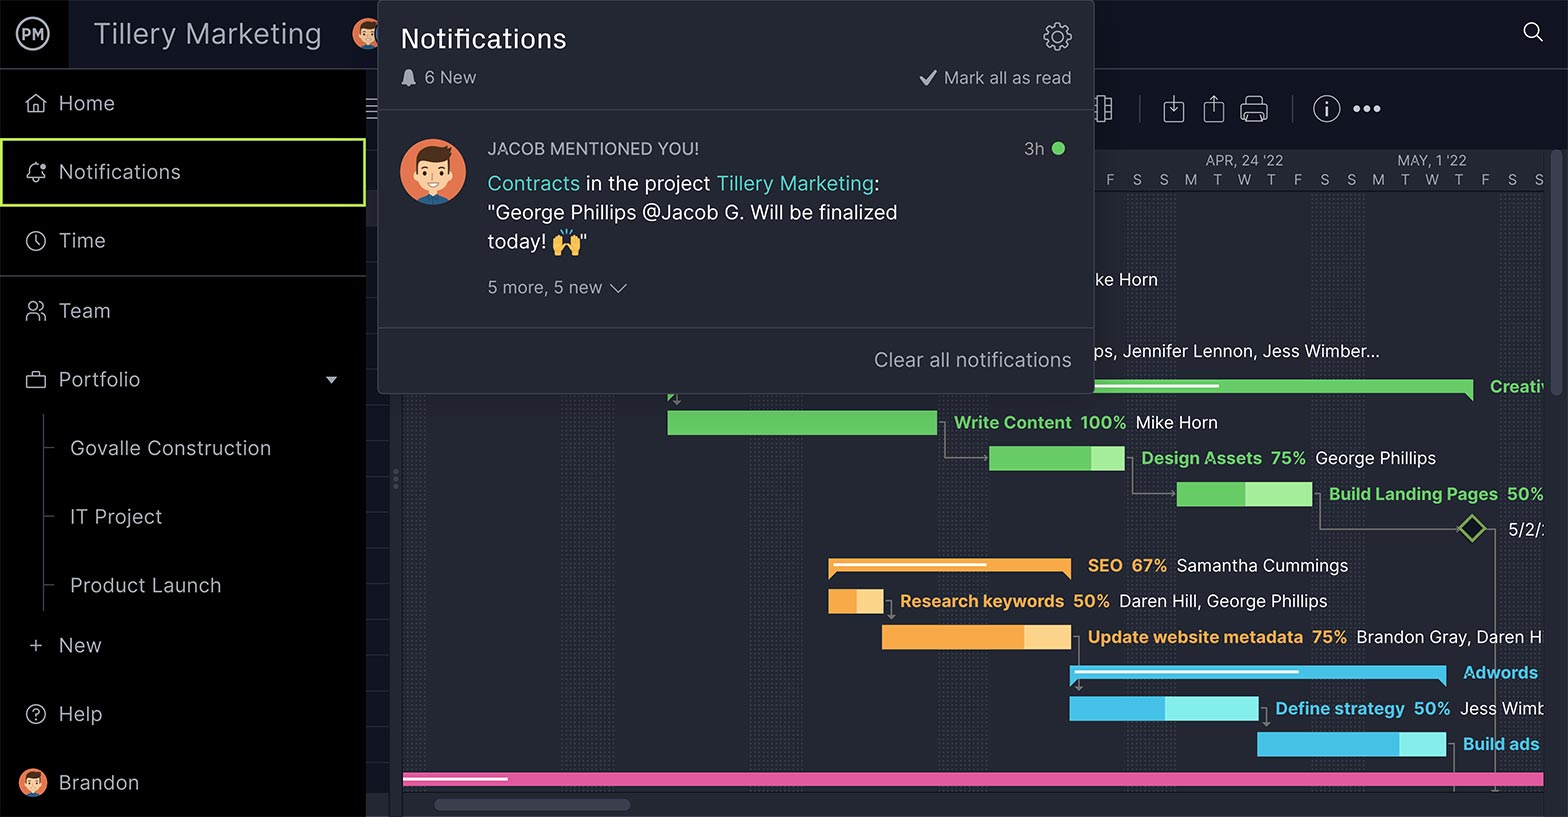
ProjectManager turns your Gantt chart a collaborative platform. You can attach files and documents on individual tasks. Assigned team members can add comments and communicate with others on the team no matter where they are. Even if someone on the project team isn’t assigned to the task, just tag them and they’re brought into the chat. Email notifications and in-app alerts keep you always updated.
Track Progress in Real-Time
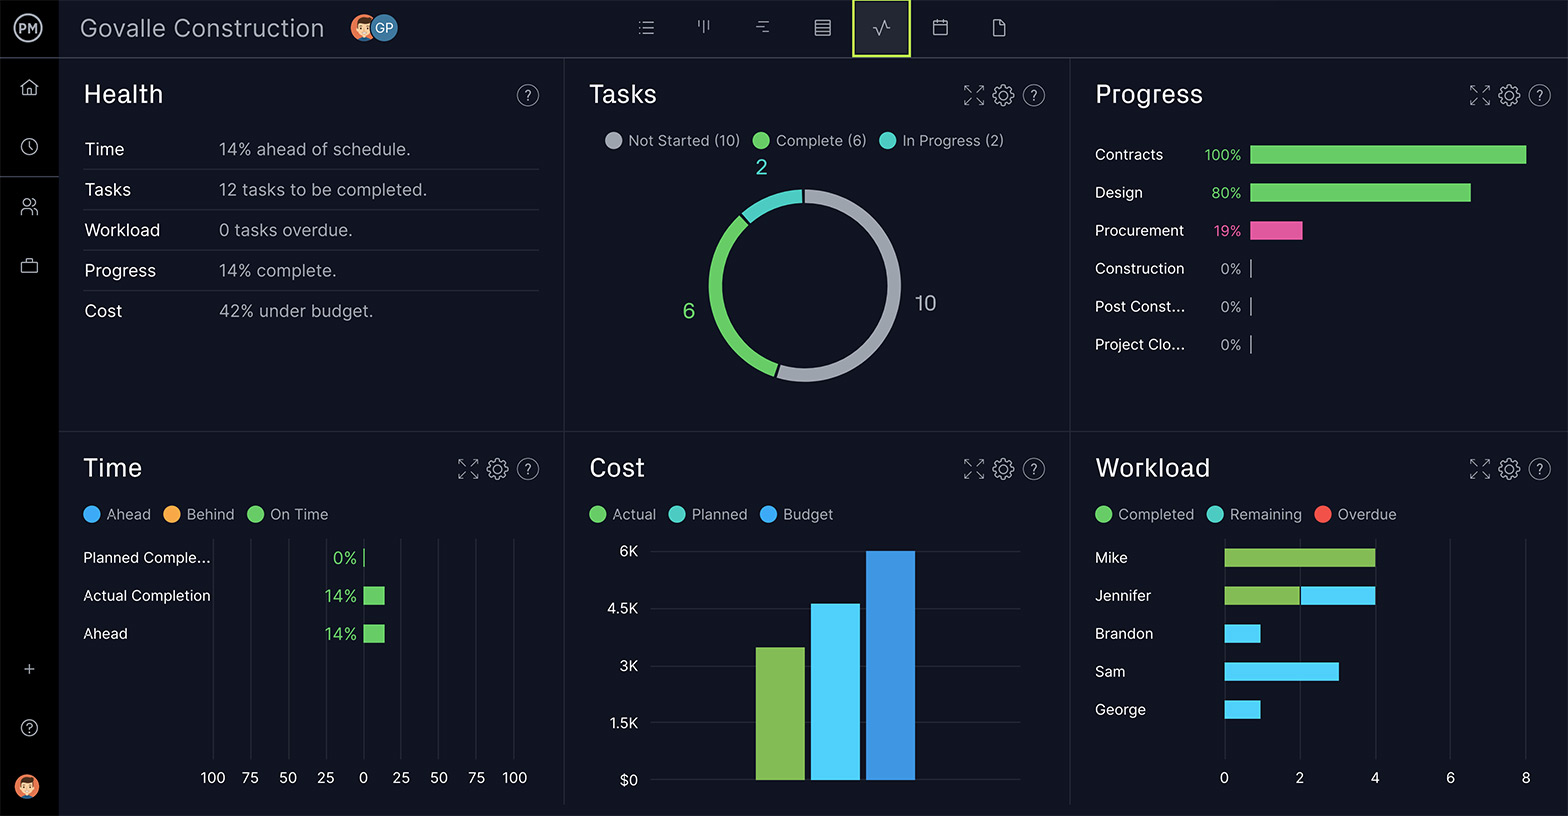
You can further track the progress of your project on the real-time dashboard, which is fully integrated with the Gantt chart. When tasks are updated, the dashboard captures that data and makes the calculations automatically. Then displays the results in easy-to-read graphs and charts showing time, cost, workload and more. You don’t have to spend your valuable time configuring our live dashboard like with inferior software. It’s up and ready to go when you are.
Related Gantt Chart Content
We have created dozens of blogs, templates and guides about project management. Here’s some related content related to Gantt charts.
- ¿Cómo ver la ruta crítica en un diagrama de Gantt?
- Best Gantt Chart Software (Free & Paid)
- Gantt Chart vs. PERT Chart vs. Network Diagram: What Are the Differences?
- Gantt Chart Dependencies: Understanding Task Dependency Types
- How to Make a Gantt Chart In Excel Step-By-Step
- How to Make a Gantt Chart in PowerPoint (Template Included)
- How to Make a Gantt Chart in Google Sheets (Template Included)
ProjectManager is award-winning hybrid work management software. See why over 35,000 professionals are using our tool to connect and succeed, no matter if they work in a traditional, agile or hybrid environment. Get started for free with ProjectManager today!
