



Manufacturing operations produce data constantly. Machine cycle times, defect rates, labor hours, material consumption, maintenance logs, production run counts. Every shift generates information that could be used to run the operation more efficiently. Most of it does not get used. It sits in disconnected systems, spreadsheets maintained by individual supervisors and reports that take hours to compile and are outdated by the time they reach the plant manager.
A manufacturing dashboard cuts through that noise. It takes the metrics that matter most (cost against budget, production output against targets, equipment utilization, task status across the floor) and presents them in a single view that can be read in a minute and acted on immediately. The goal is not more reporting. It is less time looking for the information you need to make decisions and more time making them.
We put together five free manufacturing dashboard templates for Excel that cover the performance data manufacturing managers need most, from production cost tracking to equipment and asset management. Each one is free to download and ready to adapt for your facility.
1. Manufacturing Budget Dashboard for Excel
Production costs are rarely static. Raw material prices fluctuate, labor overtime accumulates, machine downtime drives up per-unit costs and rework on defective output eats into margins that were already thin. By the time a cost variance shows up in a monthly financial report, the decisions that caused it were made weeks ago. A budget dashboard brings that visibility forward so cost performance is visible while there is still time to correct it.
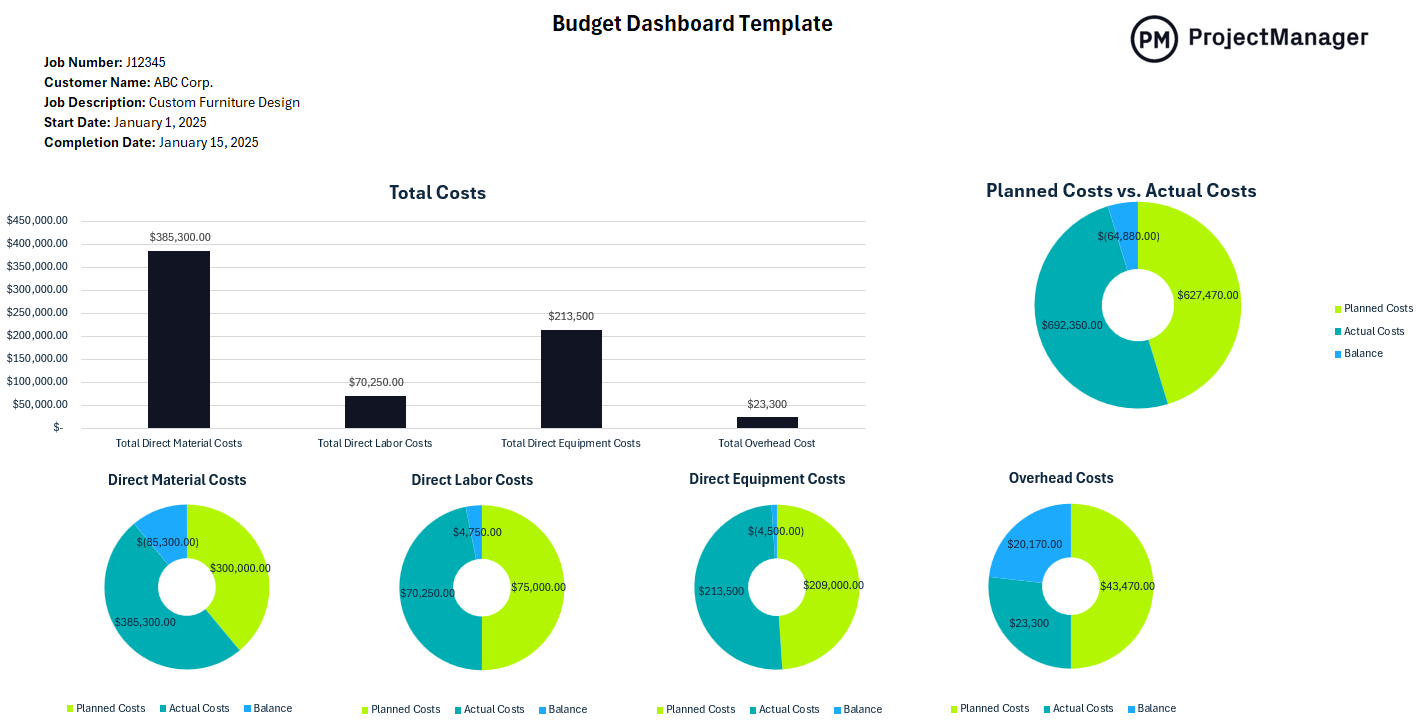
This Excel dashboard tracks planned versus actual costs across production categories (labor, materials, overhead, maintenance and quality) with variance calculations that immediately flag where spending is running ahead of plan. Summary charts give the plant manager and finance team a visual read on cost performance across the period, while the line-item breakdown supports the deeper investigation that follows when a variance is significant enough to require explanation or corrective action.
The right tool for production managers, plant controllers and operations leaders who need a regular read on manufacturing cost performance and a format they can use in weekly reviews without spending an hour pulling numbers from different systems.
2. Manufacturing Project Dashboard for Excel
Capital projects, new product introductions, facility upgrades, process improvement initiatives. Manufacturing operations run projects alongside production, and those projects carry their own schedule, budget and milestone commitments that need to be tracked separately from daily operational performance. A project dashboard gives everyone involved the same view of where a manufacturing project stands without requiring a status meeting to assemble the picture.
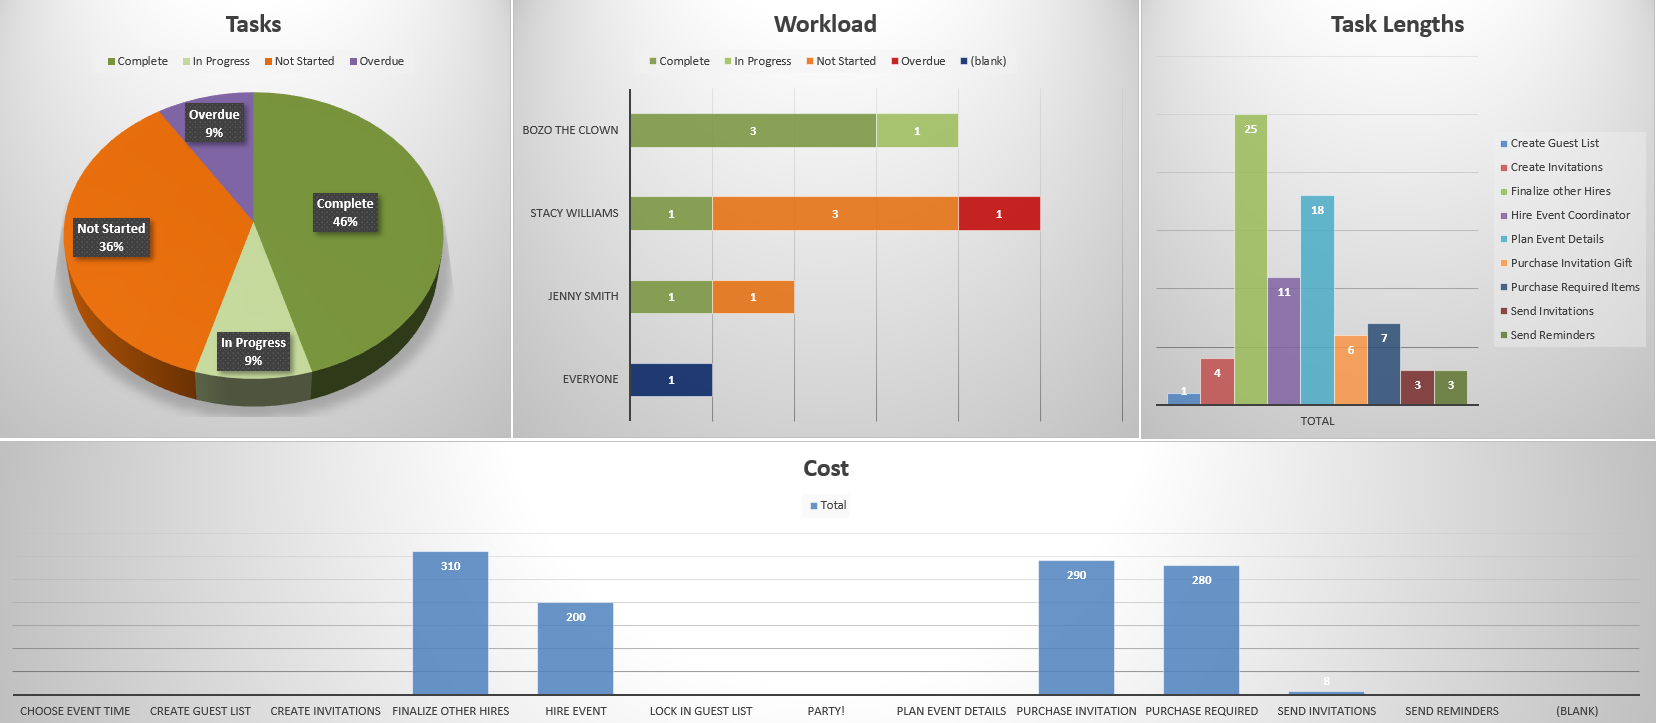
This Excel dashboard covers the key dimensions of project health for manufacturing initiatives: schedule progress against the baseline, budget performance, milestone status, deliverable completion by phase and an open issues summary. Updated weekly and shared at project reviews, it becomes the single reference point for project status, replacing the time spent on reporting with time spent on decisions about what to do when the project is off track.
Most useful for manufacturing engineers, project managers and operations leaders running capital projects, production line changeovers, new equipment installations or any initiative with defined milestones and a budget that needs to be tracked against a plan.
Get AI-Powered Manufacturing Dashboards: No Manual Updates Required
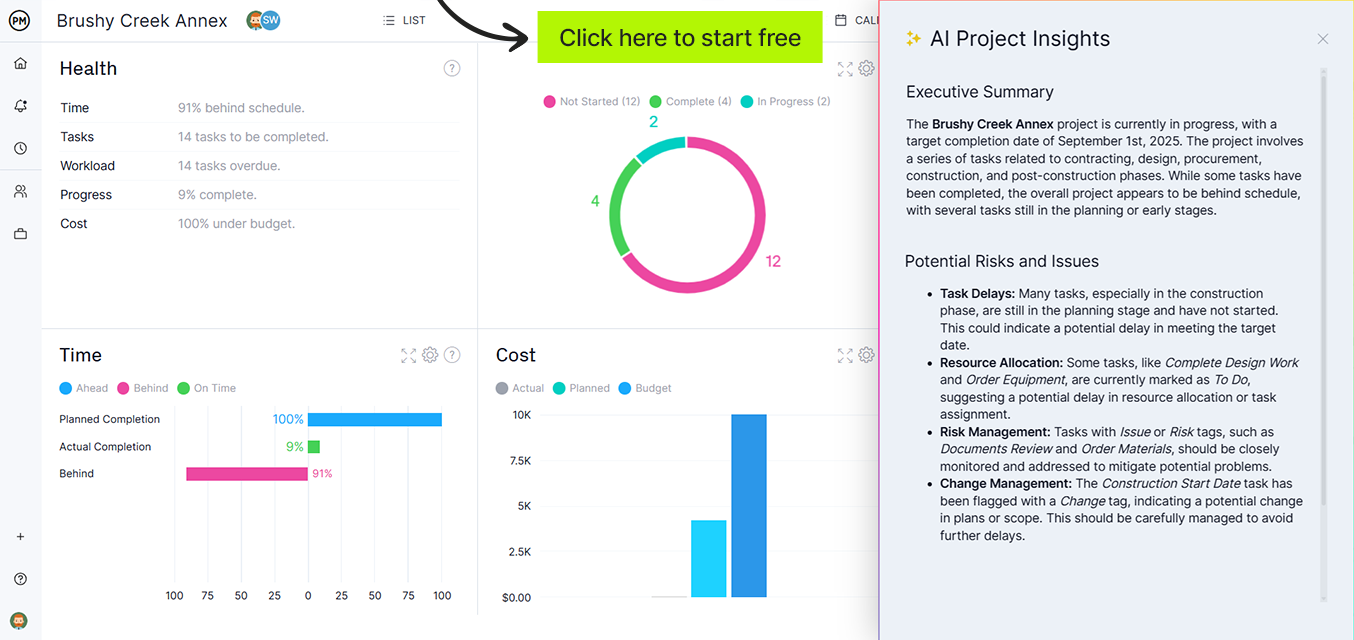
ProjectManager‘s dashboards update in real time as your team executes: tasks completed, hours logged, costs recorded, with no manual data entry required. AI-powered insights surface production trends and performance risks automatically so you always have the current picture the moment you need it. Try it free for 30 days.
3. Manufacturing KPI Dashboard for Excel
The metrics that define manufacturing performance are well-established: overall equipment effectiveness, first-pass yield, scrap and rework rates, on-time delivery, cycle time, throughput and labor productivity. The challenge is not knowing which KPIs matter. It is tracking them consistently, making them visible to the right people and using them to drive decisions rather than just documenting what already happened. A KPI dashboard turns data collection into operational intelligence.

This Excel dashboard tracks your selected manufacturing KPIs against target values with visual indicators that immediately show which metrics are on track, which are approaching threshold and which need immediate attention. You define the KPIs that matter for your operation (productivity, quality, safety, delivery performance) and the dashboard surfaces performance against target at a glance. The trend view shows whether each metric is moving in the right direction over time, which is often more actionable than a single-period reading.
Particularly useful for plant managers and continuous improvement teams who need to track leading indicators of operational health, run regular performance reviews with production supervisors or report manufacturing metrics to senior leadership in a format that is quick to read and easy to act on.
4. Manufacturing Task Tracker Dashboard for Excel
On the manufacturing floor, work orders, maintenance tasks, quality checks, changeovers and safety inspections are all running simultaneously across multiple departments and shifts. Knowing which tasks are complete, which are in progress, which are blocked and which are overdue is how supervisors keep production moving, and without a centralized view, getting that picture requires walking the floor and asking, which takes time that could be spent solving problems instead of finding them.
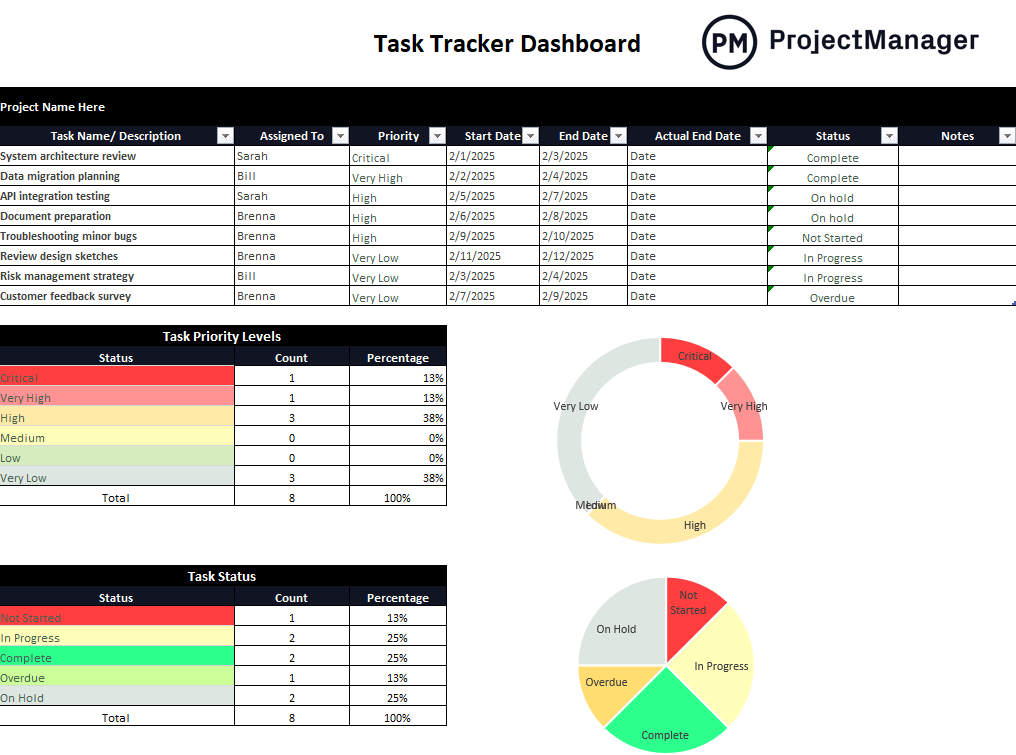
This Excel dashboard logs tasks by department, work center or shift with columns for owner, start time, due date, status and completion percentage. Summary charts show overall task completion across the operation and flag overdue items that need immediate attention. Updated at shift handover or daily stand-up, it gives supervisors and plant managers a current view of work status across the facility without relying on verbal updates that get lost between shifts.
Most useful for production supervisors and operations managers coordinating tasks across multiple departments, shifts or work centers where the volume of parallel work makes informal tracking unreliable and gaps between shifts create communication breakdowns.
5. Manufacturing Asset Management Dashboard for Excel
Equipment downtime is one of the most expensive problems in manufacturing and one of the most preventable. Unplanned downtime happens for two main reasons: maintenance was deferred because no one was tracking the schedule, or a failure occurred that could have been caught with basic monitoring. An asset management dashboard addresses both. It makes the maintenance schedule visible and tracks equipment status so the information exists to act on before a breakdown takes a production line offline.
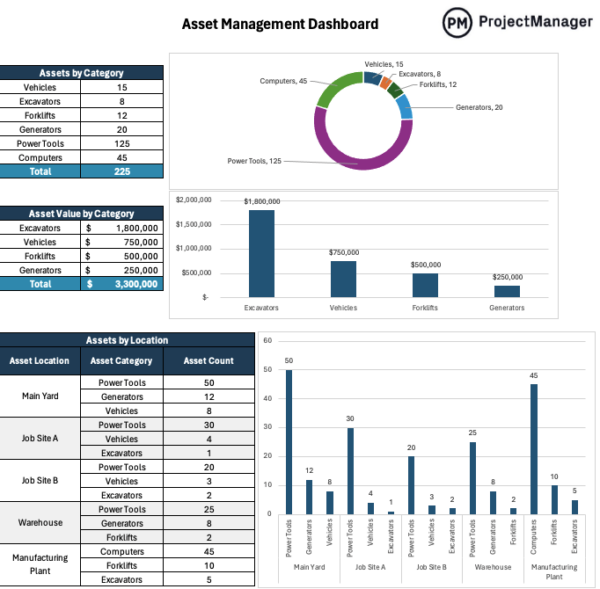
This Excel dashboard tracks your production equipment and plant assets with fields for asset name, type, location, assigned department, current operational status, utilization rate and preventive maintenance schedule. The summary view shows which assets are running, which are down for maintenance or repair and which are approaching a scheduled service interval, giving the maintenance manager and production planner the information they need to coordinate planned downtime rather than responding to unplanned failures.
Best used by maintenance managers and operations teams in facilities where equipment reliability directly drives production output, and where the cost of unplanned downtime (in lost production, emergency repair costs and schedule recovery) makes proactive asset tracking one of the highest-return operational improvements available.
Manage Manufacturing Projects With Live Dashboards in ProjectManager
Excel dashboards give you a snapshot updated as often as someone updates the file. For fast-moving manufacturing environments, that lag matters. ProjectManager gives operations and project teams a live dashboard that reflects current task status, budget consumption and schedule progress without requiring manual data entry to stay current. When something changes on the floor, the dashboard reflects it. Which means decisions are made on accurate information rather than last week’s numbers.
Track Production Projects and Budgets in Real Time
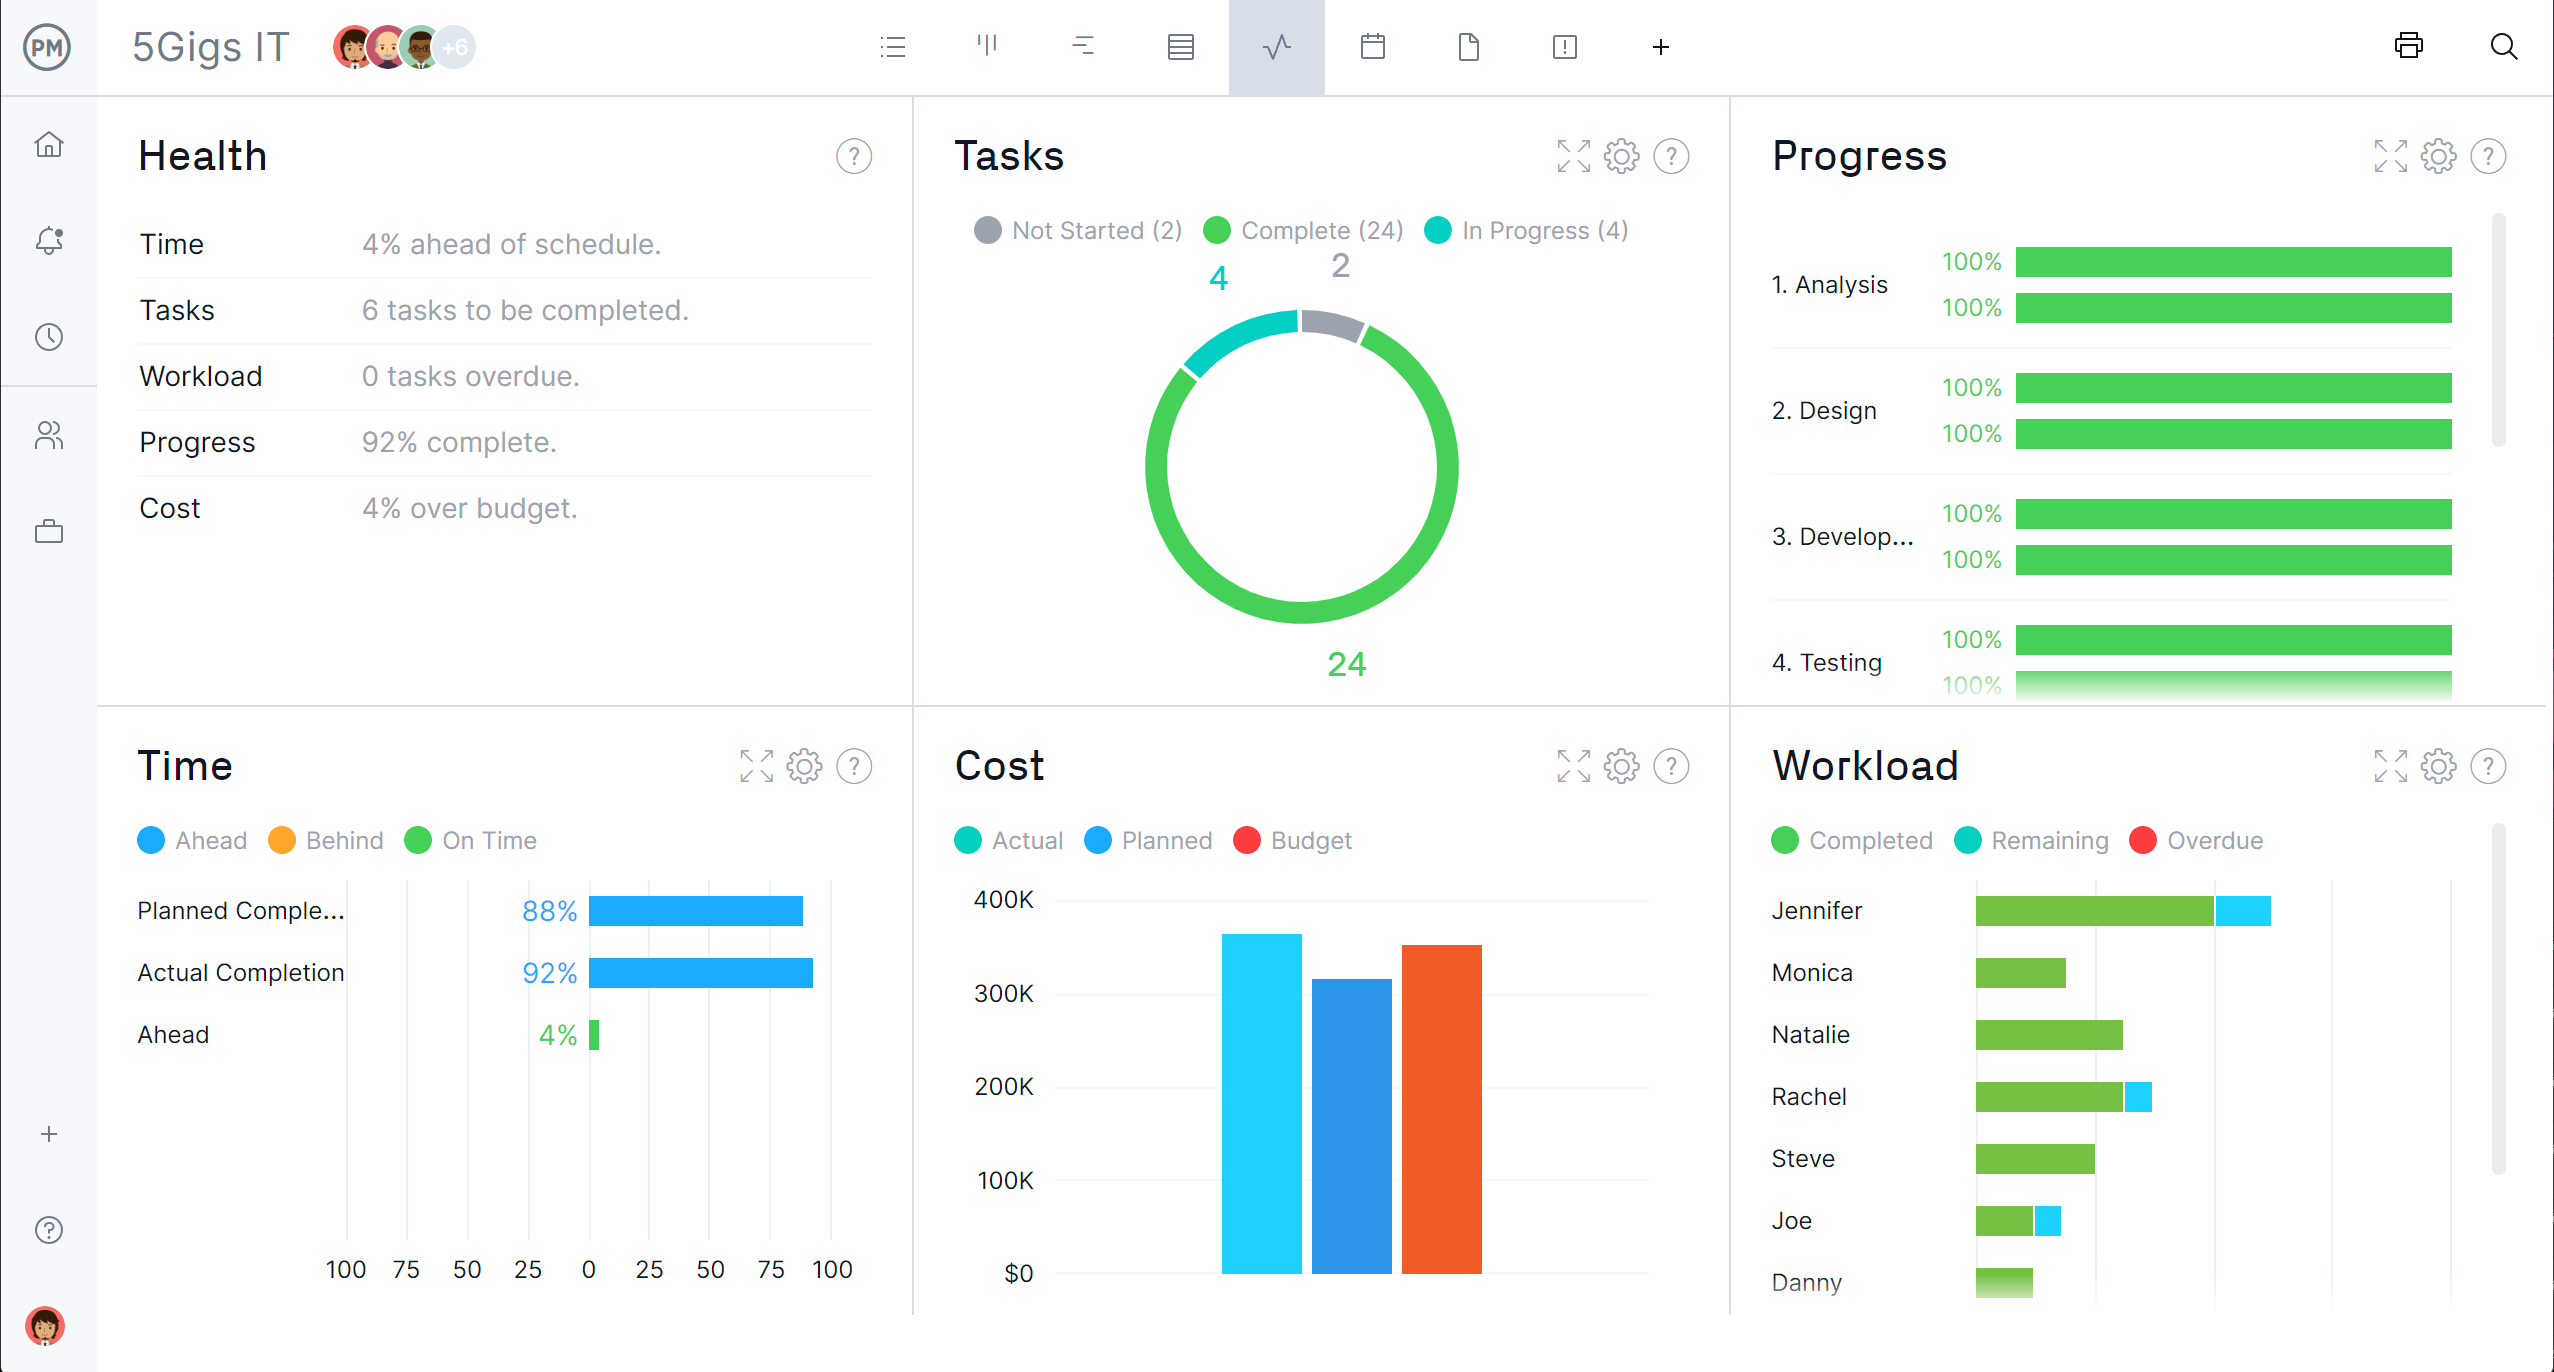
ProjectManager’s dashboard and budget tracking tools let you monitor project costs, schedule progress and milestone completion live as work is recorded. Labor hours pull from timesheets, task completion updates the schedule automatically and cost variances surface as they develop, not at the end of the month. For manufacturing operations running capital projects, new product launches or process improvement initiatives alongside daily production, that real-time visibility is what keeps projects on track without constant manual status gathering.
Coordinate Production Teams and Work Schedules Across Shifts
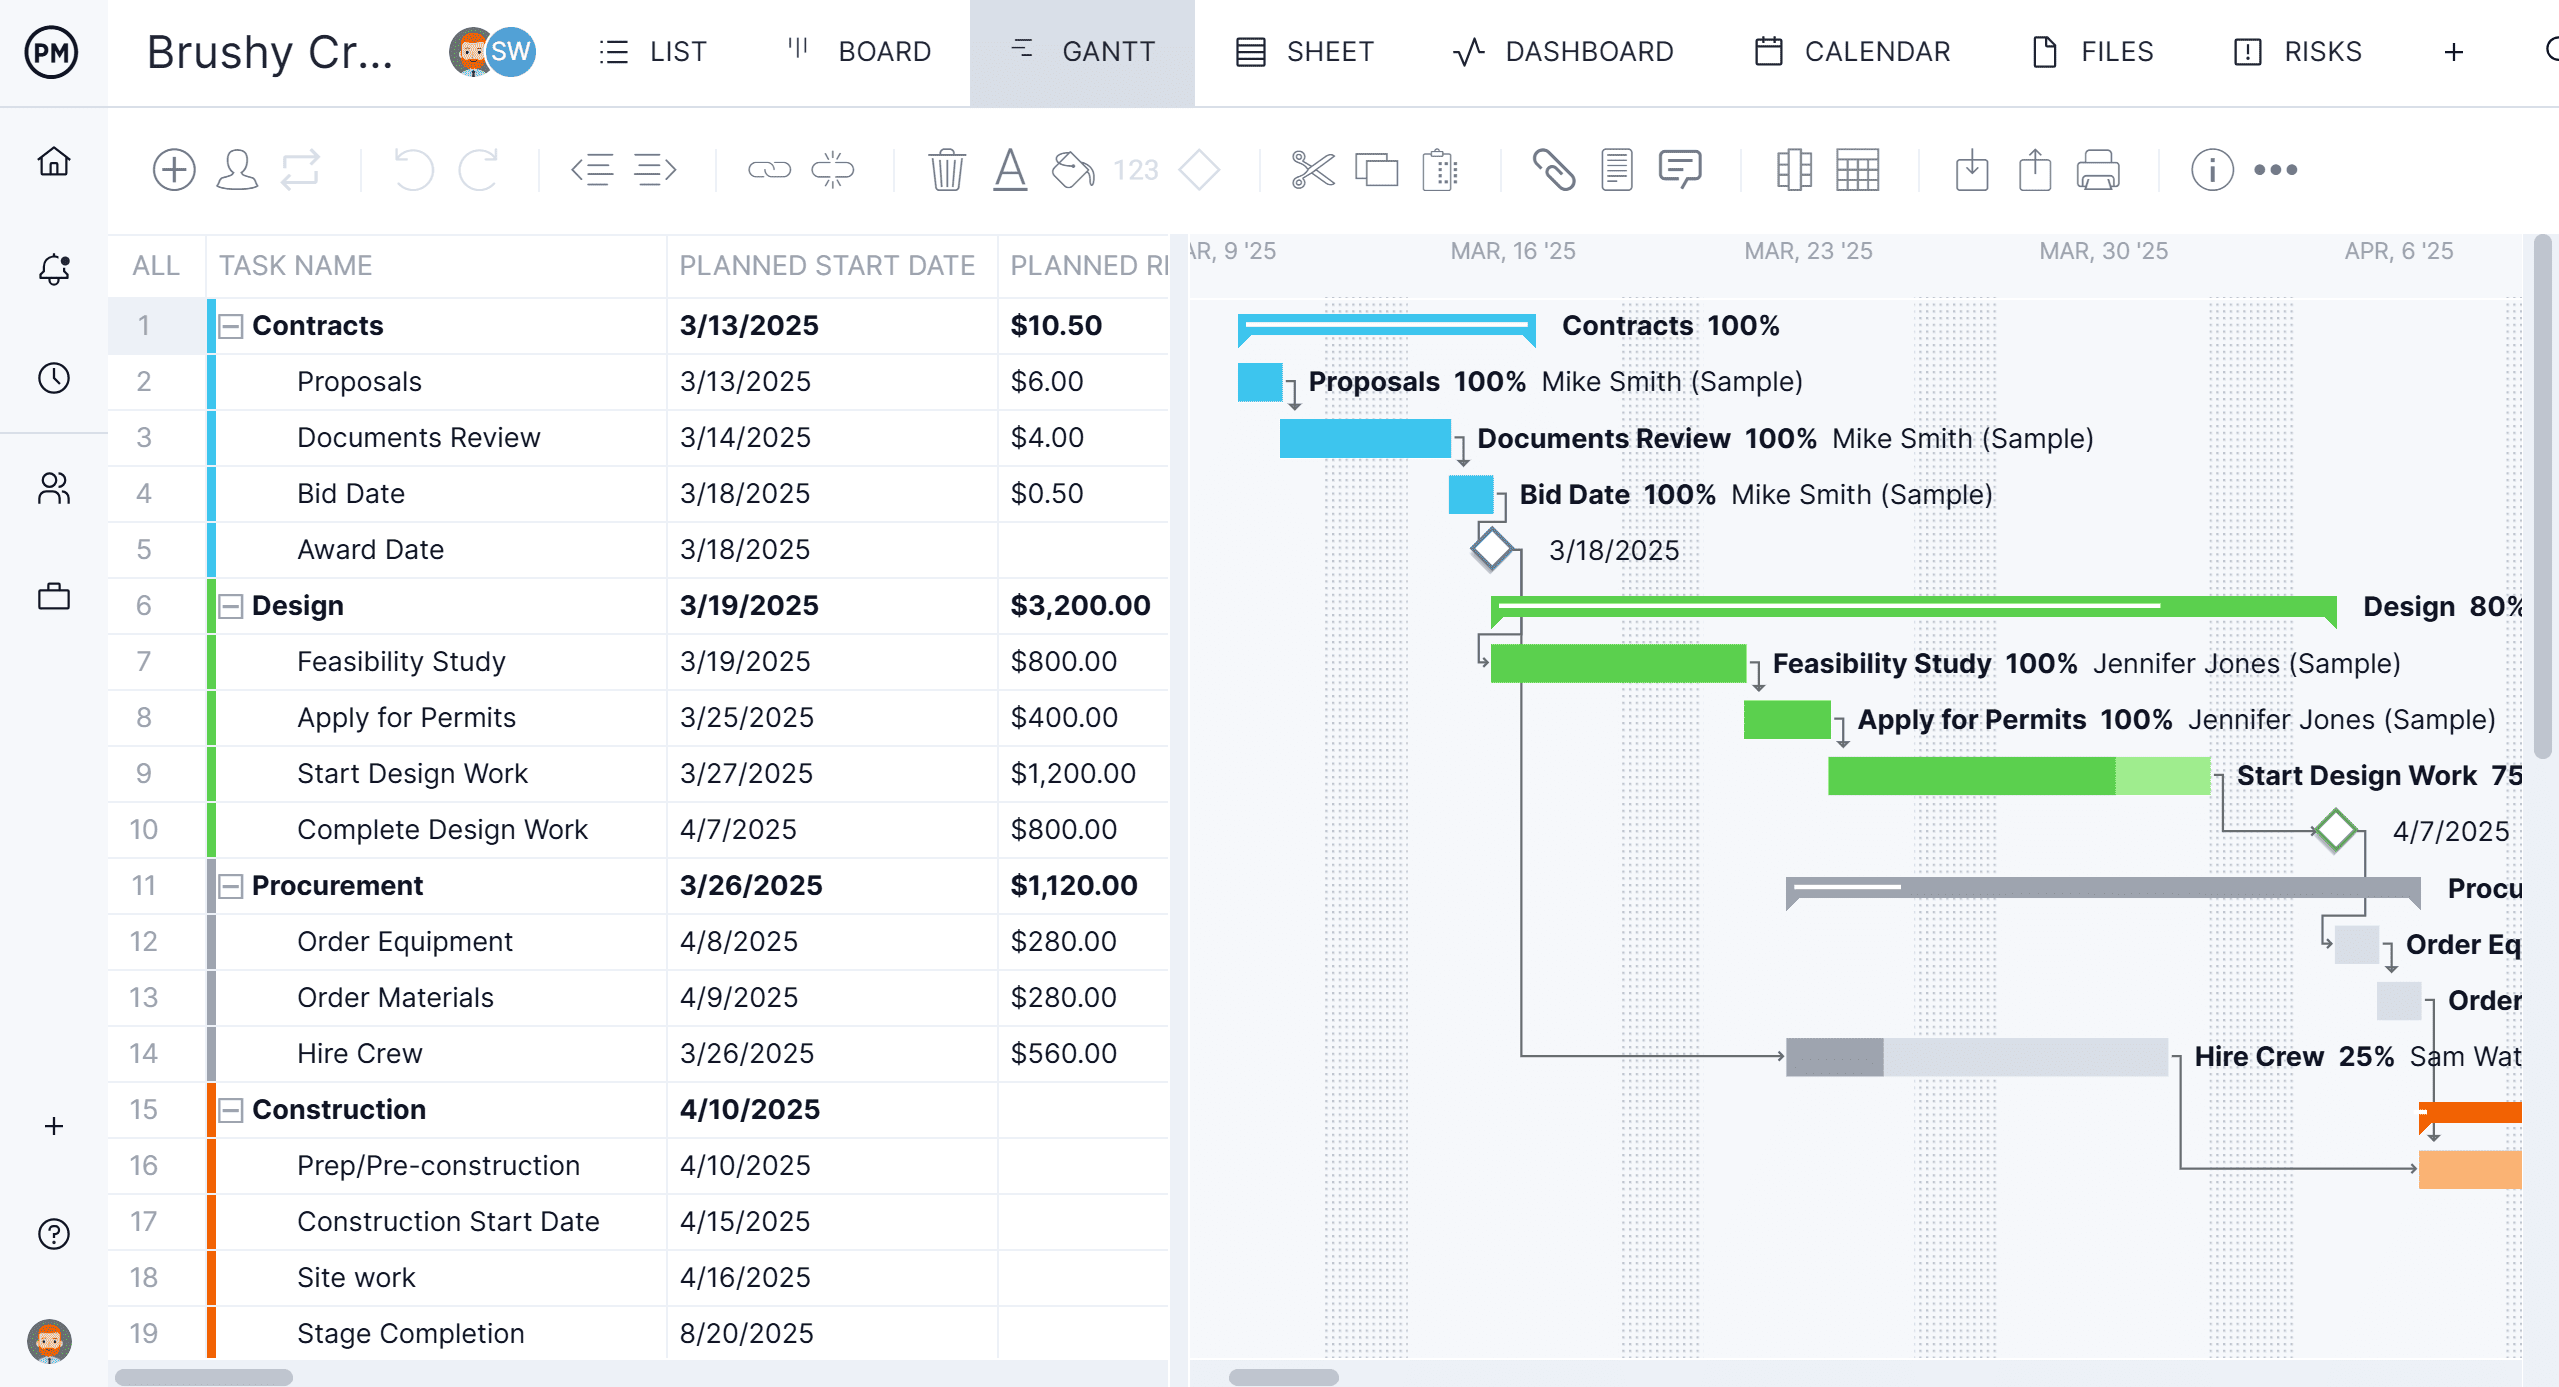
ProjectManager’s task management and workload tools let you assign work orders, maintenance tasks and project deliverables to specific team members or departments and track completion across shifts. Dependencies keep the work sequence logical: when one task is delayed, the downstream impact is visible immediately so supervisors can resequence rather than discover the problem at the next shift handover. Everyone works from the same updated plan, which reduces the miscommunication between shifts that derails production schedules.
Related Content
- 5 Free Construction Dashboard Templates for Excel
- 25 Free Project Management Templates for Excel
- 10 Free Status Report Templates for Word and Excel
- 9 Free Contingency Plan Templates for Excel and Word
- 8 Free Work Schedule Templates for Excel
- 8 Free Production Report Templates for Excel and Word
- 12 Free Production Scheduling Templates for Production Planning
- How to Create a Master Production Schedule (MPS)
- Production Scheduling Basics: Creating a Production Schedule
