A Gantt timeline is one of the most effective tools in project management. It provides a visual timeline that helps teams plan, track and manage tasks. Whether you’re in construction or software, a Gantt schedule keeps everything organized. In this guide, we’ll show you exactly how to build one step by step.
What Is a Gantt Timeline?
A Gantt timeline is a project planning tool that combines a task list with a visual timeline. It displays when tasks start and end, how long they last, and how they relate. Combining data and visuals helps teams coordinate work and monitor progress from start to finish.
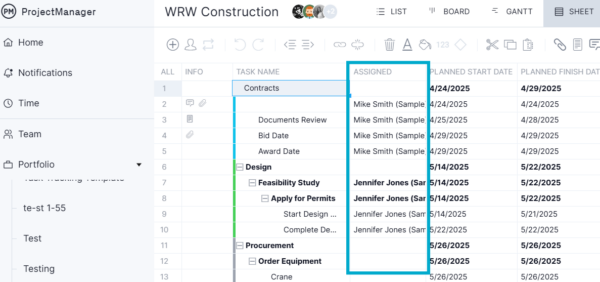
On the left side of a Gantt schedule is a structured grid where you input essential task data. This includes task names, assignees, estimated durations, resource requirements, and projected costs. Organizing this information in the grid helps standardize project details and allows for clear communication among stakeholders. It also serves as the foundation for generating the timeline on the right side of the chart.
On the right side is the stacked bar chart laid over a calendar. Each bar represents a task’s duration and placement on the timeline. The horizontal layout makes it easy to see overlaps, sequencing, and deadlines. This visualization improves planning, tracking, and team coordination.
Of course, that’s just the bare minimum of what a Gantt chart timeline is. While Gantt charts can be made in spreadsheets like Excel or Google Sheets, the real power of the planning tool is revealed when used in online project management software. ProjectManager is award-winning project and portfolio management software with powerful Gantt charts that schedule tasks, resources and costs.
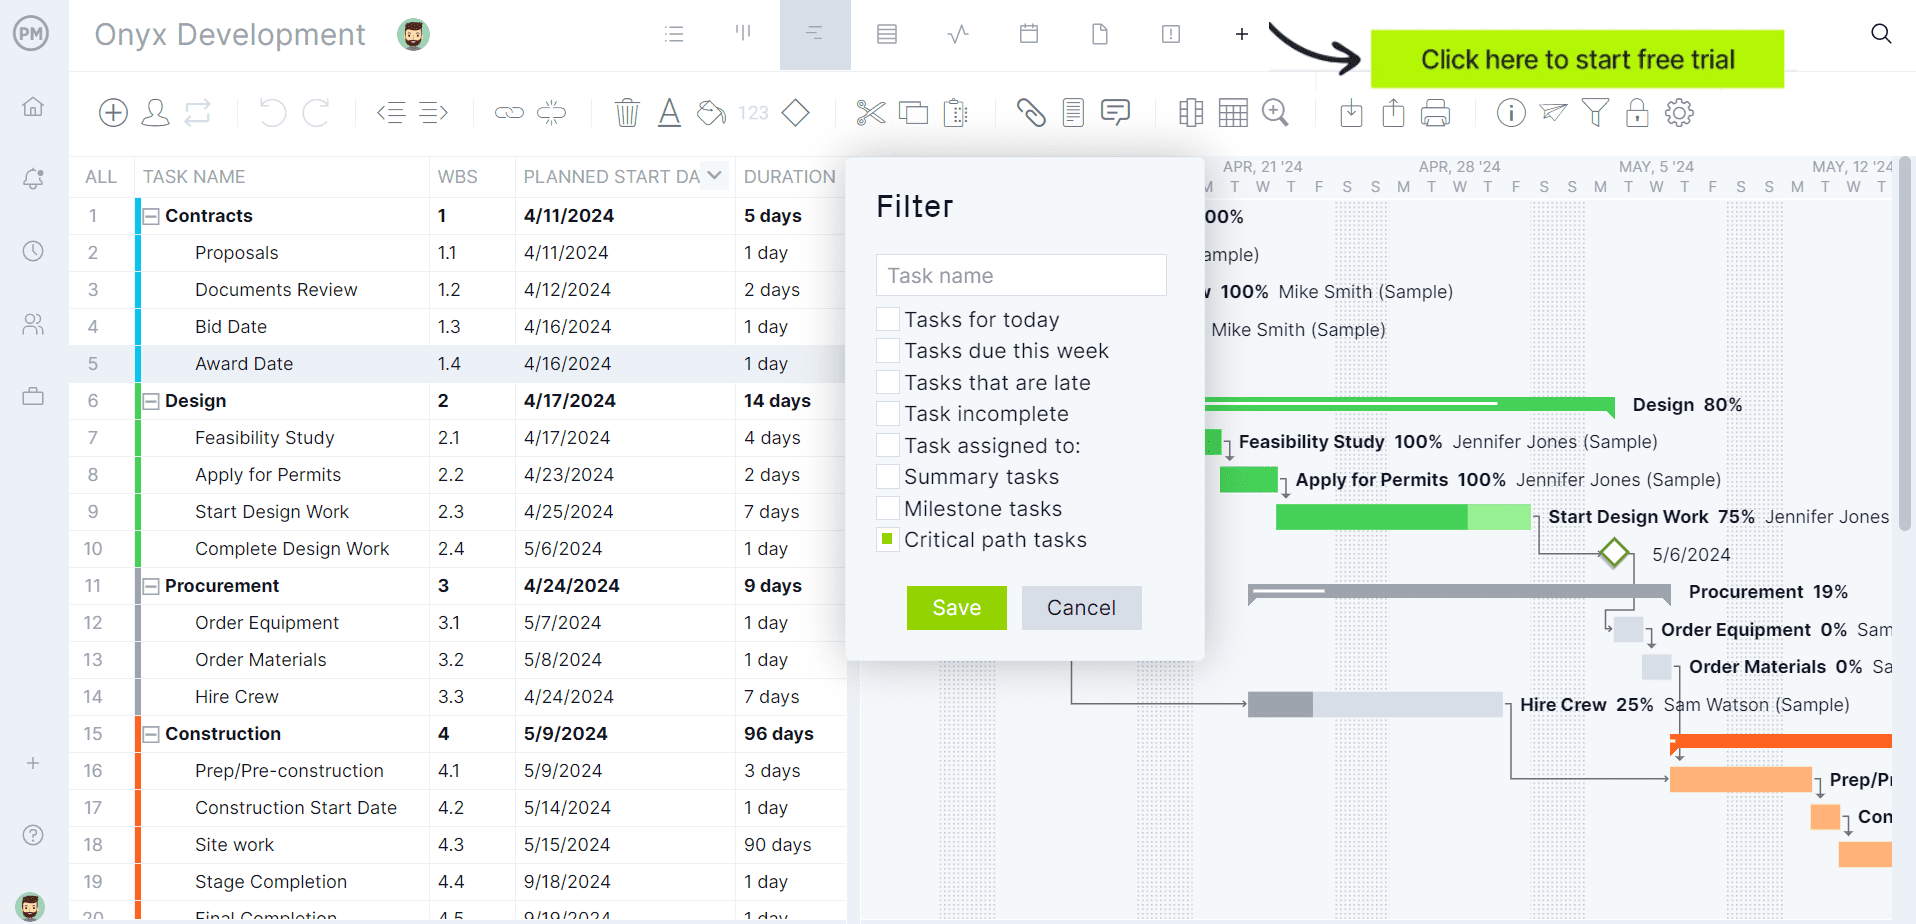
But our Gantt chart doesn’t stop there. It links all four types of task dependencies to avoid cost overruns and bottlenecks. It can also instantly filter for the critical path to show tasks that have no slack and must be delivered on schedule. It can also set a baseline to track actual effort against the planned effort in real time to keep projects on schedule.
When to Make a Gantt Timeline
During the project planning phase, a Gantt timeline is critical in setting up the project’s structure. It helps identify all tasks, assign responsibilities, allocate resources and establish deadlines. This schedule serves as a roadmap, ensuring that everyone involved understands the workflow, the timeline, and the sequence in which activities should take place.
In the execution and monitoring and control phases, the Gantt timeline becomes a live management tool. It helps track progress against the plan, manage overlapping tasks and make timely adjustments. Project managers use it to detect delays, reallocate resources and reschedule dependent tasks to stay on track.
It also provides a single source of truth for the team, allowing stakeholders to remain informed and aligned throughout. As the project evolves, the Gantt timeline can be updated to reflect real-time status, making it easier to conduct performance reviews and status meetings. This visibility supports accountability and keeps the project moving without surprises.

Get your free
Gantt Chart Template
Use this free Gantt Chart Template to manage your projects better.
Get the Template
How to Make a Gantt Timeline
Creating a Gantt schedule involves more than just placing tasks on a timeline. It’s a structured process that starts with identifying tasks and then organizing them with logic and precision. This section walks through the essential steps to build an accurate, effective Gantt timeline for any type of project with illustrations from ProjectManager’s Gantt chart.
1. Identify Project Tasks Using a Work Breakdown Structure
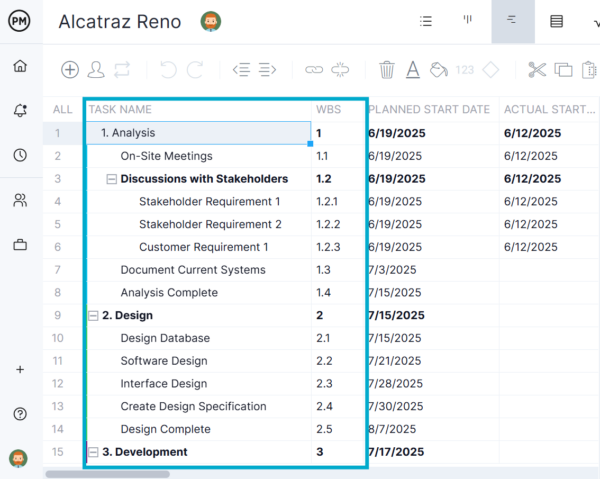
Begin by creating a work breakdown structure (WBS) to break the project into smaller, manageable components. Each high-level deliverable is divided into work packages and tasks. This hierarchy makes it easier to capture every activity needed to complete the project. The resulting task list becomes the foundation of your Gantt timeline, ensuring all necessary work is included and properly organized from the start.
2. Link Task Dependencies Together
Task dependencies define how tasks relate to one another—specifically, which tasks must be completed before others can begin. Common types include finish-to-start, start-to-start, and finish-to-finish relationships.
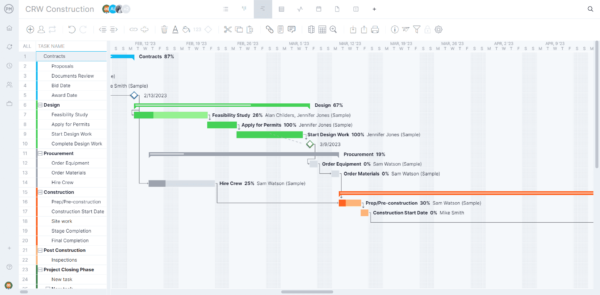
In a Gantt chart, task dependencies are linked using arrows that connect the bars. This visual linkage helps project managers understand the sequence of work, identify potential bottlenecks, and adjust the schedule quickly if changes occur. It improves clarity and reduces the chance of delays.
3. Use the Gantt Timeline Bars to Represent Task Duration and Due Dates
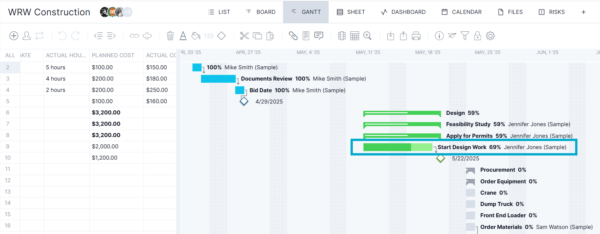
Gantt charts use horizontal bars to visually represent each task’s timeline. The left edge of a bar marks the start date, while the right edge shows the end date. The length of the bar reflects the task’s duration in calendar days. This bar chart format makes it easy to see when tasks begin and end, whether they overlap and how the overall project schedule flows across time.
4. Assign Tasks to Team Members Using the Gantt Timeline Grid
The grid section of a Gantt timeline allows you to specify who is responsible for each task. You can list team members or departments next to each activity, making accountability clear. Assigning tasks in the grid helps organize workload distribution and ensures that no step in the project is left unclaimed. It also makes collaboration easier and provides visibility into each team member’s responsibilities throughout the timeline.
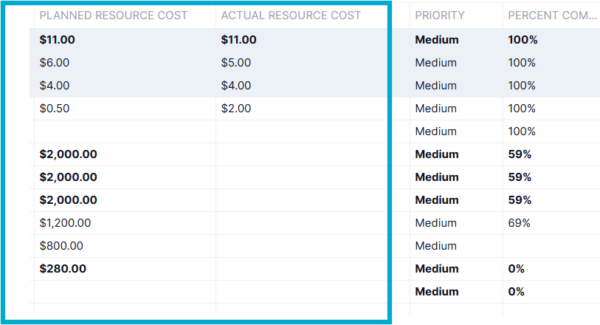
5. Add Additional Project Planning Details to the Gantt Timeline
Beyond task names and assignees, the Gantt timeline grid can capture key planning details. You can include estimated labor hours, materials needed, equipment use or other resource requirements. You can also specify the estimated cost of each task to support budgeting. Adding this data centralizes your planning in one place and helps align the schedule with financial and operational constraints.
Key Benefits of Making a Gantt Timeline
A Gantt timeline offers several advantages that make it a go-to tool for project managers. From improving team communication to tracking progress with precision, the benefits of using a Gantt timeline extend across all project phases and team roles.
Easy to Understand for Project Stakeholders
Gantt timelines provide a clear and visual way to communicate the project plan. Stakeholders can instantly grasp task sequences, deadlines and overall timelines without needing technical training. This transparency improves alignment, encourages collaboration and ensures that everyone—clients, teams, and executives—can follow the progress and contribute to decision-making when needed.
Can Incorporate Resource Planning, Cost Tracking and Project Scheduling
A Gantt timeline centralizes multiple planning functions into one place. In addition to scheduling tasks, it can be used to assign resources, estimate costs, and track budget allocation. This integration streamlines project oversight, helping teams balance time, labor and financial constraints effectively while keeping all stakeholders informed about resource availability and spending.
Can Be Adjusted Easily as Projects Change
Gantt timelines are flexible and can be updated in real time as project conditions evolve. Whether tasks are delayed, added or rescheduled, changes can be made quickly and visually. This adaptability helps project managers respond to unexpected issues, maintain workflow continuity, and communicate new plans to the team without creating confusion.
Provides a Snapshot of the Entire Project Timeline
A Gantt timeline presents the entire project timeline at a glance. Project managers and stakeholders can instantly see start dates, end dates, key milestones and task dependencies. This high-level view is especially helpful for strategic planning, reporting and identifying when critical phases of the project are scheduled to begin or end.
Helps Monitor Projects at the Task Level
Beyond the big picture, Gantt timelines help manage the project at a granular level. Each task can be tracked individually for progress, completion status, and resource usage. This level of detail helps ensure accountability, supports early problem detection and makes it easier to keep the project on time and within scope.
Free Gantt Timeline Templates
For those who don’t want to upgrade to project management software at this time, there is a workaround. We have over 100 free project management templates for Excel and Word that cover all aspects of managing projects. Below are just a few that can be used to create a Gantt chart and some of the features that are incorporated with online tools.
Gantt Chart Template
Download this free Gantt chart template to visually map out project tasks along a timeline, helping teams plan, organize and track work efficiently. It includes columns for task names, start and end dates and durations on one side and a horizontal bar chart on the other.
Critical Path Diagram Template
Use this free critical path diagram template to visually outline the sequence of tasks that directly impact a project’s completion date. It highlights the critical path—the longest chain of dependent activities with zero slack—where any delay would push the entire project timeline.
PERT Chart Template
The free PERT chart template (program evaluation review technique) is a visual project management tool used to map out the tasks, timelines and dependencies involved in completing a project. It represents activities as nodes (or boxes) and arrows to indicate the sequence and relationships between tasks..
ProjectManager Has the Best Gantt Timeline Tool
Free templates are at best a workaround in project management. They can help plan the project, maybe even execute and monitor it, but you’ll always be a beat behind and likely miss critical data that could sidetrack the project or worse. To avoid manually updating static documents that are never current, simply upgrade to project management software. Unlike a Gantt chart template, ProjectManager has award-winning Gantt charts that automatically update, link dependencies, filter for the critical path and track work in real time.
Manager Resources and Balance Workloads
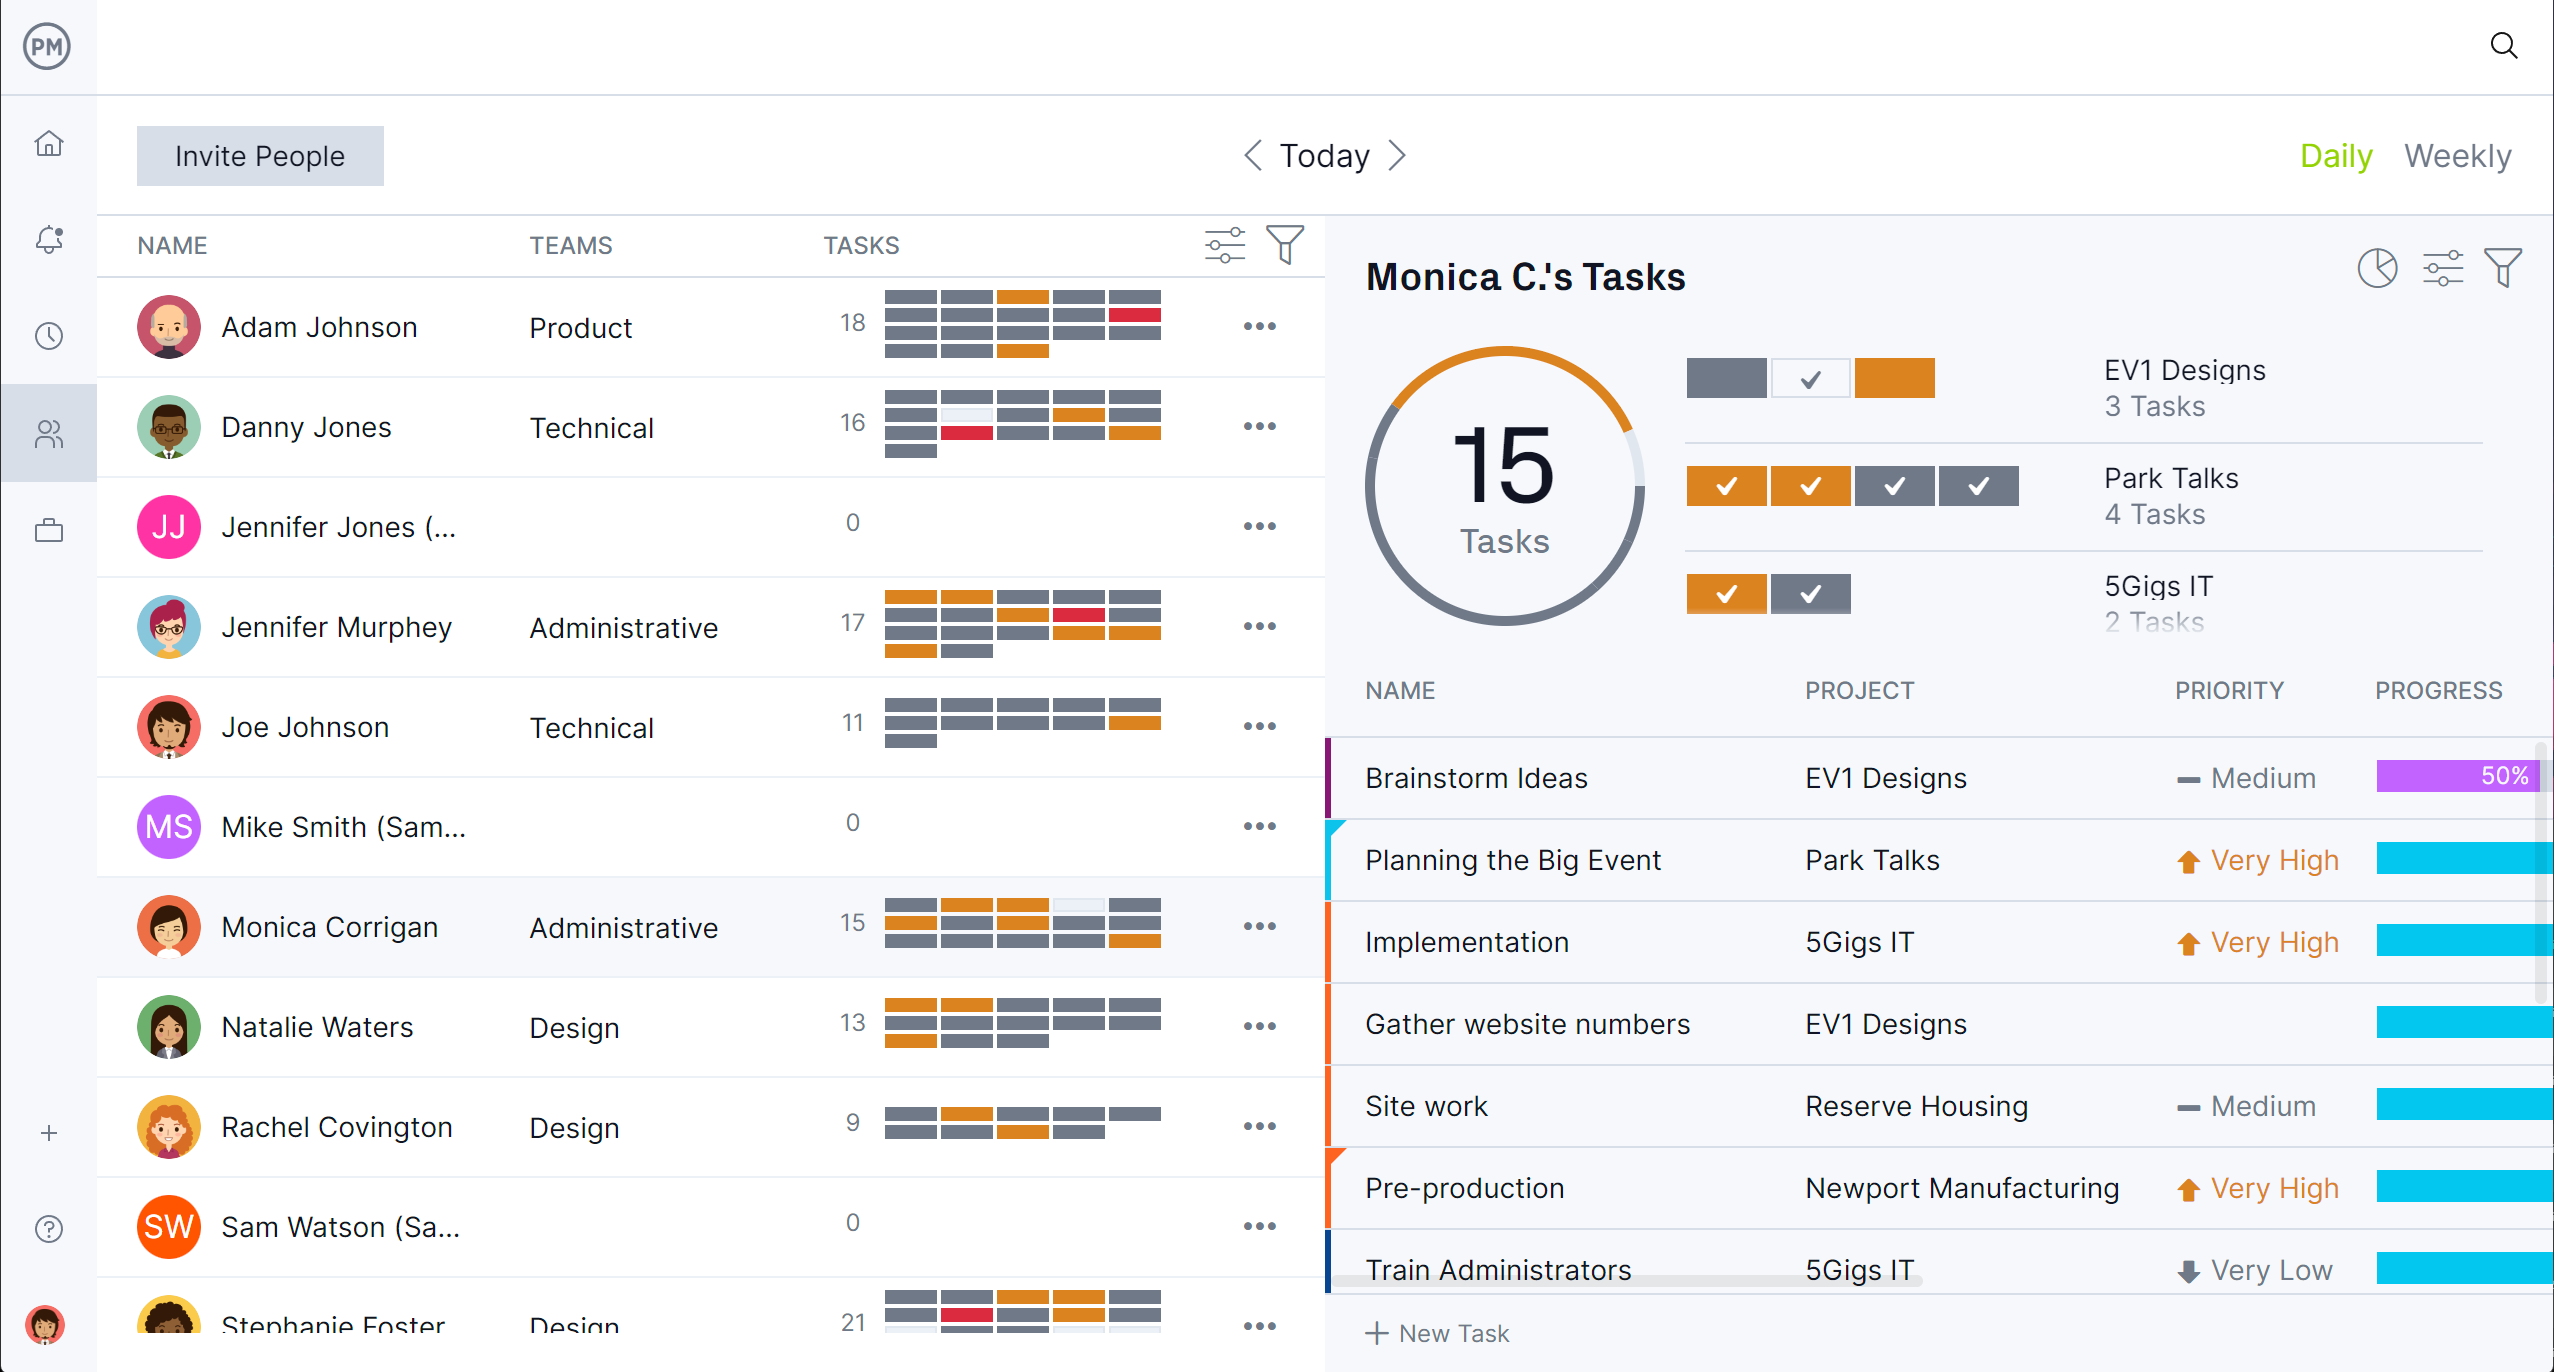
The Gantt charts directly inform resource management features by translating task scheduling into real-time visibility across availability, workload and team capacity. When you assign tasks in the Gantt chart, each assignment is linked to a specific team member with defined start and end dates, durations and estimated hours. This data automatically flows into the color-coded workload chart, making it easy to see who’s overallocated or underutilized.
On the team page, project managers can view individual availability alongside role-specific assignments, helping them balance workloads or reassign tasks as needed. Because the Gantt chart reflects dependencies and task sequencing, any changes—like shifting dates or reassigning resources—are instantly updated in resource views. This seamless integration means project managers can forecast staffing needs, avoid conflicts and ensure optimal team performance, all from the same planning structure that drives the project schedule.
Track Projects in Real Time With Dashboards, Reports and Timesheets
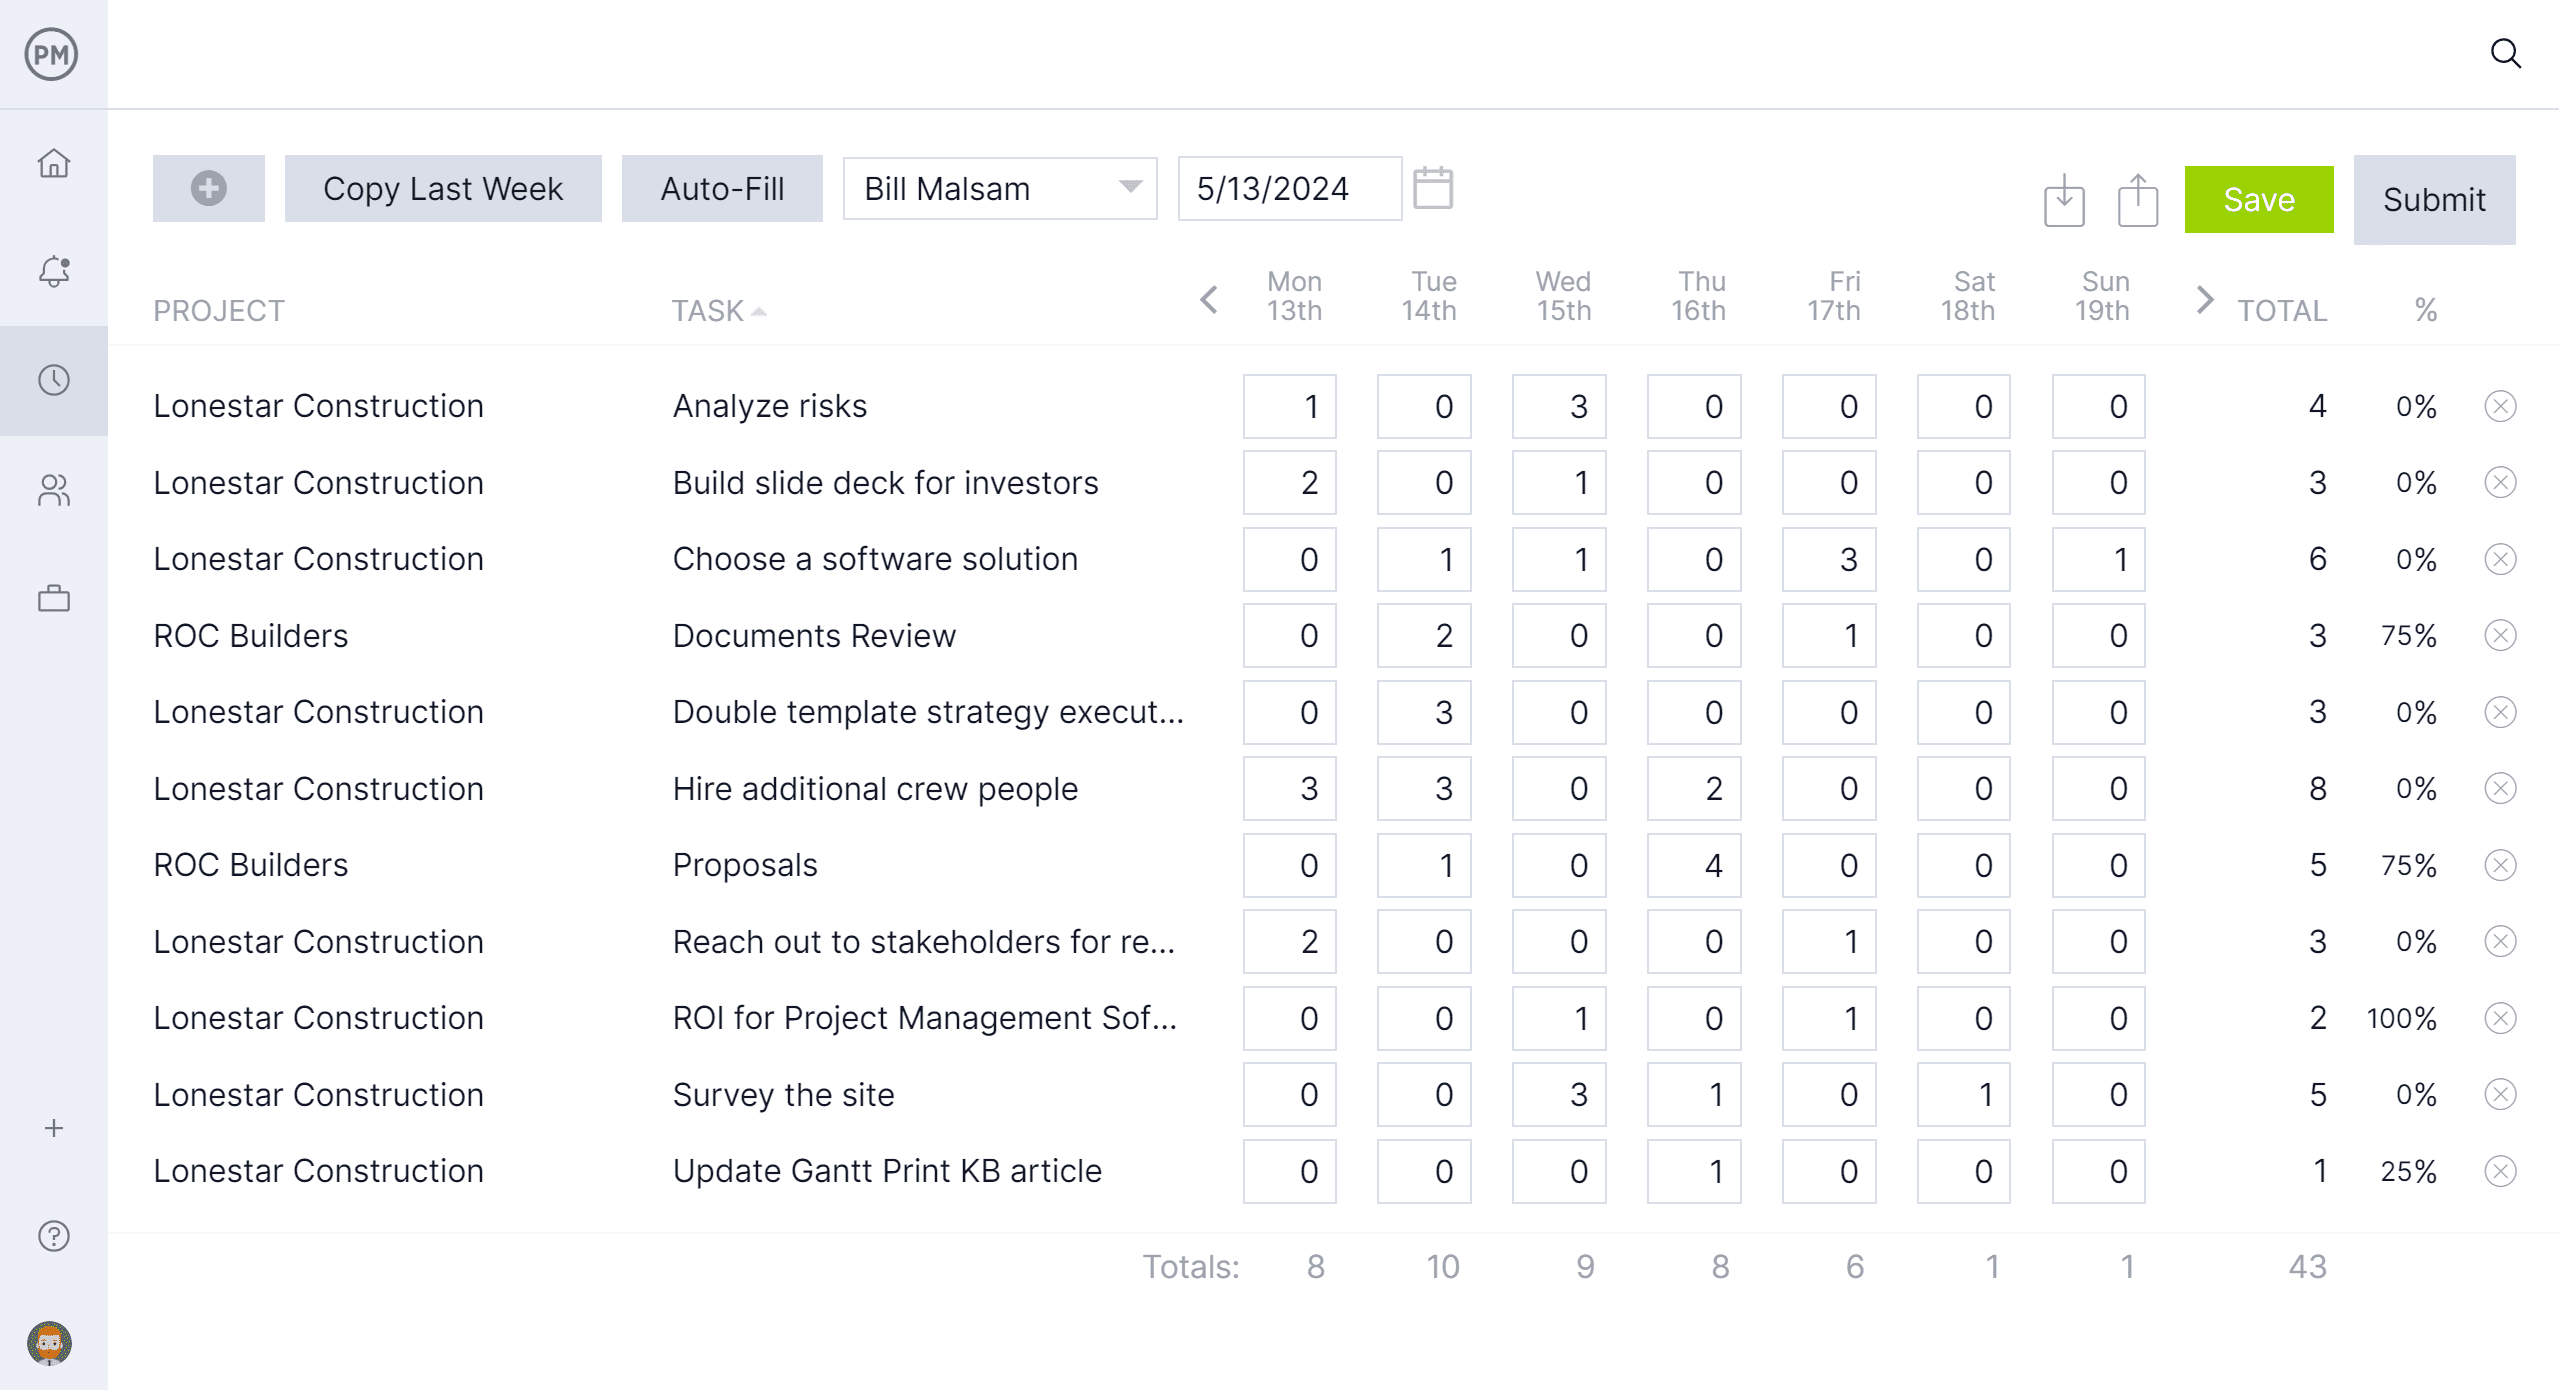
Another way the Gantt chart feeds into other project management features is through the real-time dashboard, customizable reports and secure timesheets. As tasks are added, updated or completed in the Gantt chart, this data is instantly reflected in the live dashboard, providing up-to-date metrics on progress, deadlines and resource usage. The same task data feeds into detailed reports, which can be customized by project phase, team member or deliverable to give stakeholders targeted insights.
Additionally, the Gantt chart’s task structure syncs with the secure timesheet system, allowing team members to log hours directly against their assigned work and giving project managers insight into labor costs. This tight integration ensures that scheduling, tracking and reporting are always aligned, enabling informed decisions and streamlined project oversight.
Related Gantt Chart Content
Learning to make a Gantt chart timeline is only the start of creating a Gantt schedule. For readers who want to continue on their education, we have a list of related articles below on Gantt chart software, critical path and much more.
- How to Make a Gantt Chart: Steps, Tools & Tips
- How to Make a Gantt Chart in Excel Step-By-Step
- 18 Best Gantt Chart Software of 2025 (Free & Paid)
- 10 Gantt Chart Alternatives for Project Management
- Displaying the Critical Path on a Gantt Chart
- Why Use a Gantt Chart in Construction Project Management
ProjectManager is online project and portfolio management software that connects teams whether they’re in the office or out in the field. They can share files, comment at the task level and stay updated with email and in-app notifications. Join teams at Avis, Nestle and Siemens who are using our software to deliver successful projects. Get started with ProjectManager today for free.
