Gantt charts are used by project managers for project planning, scheduling, tracking and more. This is why most project management software alternatives offer Gantt charts as part of their feature sets.
However, some Gantt chart makers and project management software, such as Microsoft Projec,t aren’t compatible with Mac. This can be problematic for Mac users, forcing them to choose one of the Gantt chart software alternatives that are available on the market.
5 Tools to Create a Gantt Chart on Mac
To help you choose the best software, we’ve selected five tools to make a Gantt chart on Mac. Each of them offers pros and cons depending on your needs and can be used by beginners or experienced project managers alike.
1. ProjectManager
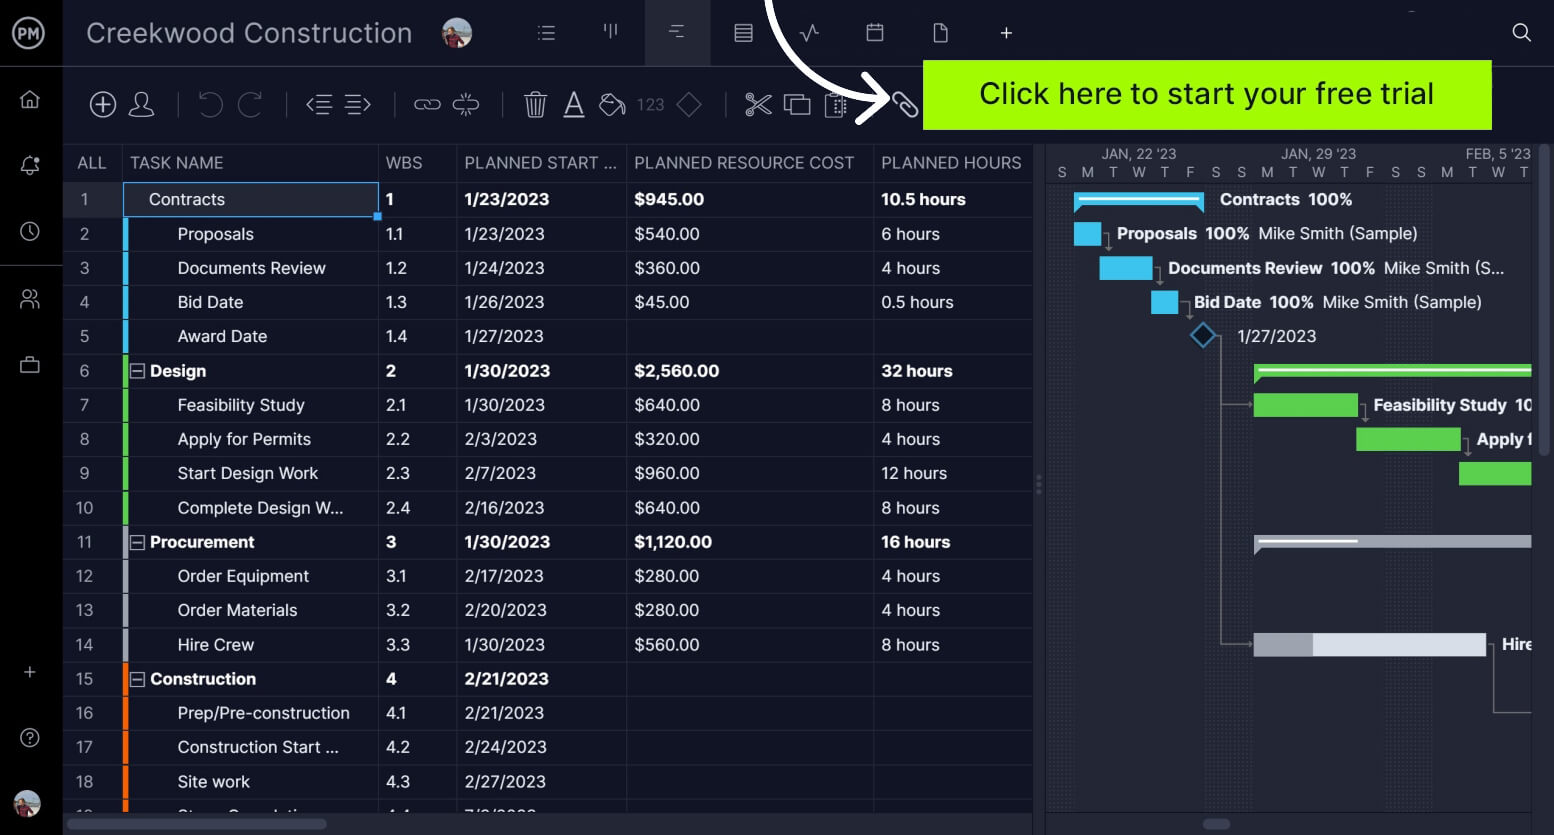
The first thing to do is sign up for a free 30-day trial of ProjectManager. Once you sign up for the free trial, you’ll have access to the Gantt chart maker and the full suite of project management features that work hand-in-glove with one another.
Head to the ProjectManager pricing page, where you’ll see various options, so choose the one that works best for you. All plans are free for 30 days, and each is compatible with either your Mac or Windows PC device.
Import Your Task List or Spreadsheet
Now that you have an account with ProjectManager, you can either use one of its many project templates to get started or import a task list to start a new project.
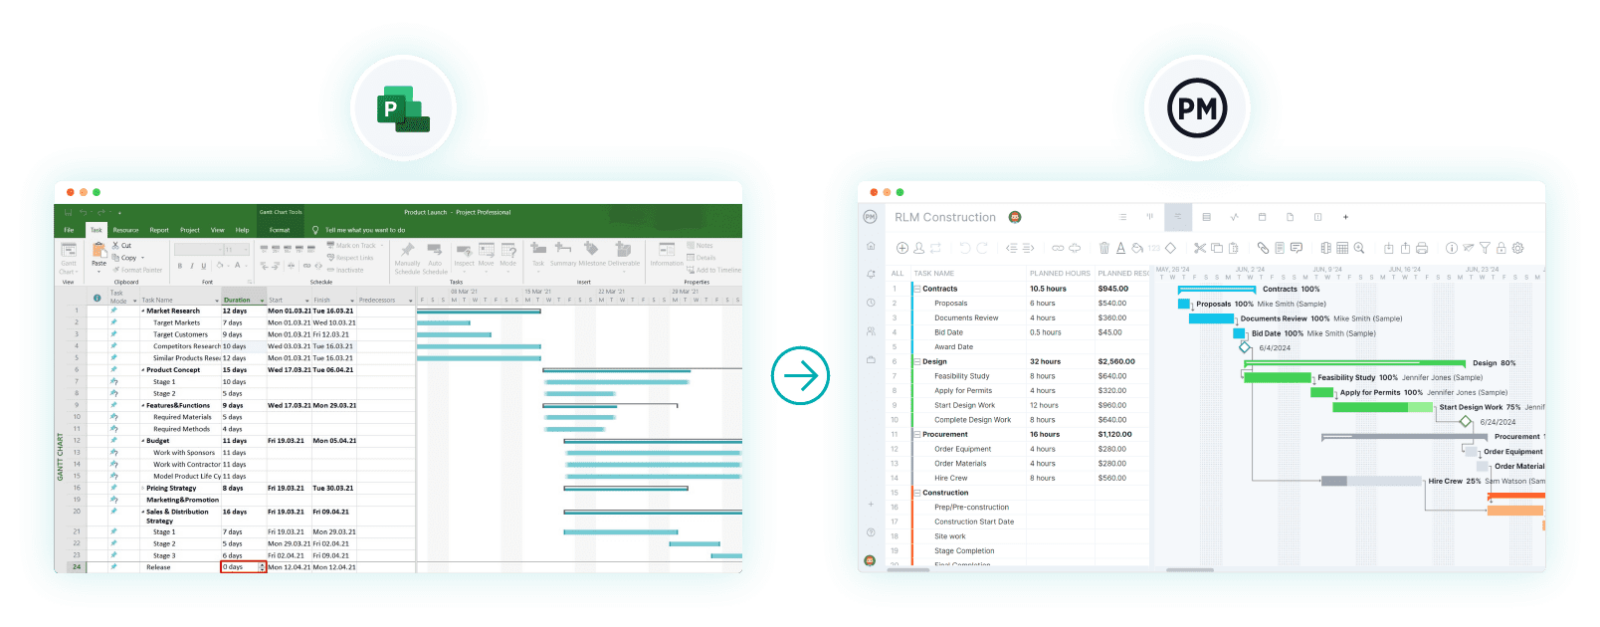
If you’ve been using Excel or MS Project, you can import Excel and MPP files and ProjectManager will convert them into a Gantt chart for Mac. If you want to import a Numbers file from your Apple device, be sure to convert it to an Excel or CSV file first.
View & Edit the Gantt Chart on Your Mac
If you choose to import a spreadsheet of tasks into ProjectManager, it will open as a new project in a Gantt chart, one of the many project views available to users. All of the data from your spreadsheet is now visible in a Gantt chart that can be viewed and edited online with any Mac OS X, OS X and MacOS device.
The column headings, tasks and other resource data you added are there and can be edited as needed. You can add costs for your tasks and other details, and you can even make custom columns with our Gantt chart maker for Mac and PC if you need to add more information.
Add Task Durations to Create Project Timelines
The next thing to do is add a start and end date for each of the tasks on the Gantt chart. You’ll notice that the left side of the Gantt looks like an MS Excel or Apple Numbers spreadsheet. As you add durations to the tasks, they will populate the stacked bar chart timeline on the right side of the page. If you have to change the dates, you can adjust them by dragging either side of the duration bar.
Don’t worry if some tasks are executed at the same time. We’ll get to that later. As you make these time estimates, you’re starting to schedule your project.
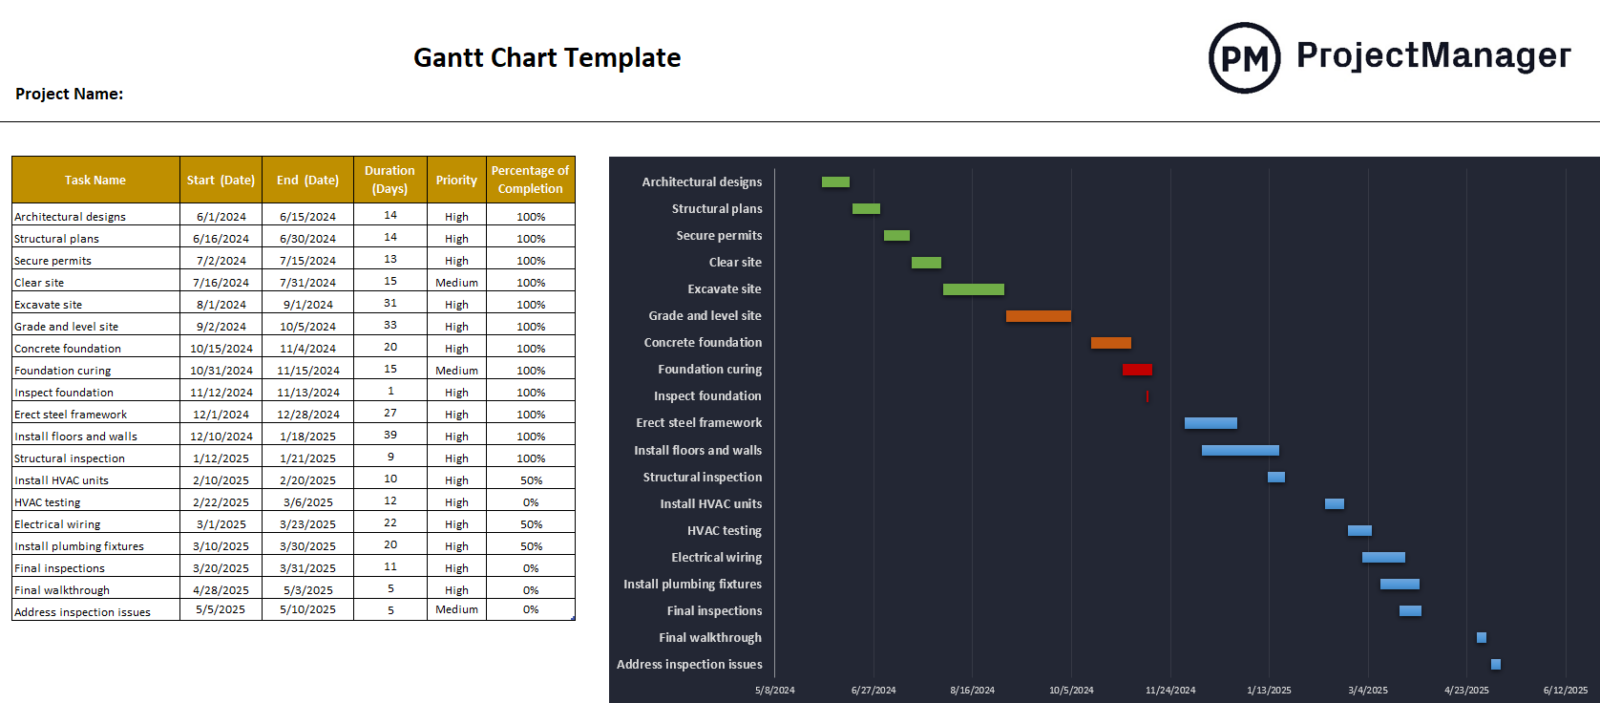
Get your free
Gantt Chart Template
Use this free Gantt Chart Template to manage your projects better.
Get the Template
Add Milestones to the Gantt Chart
A project can quickly get messy, so breaking down its timeline into more digestible tasks is important.
The milestone feature is a great way to break a project into more manageable parts. A milestone marks a major phase in the project and is represented on the Gantt by a diamond (♦) symbol. Crossing a milestone is a great morale booster for project teams because it means you’re one step closer to completing the project.
If you don’t have any concrete milestones, you should at least break your Gantt chart down into phases for easier tracking.
Identify Task Dependencies
Remember when we noted that tasks can be executed simultaneously? While this isn’t always an issue, at other times it can be a problem. If you have one task that cannot start until another is finished, you need to make note of that or risk a bottleneck in your production. This is called a task dependency and it can be linked within your Gantt chart, allowing you to manage the project better. Failing to address task dependencies will cause project scheduling, task management and resource management issues.
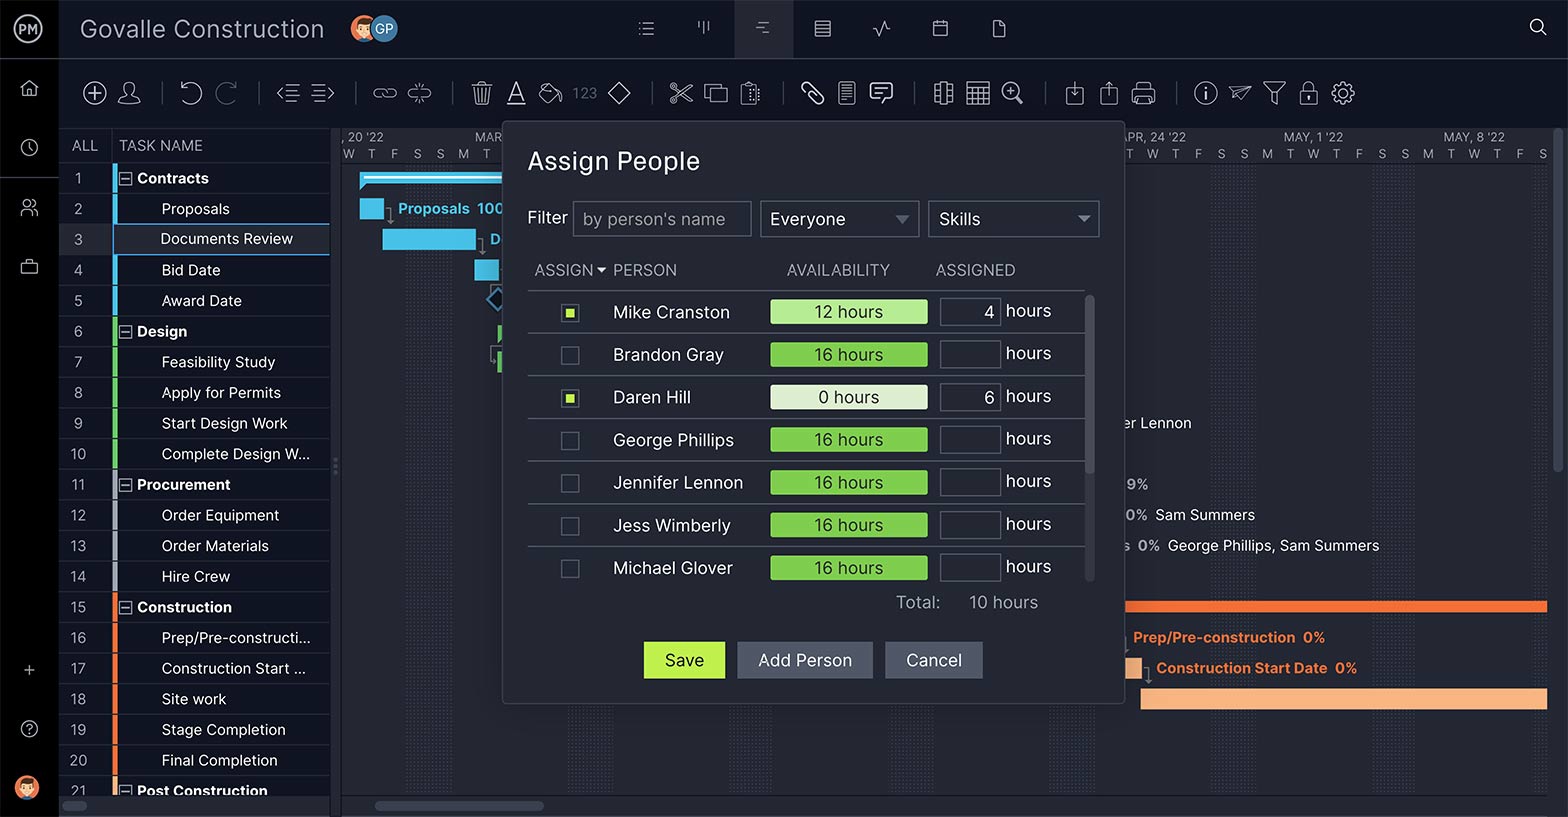
Assign Tasks to Your Team: They Can Be Both Mac & PC Users!
You can assign tasks directly from the Gantt chart with ProjectManager. No need to jump from one screen to another or, worse, to another software altogether. It’s all in one place to make managing your project a breeze.
Once a team member is assigned a task, they’re responsible for executing and completing it. But that’s only the beginning. ProjectManager is more than a handy project management tool for creating dynamic Gantt charts for Mac users (and PC users, too, of course).
2. Apple Numbers
Numbers is a spreadsheet app developed by Apple. While it doesn’t have a built-in Gantt chart, you can create one by manually formatting cells, creating a stacked bar chart and adding formulas. It can be a good starting point for beginners, but it’s very limited when it comes to project management features. Numbers only allow you to make a basic Gantt chart on your Mac. Project managers will have to go beyond Numbers for a powerful Gantt chart tool for Mac.
The main drawback of this tool is that you’ll need to create a Gantt chart through a time-consuming, manual process. Even if you download a Gantt chart template for Numbers, you won’t have access to project management features such as identifying the critical path, scheduling tasks or tracking time.
3. Google Sheets
Google sheets is a spreadsheet tool that allows you to collaborate with your teams online. While it’s a great productivity tool that connects Mac and PC users, it is not really designed for creating Gantt charts. Just like numbers, it will allow you to create a stacked bar chart and format cells to create a Gantt chart.
But that Gantt chart will not offer any advanced project management features and, on top of that, you’ll need to be manually updating it to make sure it reflects your task dependencies, due dates and task owners.
4. Microsoft Project & Project Online
Microsoft Project just doesn’t work on Mac operating systems (Mac OS X, OS X and MacOS). If you’re transitioning to a Mac from a Windows PC or have stakeholders who work on different operating systems, this can leave you needing a Gantt chart for Mac.
Project Online is a cloud-based version of the traditional Microsoft Project, which does work on Mac. However, Project Online has a lighter feature set and is expensive subscription-based software.
One of the main disadvantages of Project Online is that it’s common to need other Microsoft products such as Power BI or Microsoft Teams for a full project management system. Your team members require a subscription to perform daily activities such as submitting timesheets or updating their tasks.
5. Microsoft Excel for Mac
Excel is one of the most commonly used spreadsheet software, which, like Numbers and Google sheets, can create Gantt charts. It can be convenient for both Microsoft and Mac users but maintaining an Excel Gantt chart requires a lot of heavy lifting.
One advantage of using Excel as a tool to create a Gantt chart on Mac is that Excel files can be exported to Gantt chart makers or a more robust project management software such as ProjectManager. Download our free Gantt chart template for Excel to get started.
ProjectManager Is the Best Gantt Chart Software for Mac
Gantt charts alone are great, but ProjectManager is even better. It takes Gantt charts and makes them part of a larger project management software for Mac that supports everything you need to plan, monitor and report on your project.
Once you make a Gantt chart on your Mac and the project is moving forward, how do you know the progress is matching what you planned? ProjectManager has a dashboard that charts your project in real time. ProjectManager crunches the numbers and delivers your project data in clear and easy-to-read charts which show task progress, project health, workload and more.
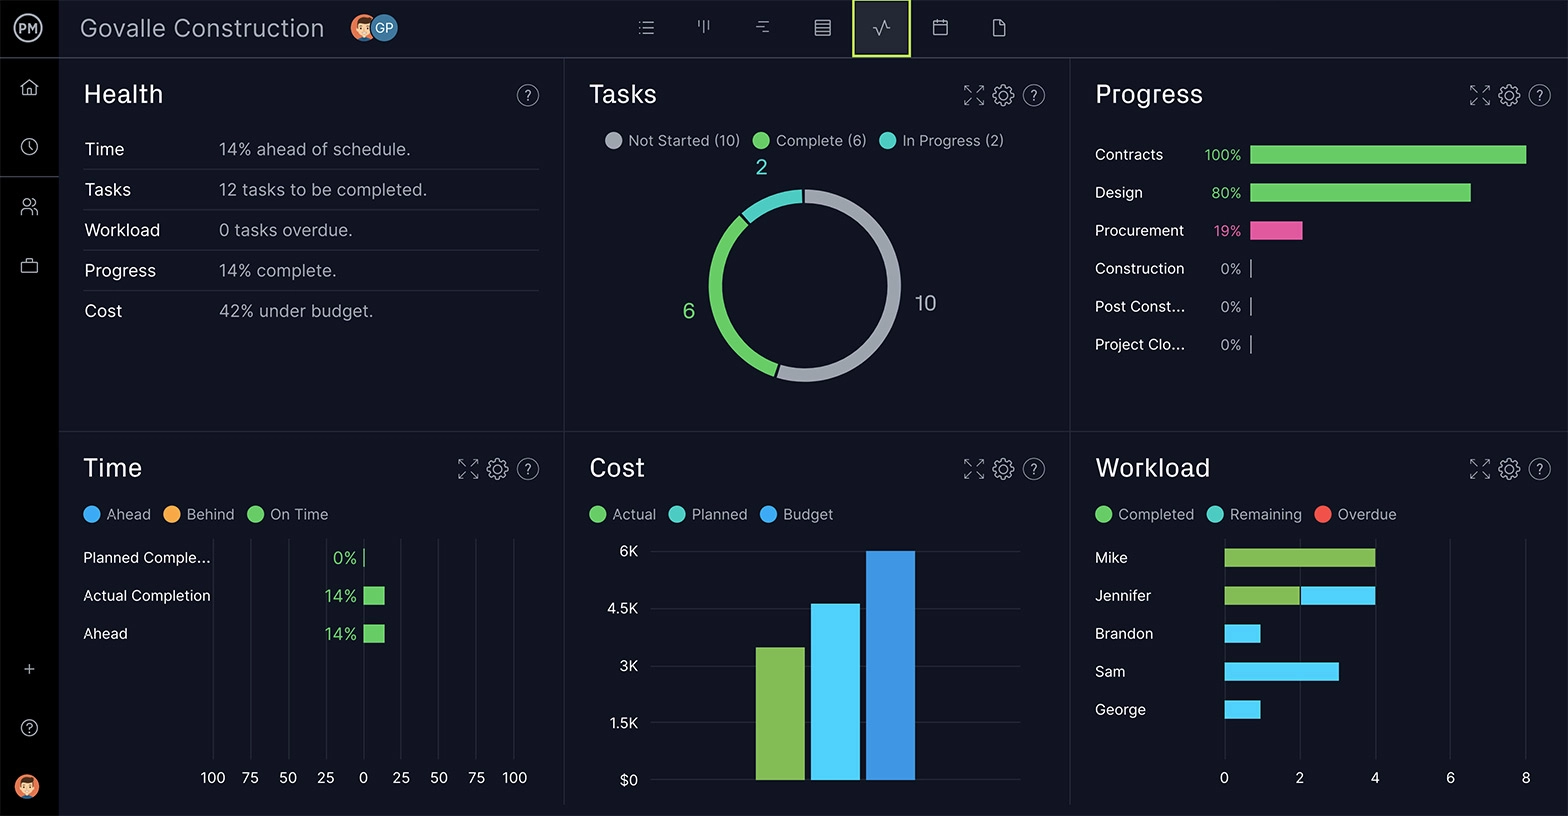
That overview is great for stakeholders, but managing a project means digging into the details. How about online reports that dive deep into your data? ProjectManager has one-click reporting to outline the performance of your project and team. There are status reports, task reports, workload reports and much more. You can filter these reports to show the data you want to make better decisions.
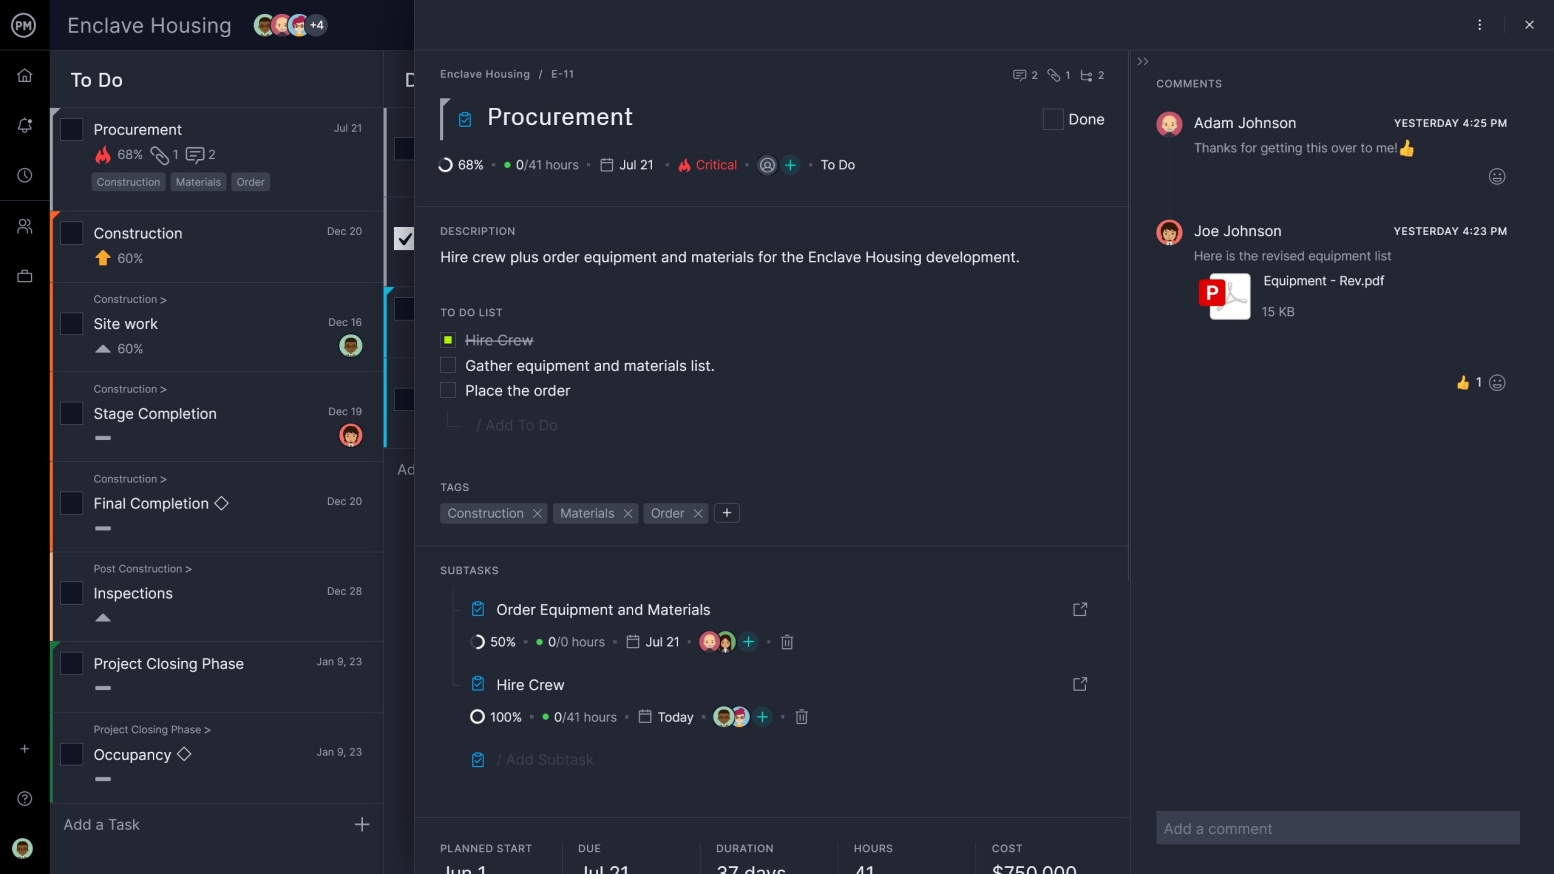
Collaborate with Kanban and Lists
Can a Gantt chart be more than just a plan and project schedule? With ProjectManager, yes! It allows teams to work better together. Teams can share documents and images added to the task. They can also comment at the task level, which keeps the discussion linked to the task and avoids the need to filter through endless emails. If team members don’t want to use the Gantt chart, they can switch to either the kanban board or task list view to manage their work.
Super-sized Gantt charts for Mac are only the beginning. With ProjectManager, the Gantt chart is part of a larger project management software; it’s not just a Gantt chart template for Excel or Google Sheets. There are streamlined timesheets and resource management features, too. This allows your Gantt chart to be part of a digital system working to control your project.
Related Content
- The Best Project Management Software for Mac Computers
- Microsoft Project for Mac: How to Run MS Project Files on Your Mac
- Best Planner Apps for Mac
- ¿Cómo hacer un diagrama de Gantt en un Mac?
- 5 outils pour créer un diagramme de Gantt sur Mac
ProjectManager is project management software for Mac and PC users that makes building Gantt charts fast and easy. Plus, it helps project managers plan, monitor and report on projects and gives project teams a collaborative platform to work more productively. See how it can help you build a dynamic Gantt chart on Mac devices and steer your next project to a successful end by taking this free 30-day trial.
