
A sales forecast template is a preformatted tool that helps businesses predict future revenue based on historical sales data, market trends and planned marketing activities. It provides a clear framework to estimate income, plan inventory, allocate resources and make strategic decisions. By projecting sales over weeks, months or years, businesses can identify seasonal trends, set realistic targets and anticipate cash flow needs, giving them greater control over growth and profitability.
This free sales forecast template for Excel makes it easy to organize your data, calculate totals automatically and visualize projections with charts and graphs. Designed for simplicity and flexibility, it allows users to enter historical sales, expected growth rates and product-specific estimates, producing an accurate forecast without complex formulas. Whether you are a small business owner, sales manager or financial planner, this template is a practical tool to help plan and make informed decisions about your revenue goals and business strategy.
Why Use a Sales Forecast Template?
A sales forecast template is a powerful tool for planning future revenue with confidence. By combining historical sales data, market trends and projected growth, it gives businesses a clear picture of expected income and potential shortfalls. With this insight, teams can set realistic targets, allocate resources effectively and avoid overproduction or inventory gaps, helping reduce financial risk and support smarter decision-making.
This template also makes collaboration seamless, ensuring sales, marketing and finance teams are aligned on goals and assumptions. Automated calculations and ready-to-share summaries save time and make it easy to present forecasts to management, investors or lenders. With all your data organized in one place, you can track projections, spot trends and adjust plans quickly as your business evolves.
For manufacturers, project management software takes sales forecasting to the next level by linking production schedules, inventory management and resource allocation directly to financial projections. You can see how changes in labor, material costs or capacity impact expected revenue, while real-time dashboards and scenario analysis let you respond quickly to demand shifts or supply chain challenges. This integration ensures forecasts are accurate, actionable and up-to-date.
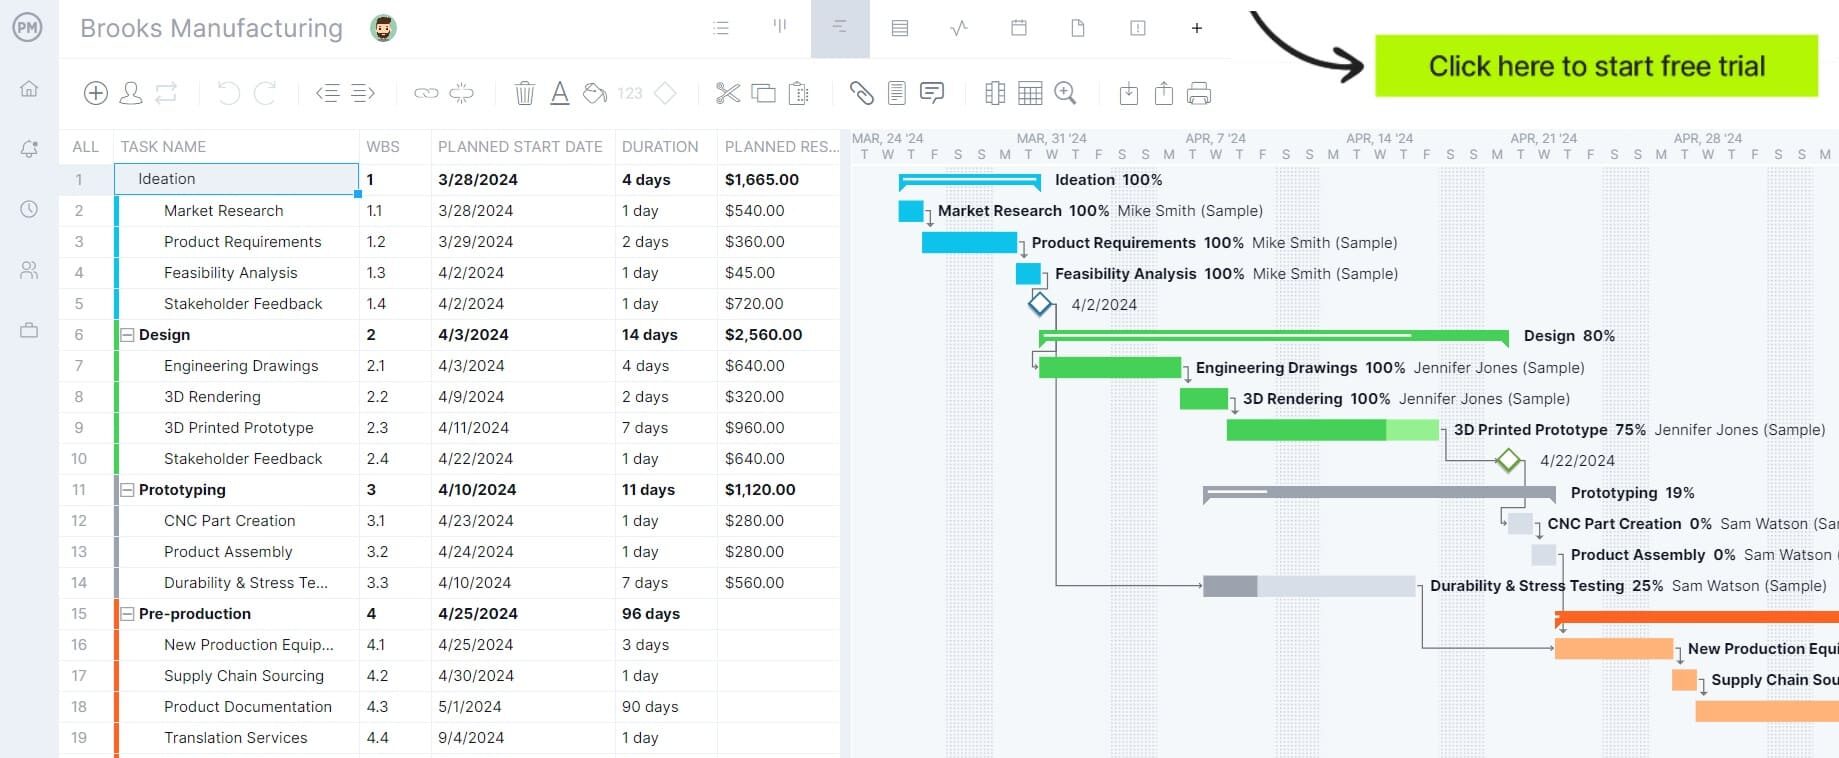
ProjectManager is the ideal solution for sales forecasting because it combines real-time data with robust planning tools. The Gantt chart shows sales targets alongside production milestones, dashboards track revenue against forecasts continuously, and resource management features reveal labor and material costs at a glance. Task lists break down individual product contributions, while customizable reports summarize performance by project, product or period. Multiple project views and automated updates give manufacturers full control, making it easy to plan, track and achieve their revenue goals. Get started with ProjectManager today for free.
When to Use a Sales Forecast Template
A sales forecast template should be used whenever a business needs to predict future revenue and plan accordingly. It is especially useful for the following.
- During budgeting and financial planning: To estimate income, plan expenses and allocate resources for the upcoming month, quarter or year.
- When launching new products or services: To project potential sales and assess feasibility before committing to production or marketing investments.
- For inventory and supply chain management: To anticipate demand and avoid overstocking or stockouts.
- When seeking funding or investors: To provide a clear, data-driven forecast of expected revenue and growth potential.
- For performance tracking: To compare actual sales against projected targets and adjust strategies proactively.
In short, a sales forecast template is essential any time you need to make informed business decisions based on expected sales trends and revenue projections.
Who Should Use This Sales Forecast Template?
This sales forecast template is ideal for a wide range of users who need to plan and track revenue accurately:
- Small business owners: To anticipate cash flow, set realistic sales goals and plan resources efficiently.
- Sales managers: To monitor team performance, track quotas and forecast revenue by product or region.
- Financial planners and accountants: To generate accurate projections for budgeting, reporting and investor presentations.
- Marketing teams: To align campaigns with projected sales and measure ROI effectively.
- Manufacturers and product-based businesses: To anticipate demand, manage inventory and plan production schedules.
Anyone who wants to make informed decisions, reduce financial risk and plan strategically for growth can benefit from using this template.
How to Use This Sales Forecast Template for Excel
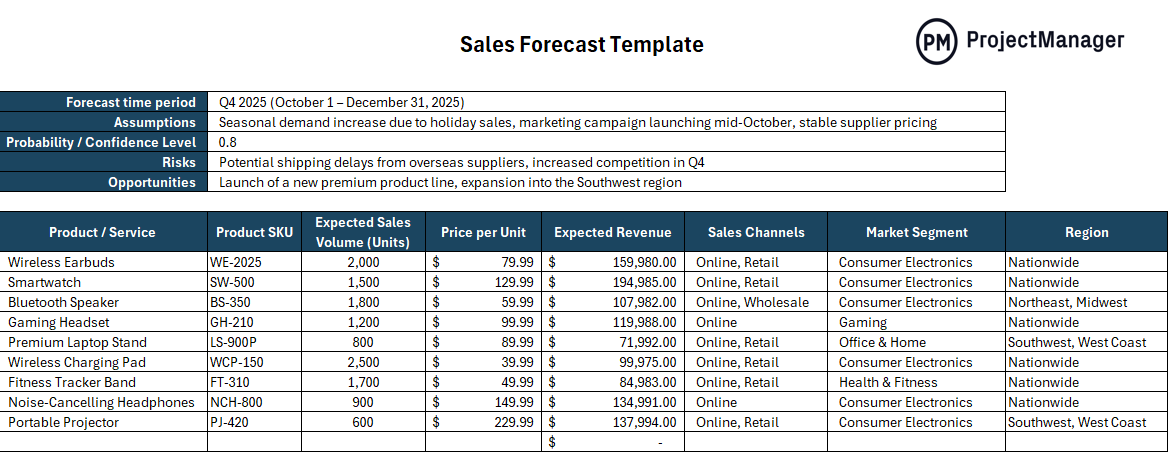
This sales forecast template is designed to help businesses project sales revenue over a set period, account for seasonal trends and prepare for opportunities or risks in advance. By filling out each section carefully, you can create a realistic and data‑driven sales outlook, which is essential for inventory planning, budgeting and strategic decision‑making.
The template is split into two main areas: a forecast overview section (with details on the period, assumptions, probabilities, risks and opportunities) and a sales projection table (which breaks down estimated performance per product or service). Below is a step‑by‑step guide to completing it by following the column headings.
Step 1: Define the Forecast Period
In the Forecast time period field, specify the exact dates that the forecast will cover. For example, “Q4 2025 (October 1 – December 31, 2025).” This ensures that all projected sales figures are tied to a clear timeframe.
Step 2: Outline Key Assumptions
In the Assumptions section, note any factors you expect to influence sales during the forecast period, such as seasonality, promotional campaigns, supplier pricing stability or market trends. These assumptions provide context for your numbers and allow you to adjust projections if circumstances change.
Step 3: Set the Probability / Confidence Level
Enter a Probability / Confidence Level (e.g., 0.8 for 80%) to indicate how confident you are in your projections based on available data. This helps in risk assessment and prioritization of resources.
Step 4: Identify Potential Risks
In the Risks section, list external or internal challenges that could negatively affect sales—such as shipping delays, supply shortages or increased competition. This awareness helps in developing contingency plans.
Step 5: Highlight Growth Opportunities
The Opportunities section is for identifying factors that may boost revenue, such as launching a new product line, entering a new market region or expanding distribution channels.

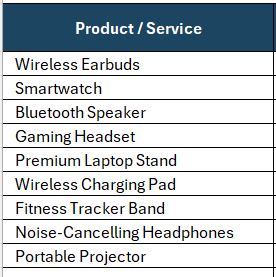
Step 6: List Products or Services
In the Product / Service column, enter the names of the products or services you are forecasting. This creates a clear breakdown for each offering.
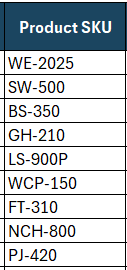
Step 7: Add Product SKU
Record the Product SKU for each product or service. This unique identifier ensures accurate tracking and helps link the forecast to inventory systems.
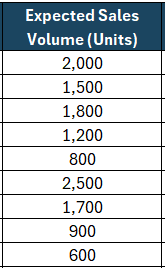
Step 8: Estimate Expected Sales Volume (Units)
Fill in the Expected Sales Volume (Units) column with the number of units you anticipate selling during the forecast period for each product or service.
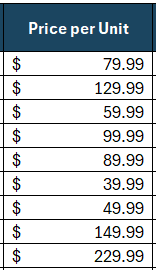
Step 9: Input Price per Unit
In the Price per Unit column, provide the selling price for each item. This will be used to calculate expected revenue.
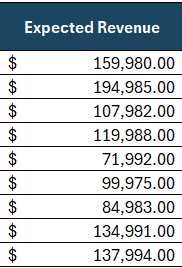
Step 10: Calculate Expected Revenue
Multiply the expected sales volume by the price per unit to determine Expected Revenue. The template shows this calculation, but double‑check for accuracy.
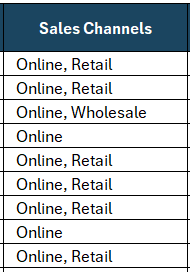
Step 11: Specify Sales Channels
Indicate the Sales Channels through which the product will be sold—such as online, in retail stores, or wholesale. This helps in analyzing performance by channel.
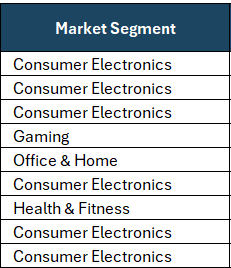
Step 12: Define the Market Segment
Identify the Market Segment for each product (e.g., consumer electronics, gaming, health & fitness). This allows you to see which segments drive the most revenue.
Step 13: Note the Region
Record the Region where sales are expected—whether nationwide, regional or multi‑regional. This is useful for geographic sales analysis and marketing focus.

Related Manufacturing Templates
Using a sales forecast template is good, but there are many other manufacturing, sales and business-related templates that are free to download and use immediately as well. Below we’ve selected just a few from the over 100 free project management templates available on our site.
Sales Order Template
Download this free sales order template to confirm and record a customer’s purchase after an order has been placed. It serves as an internal document that outlines the details of the transaction, ensuring accuracy between sales, inventory and accounting teams.
Inventory Template
Use this free inventory template to record, track and manage stock levels in a business. It provides a structured way to organize details about products, raw materials or supplies so managers can monitor what is available, what needs restocking and what is moving slowly.
Profit and Loss Statement Template
This free profit and loss template is a preformatted document that helps businesses calculate whether they are making a profit or incurring a loss over a specific period. It organizes income and expenses in a clear structure, allowing business owners and managers to see how revenue is converted into net profit.
ProjectManager Is Better for Manufacturers Than Templates
ProjectManager offers manufacturers more flexibility and insight than static templates because it brings all project and budget data into one connected platform. Beyond Gantt charts, it provides multiple project views such as kanban boards, task lists and calendars, which allow teams to see work in progress, track deadlines and organize tasks according to the needs of different departments. These views give manufacturers the ability to track production schedules, monitor sales commitments and align teams across the entire operation.
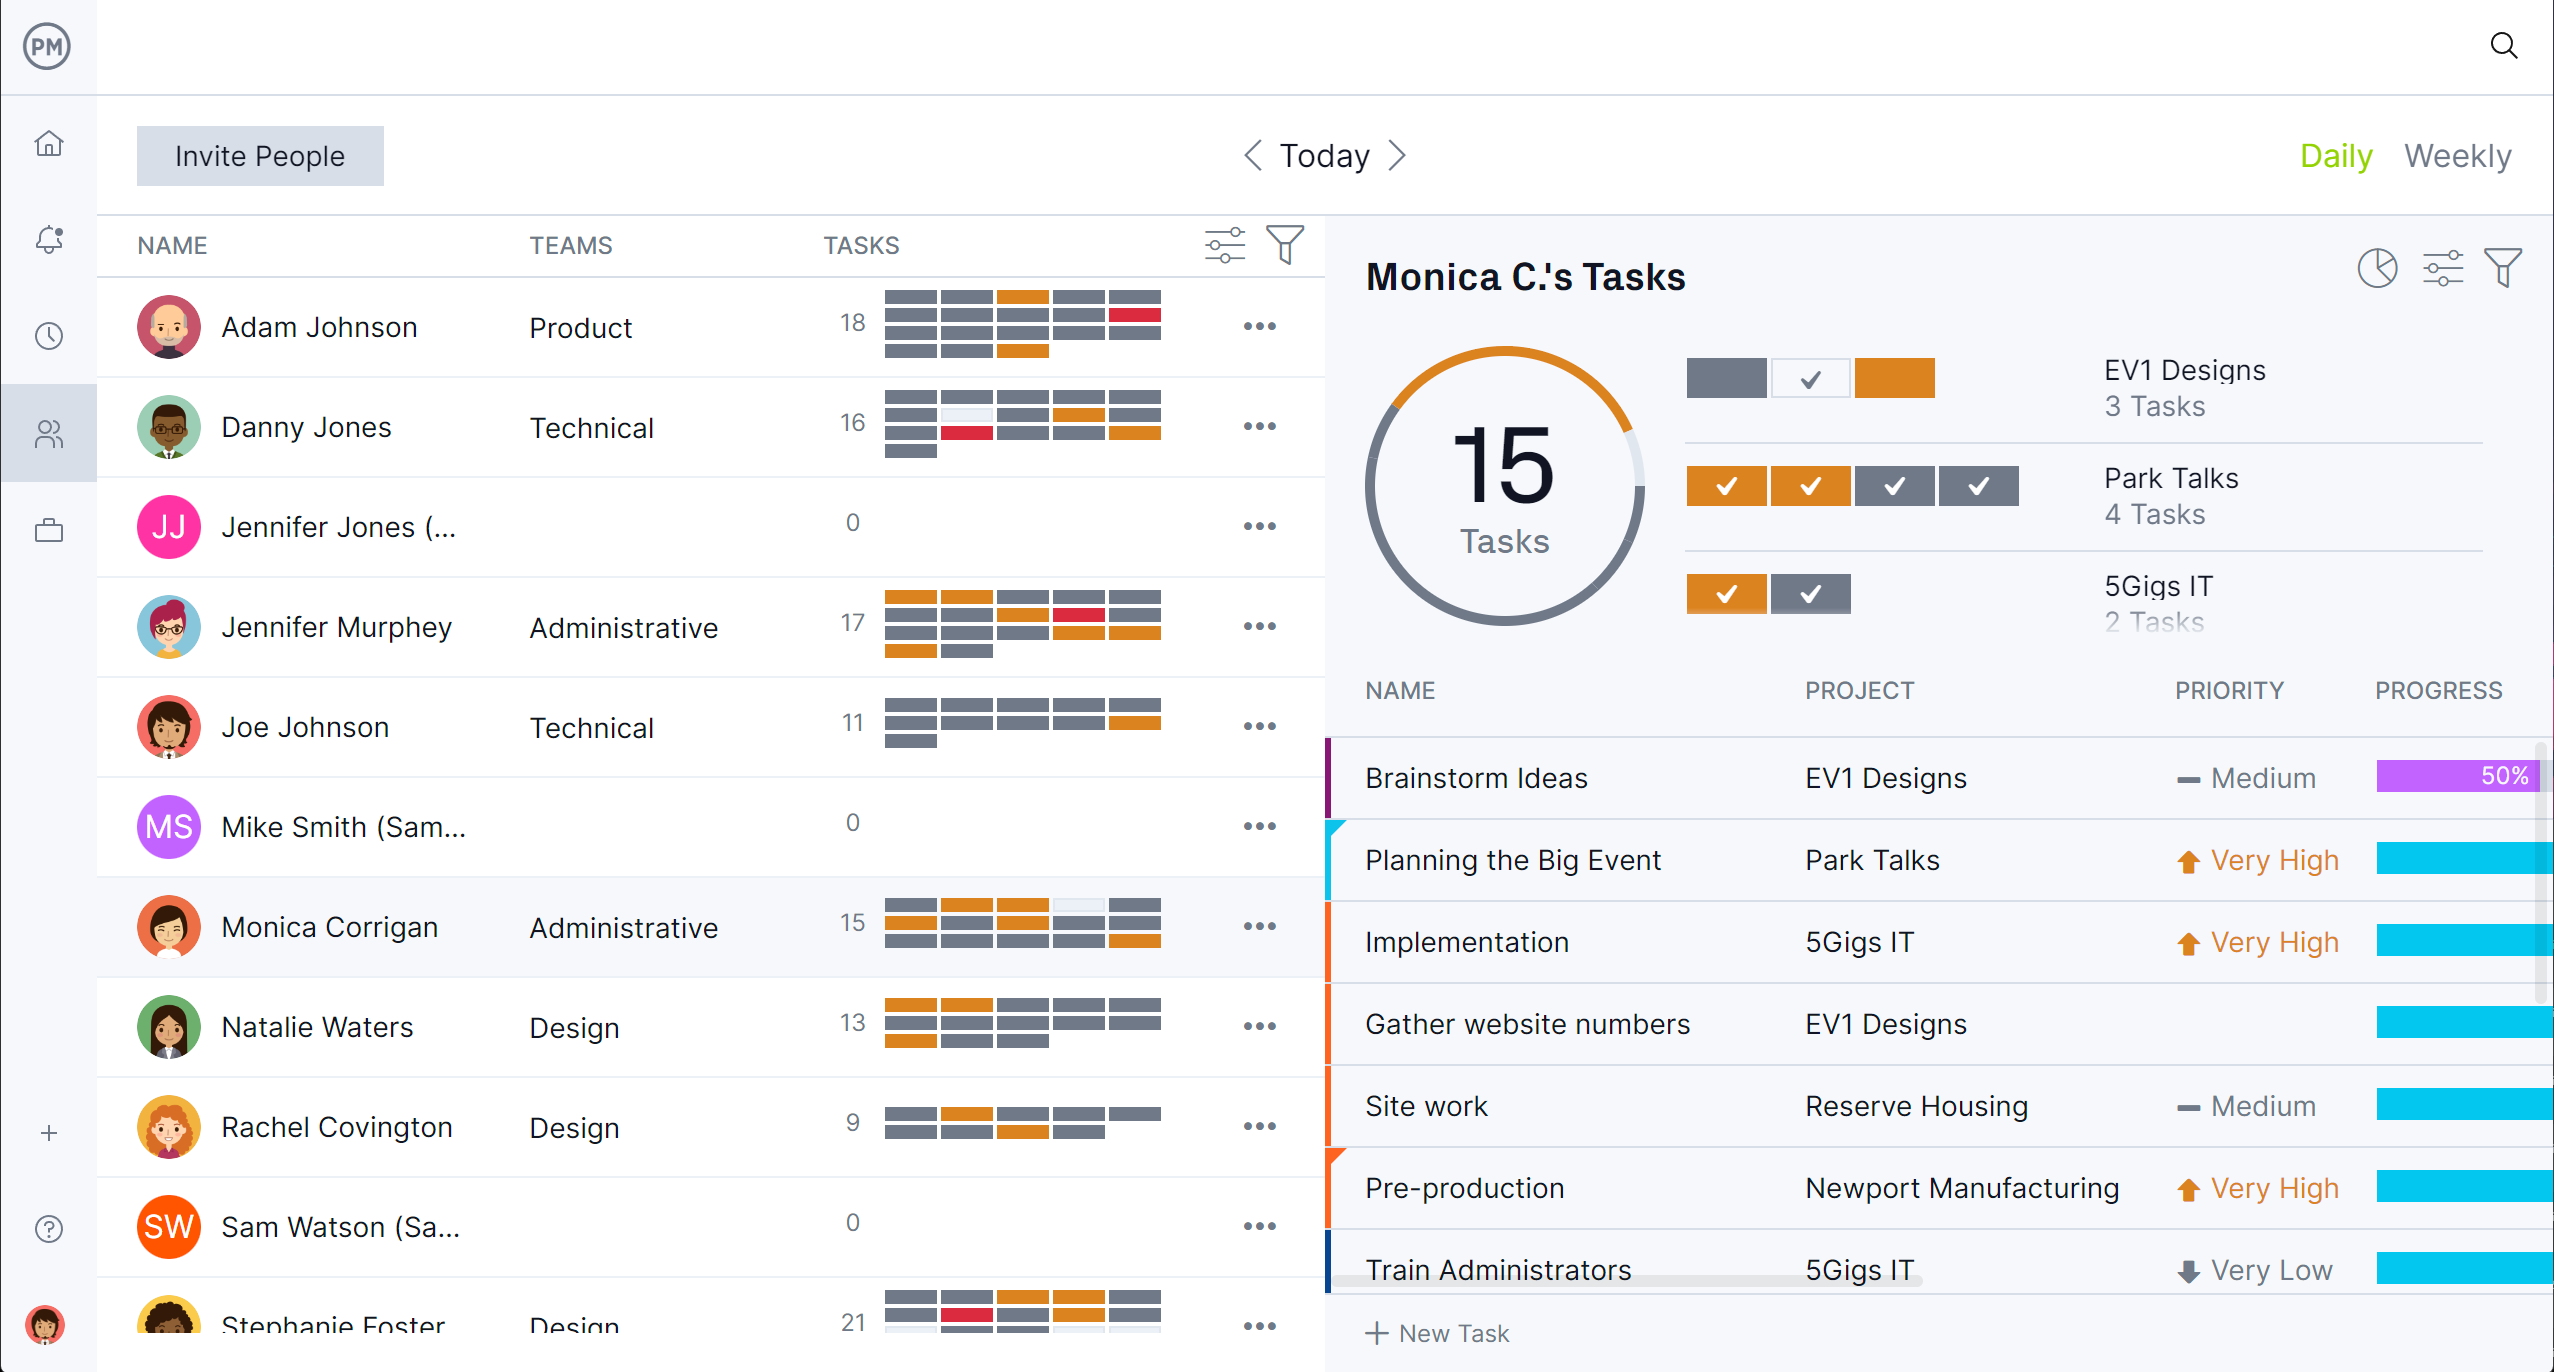
Manage Resources Effectively
Manufacturers can also manage labor and materials in ways that templates cannot. The availability tools show who is free to take on tasks, while the color-coded workload chart makes it easy to spot overallocated team members and balance assignments quickly.
On the team page, managers can view every worker’s schedule, responsibilities and progress at a glance, ensuring resources are allocated where they will have the most impact on efficiency and budget control.
Track Performance in Real Time
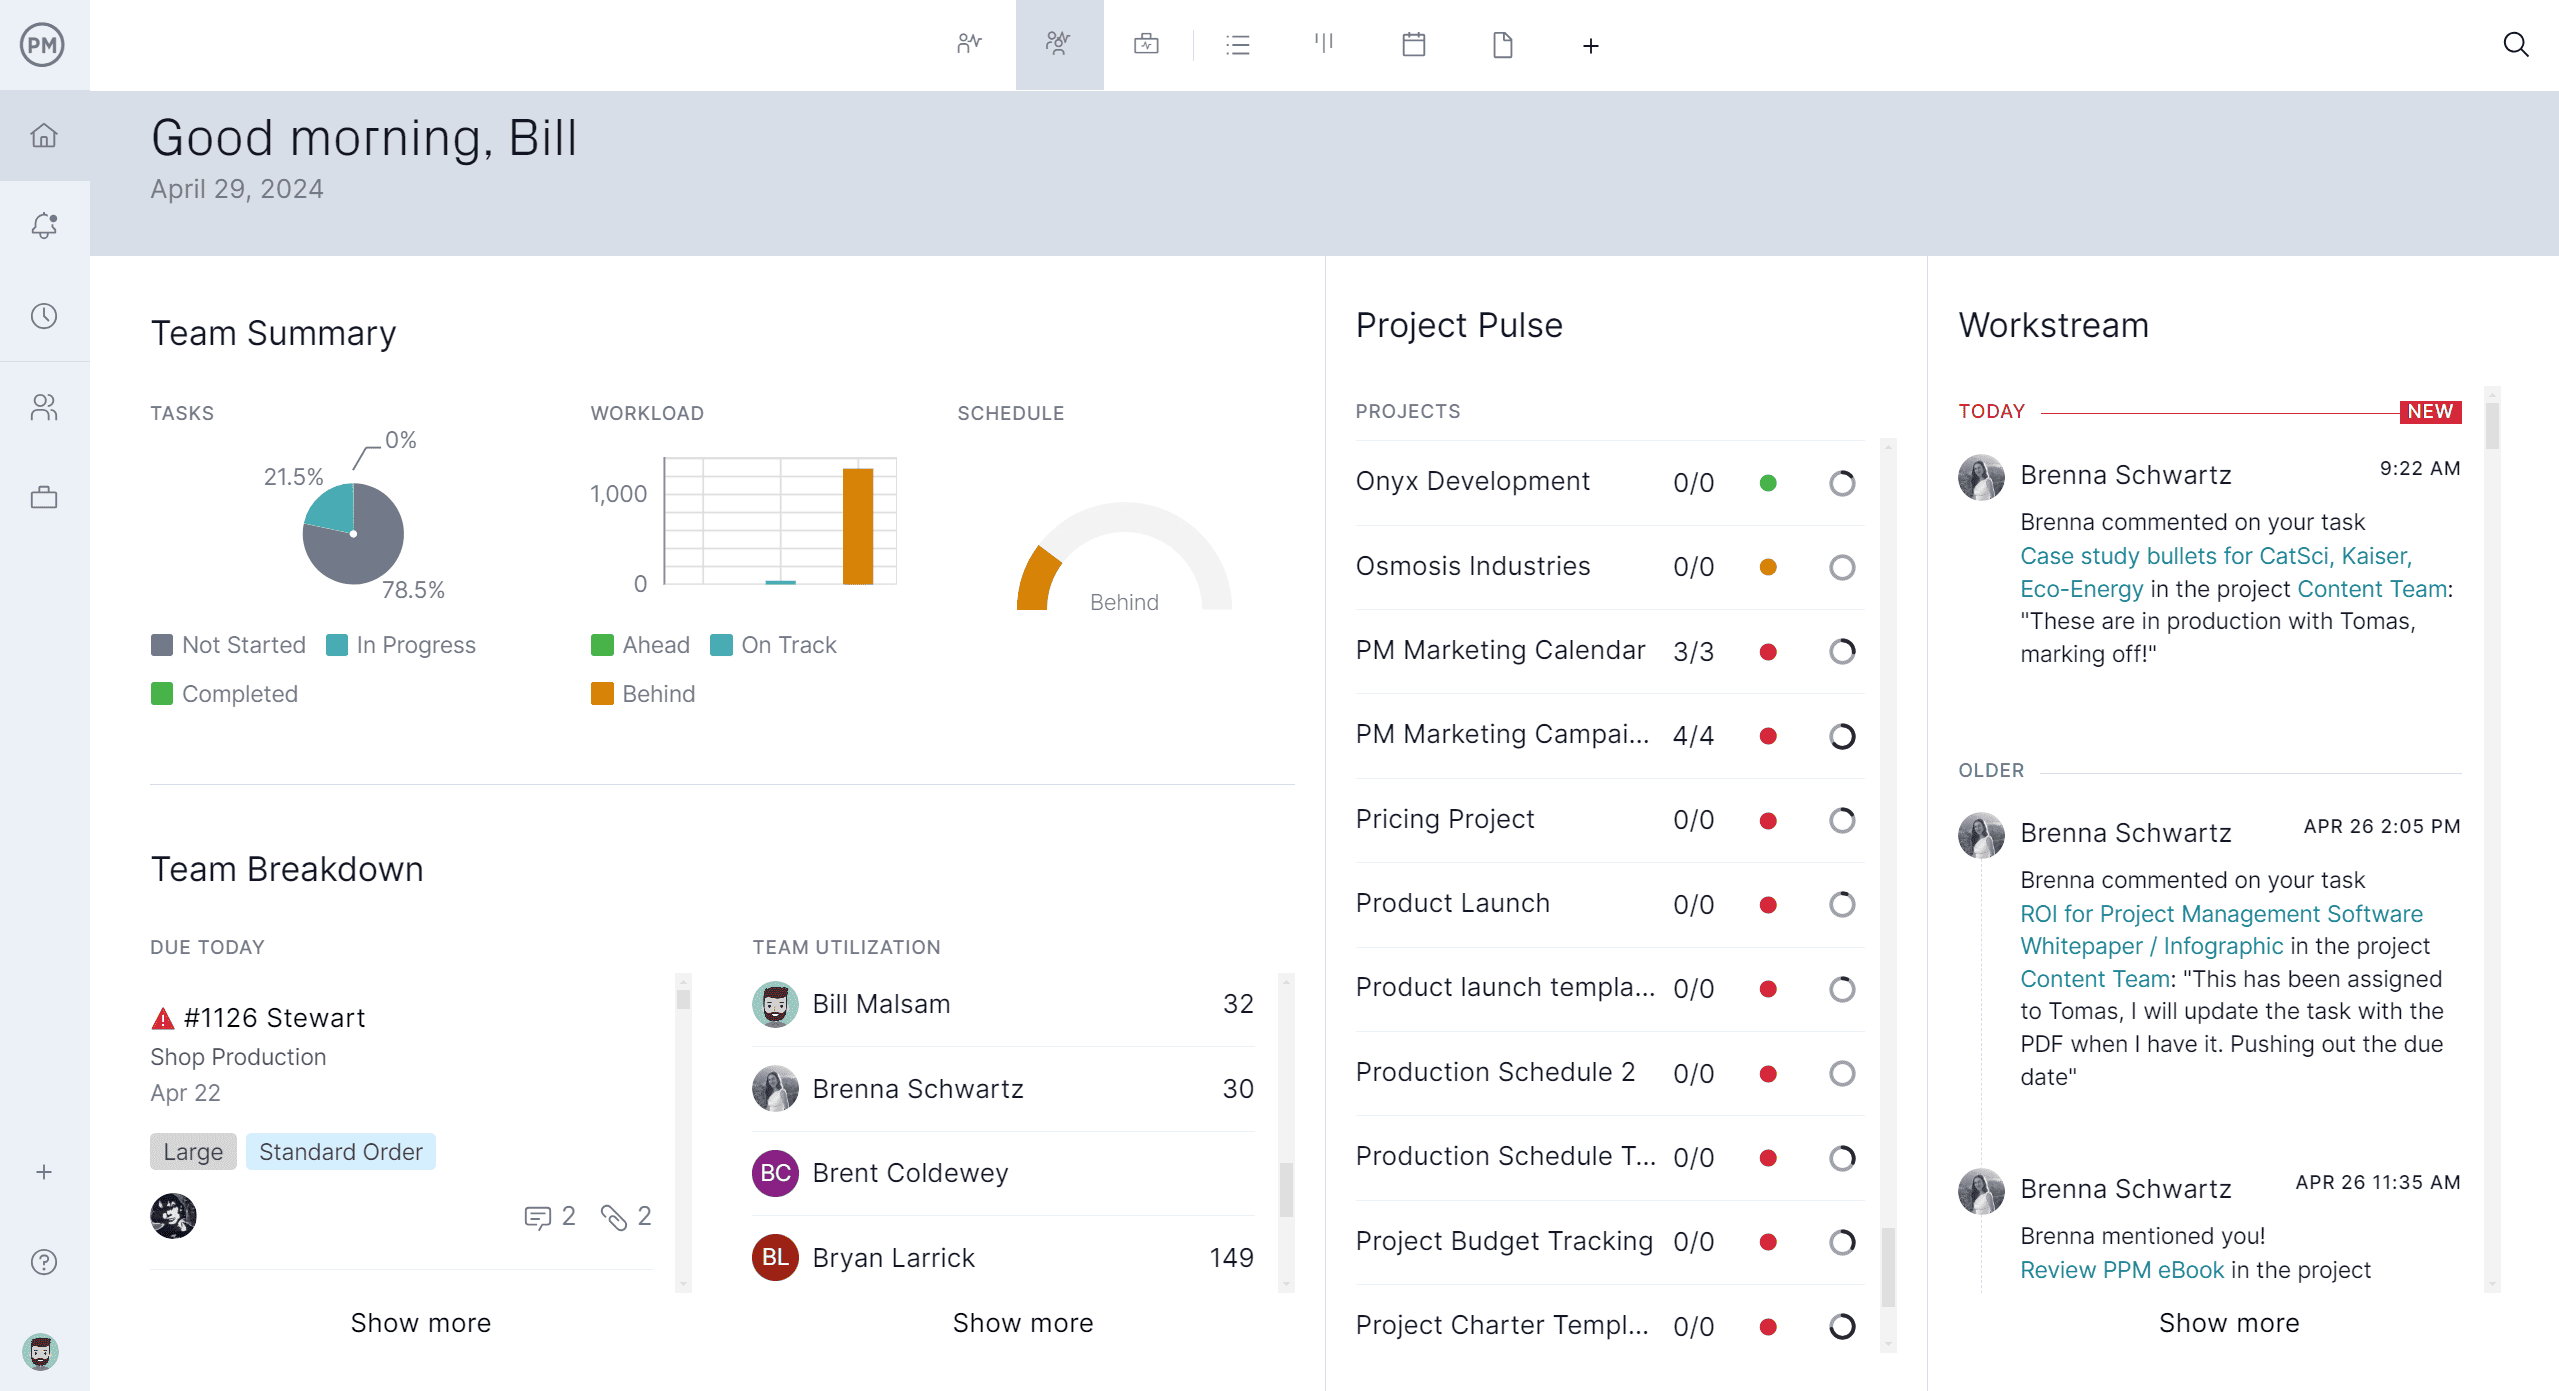
Templates require manual updates, but our software delivers continuous tracking with powerful built-in features. Real-time project and portfolio dashboards give manufacturers instant visibility into costs, schedules and production progress.
Customizable reports allow managers to drill down into specific areas like labor hours, materials or sales targets, while secure timesheets connect actual work hours directly to project costs. Together, these tracking tools provide manufacturers with accurate, up-to-the-minute data to guide decisions and improve profitability.
Related Manufacturing Content
A sales forecast template is only part of the larger manufacturing process. For those curious to read more about this industry and how project management tools and techniques can help facilitate work, below are some recently published blogs on the topic.
- 20 Production and Manufacturing KPIs & Metrics (With Examples)
- Production Scheduling Basics: Creating a Production Schedule
- Manufacturing Overhead: Definition, Formulas and Examples
- Manufacturing Process Planning: Steps, Types & Benefits
- Manufacturing Operations Explained
ProjectManager is online project and portfolio management software that connects teams, whether they’re in the office or out in the field. They can share files, comment at the task level and stay updated with email and in-app notifications. Join teams at Avis, Nestle and Siemens who are using our software to deliver successful projects. Get started with ProjectManager today for free.