Smartsheet is software that has built its entire platform on the familiar landscape of spreadsheets. While it does more than a traditional Excel spreadsheet, does it have the features that project managers and their teams need to track work and stay on schedule and budget? Of course, we’re referring to a Smartsheet dashboard.
To find out if there is a Smartsheet dashboard and, if so, how powerful it is, we’re going to test drive the software. We’ll determine the value of its tracking features and review the pros and cons to make sure that potential users looking for dynamic project management software are steered in the right direction.
What Is Smartsheet?
Smartsheet is a cloud-based work management platform designed to help teams plan, track and execute projects of all sizes. It combines the familiar look of a spreadsheet with project management features, making it easy for users to collaborate, automate workflows and share real-time updates. The platform is used across industries for tasks ranging from simple to-do lists to complex portfolio management.
Smartsheet supports a wide range of project management needs by offering multiple views, including grid, Gantt chart, card and calendar. This flexibility allows teams to choose the best way to visualize and organize their work. The platform also integrates with popular apps like Microsoft Teams, Google Workspace, and Salesforce, allowing information to flow easily between systems.
That leads us to ask if there is a Smartsheet dashboard? Dashboards are essential visual tools that provide a high-level overview of the project’s key metrics, such as time, cost, resources and more. Dashboards help project managers, teams and enable stakeholders to track progress, monitor KPIs and make data-driven decisions without sifting through multiple documents or emails.
Does Smartsheet Have a Dashboard?
A Smartsheet dashboard would be a deal breaker for any project management team looking for a software solution that can help it plan, manage and track its work. This tool is part of any thoroughly designed project management software product. Of course, just having a dashboard is often not enough. Many tools have them, but they’re lacking in features.
If there is a Smartsheet dashboard, great, but we’re going to take it for a spin and see if it delivers on the promise of making it easy for project managers to monitor their projects. We’ll get into the specifics of what the features are that lift a regular dashboard into a must-have project management tool. But first, let’s get to answering our initial question.
Short Answer: Yes, Smartsheet Has a Dashboard
The Smartsheet dashboard is part of the work management software, but everything must be customized, which takes away valuable time from the actual management of the project. That means the dashboard must be manually configured, taking a lot of time. This wouldn’t be such a problem except for the fact that some competitors have a dashboard that automatically collects live data without any lengthy setup process.
Long Answer: Smartsheet Dashboards Lack Key Features for Project Management
The Smartsheet dashboard can feel limited compared to more advanced business intelligence tools. Building complex visualizations often requires manual setup and linking to multiple sheets, which can become time-consuming, as we’ve said. These and other drawbacks often lead users to look for a Smartsheet alternative.
There are also customizable reports to share with stakeholders, multiple project views for different workloads, secure timesheets, version control, automated workflows with task approval settings and powerful resource management tools to keep teams productive. Get started with ProjectManager today for free.
Smartsheet Dashboard Features
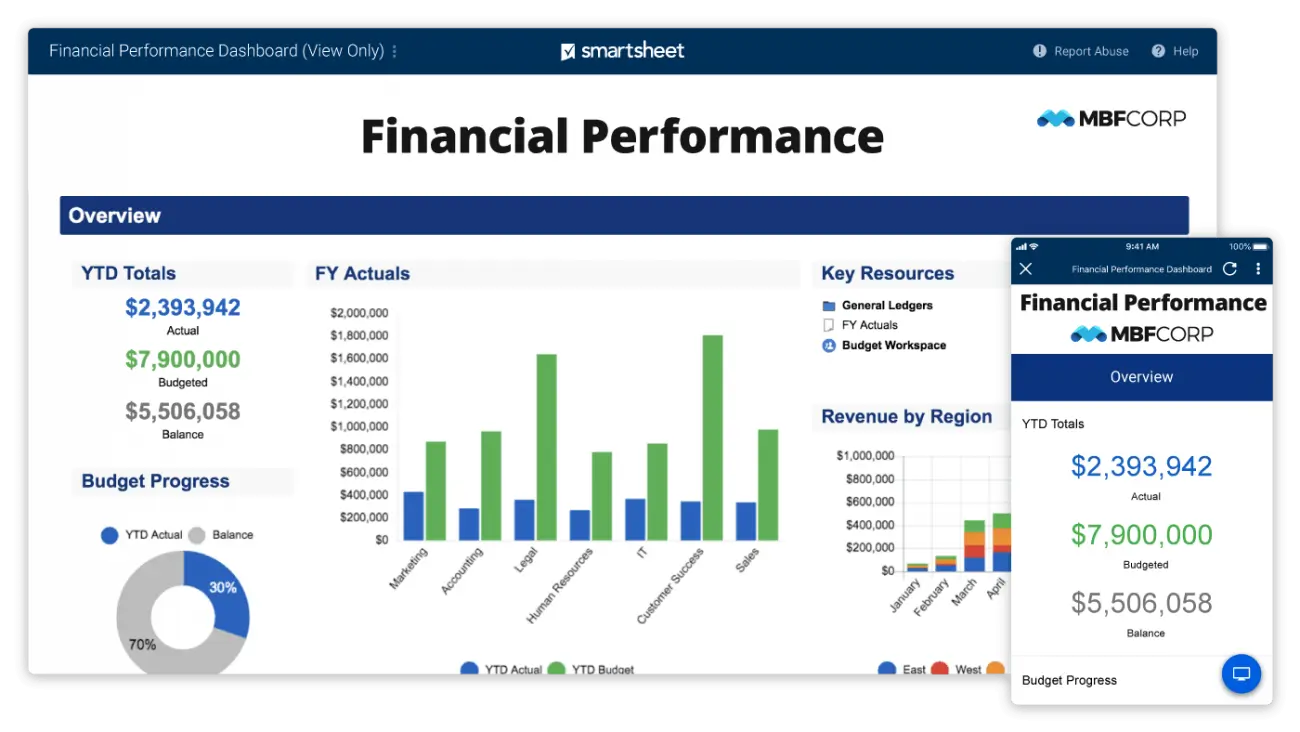
The Smartsheet dashboard provides a clear, real-time view of project data through customizable widgets that display live information from sheets and reports. It centralizes charts, reports, text, and images in one visual hub, making it easy to track performance, share updates, and keep stakeholders aligned across multiple workspaces and projects.
- Smartsheet dashboard is built from configurable widgets that display live data from sheets and reports.
- Widgets can be customized in layout, color, alignment and behavior.
- Chart widget supports multiple chart types including line, bar, stacked bar/column, pie, donut and scatter.
- Image widget allows the inclusion of logos, photos or other images.
- Web content widget embeds external content such as forms, videos, or dashboards from Power BI or Tableau.
- Dashboards can be shared with stakeholders, published as public links or embedded on other sites.
- Widgets show real-time data that updates automatically when the source sheet or report changes.
- Dashboards are viewable on the Smartsheet mobile app.
- Supports embedding and integration of third-party tools and content.
What Project Management Features is Smartsheet Dashboard Missing?
While the Smartsheet dashboard is visually powerful, it lacks deeper project management functionality. It doesn’t track planned versus actual performance, workload balance, or cost variance. These gaps make it better suited for surface-level visibility than detailed project monitoring or performance evaluation.
- Dashboards can’t compare planned vs. actual schedule or cost performance.
- No built-in tools for cost tracking.
- Workload and resource balancing visuals are unavailable.
- Dashboards don’t forecast completion dates or trends.
- Limited interactivity; no drill-down or live filtering.
- Portfolio-level rollups require manual setup or premium add-ons.
- KPI thresholds and color-coded alerts can’t be automated.
- Data refresh intervals can’t be adjusted.
- Conditional access and user-specific visibility are missing.
- Global filters across all widgets aren’t available.
- Export options are limited to printing or sharing links.
- Cumulative progress metrics over time require manual setup.
How to Make a Smartsheet Dashboard Better With ProjectManager
If you’re using a Smartsheet dashboard and feeling its limitations, there’s a workaround. You can turn that lacking tool into an advanced project and portfolio management dashboard by importing your project into ProjectManager.
That not only improves your dashboard game but also gives you access to our robust suite of powerful project management tools. Start a free 30-day trial with ProjectManager, no credit card needed, to see the difference. Then follow these steps.
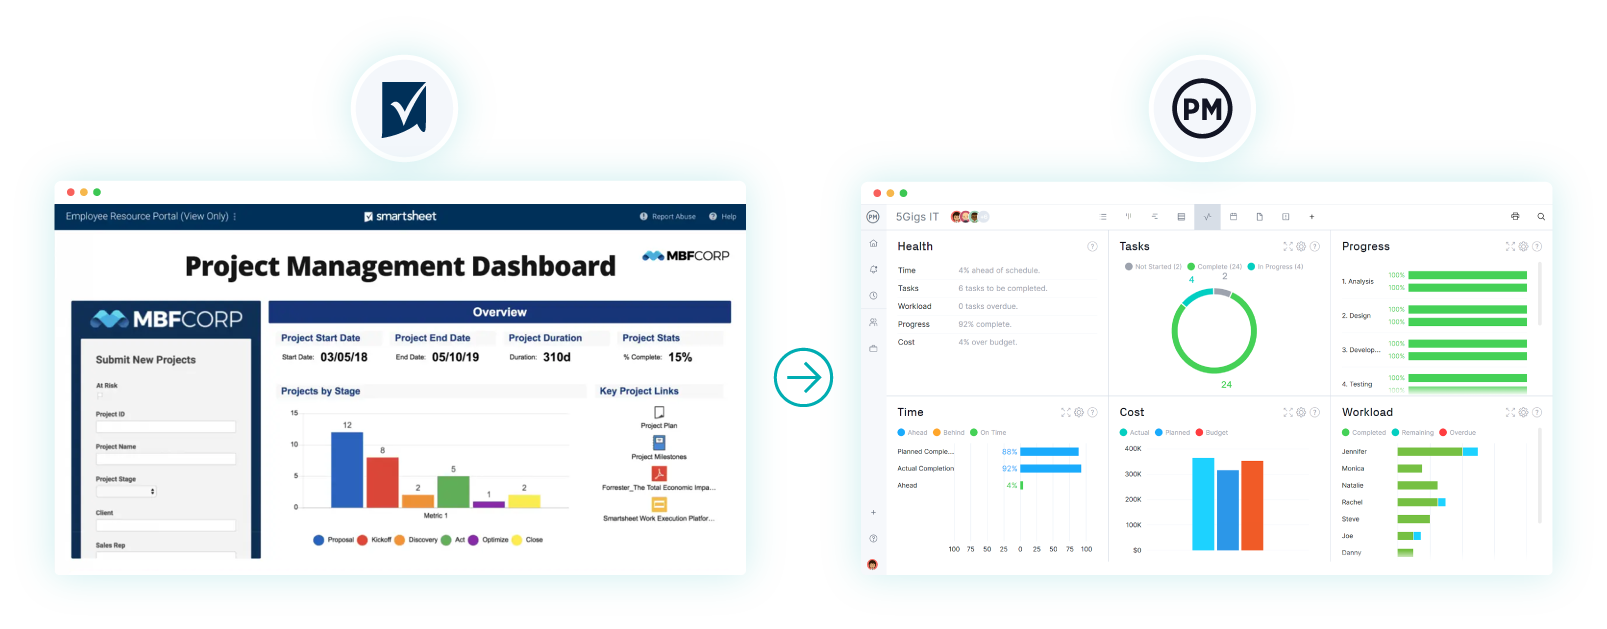
To do so, you can export the data from your Smartsheet project as a CSV file and then import that data into ProjectManager so you can enjoy a better project management experience and use a better project dashboard.
| Smartsheet Dashboard | ProjectManager Dashboard |
| Centralized dashboards built from configurable widgets ✅ | Real-time dashboards with panels for cost, time, workload, and progress ✅ |
| Supports multiple chart types (bar, line, pie, donut, scatter) ✅ | Offers various visualizations, including time-based charts and performance gauges ✅ |
| Widgets display live data from sheets, reports, and summaries ✅ | Dashboards pull real-time data directly from projects, tasks, and portfolios ✅ |
| Rich text, image, web content, and shortcut widgets supported ✅ | Widgets include project metrics, cost tracking, workload, and risk indicators ✅ |
| Dashboards can be shared or published as public links ✅ | Dashboards can be shared with teams, clients, or executives via secure links ✅ |
| Real-time updates reflect changes in source sheets ✅ | Automatically syncs with live project data for real-time reporting ✅ |
| No planned vs. actual schedule or cost variance tracking ❌ | Tracks planned vs. actual performance, budget variance, and baseline comparisons ✅ |
| No workload or resource balancing visuals ❌ | Displays workload and resource utilization across multiple projects ✅ |
| Portfolio-level dashboards require manual setup ⚠️ | Built-in portfolio dashboards with real-time cross-project data ✅ |
| Limited interactivity and no live drill-downs ❌ | Interactive dashboards with drill-down functionality and filtering ✅ |
| No formula-based or calculated metric widgets ❌ | Supports calculated KPIs, formulas, and custom data metrics ✅ |
| Limited layout customization for widgets ❌ | Drag-and-drop widget customization and layout editing ✅ |
| Export limited to printing or public links ❌ | Export dashboards to PDF, Excel, or image formats ✅ |
| No automation or KPI alert integration ❌ | Includes real-time KPI tracking, alerts, and automated updates ✅ |
| Data updated in real time ✅ | Fully automated real-time synchronization across all dashboards ✅ |
1. Export Your Smartsheet Project
The first step is to export your project from Smartsheet into a compatible format. Smartsheet allows you to export data as an Excel file, which is the easiest way to move it into ProjectManager. Open your Smartsheet project, go to the file menu and choose the option to export as Excel. Save the file somewhere easily accessible.
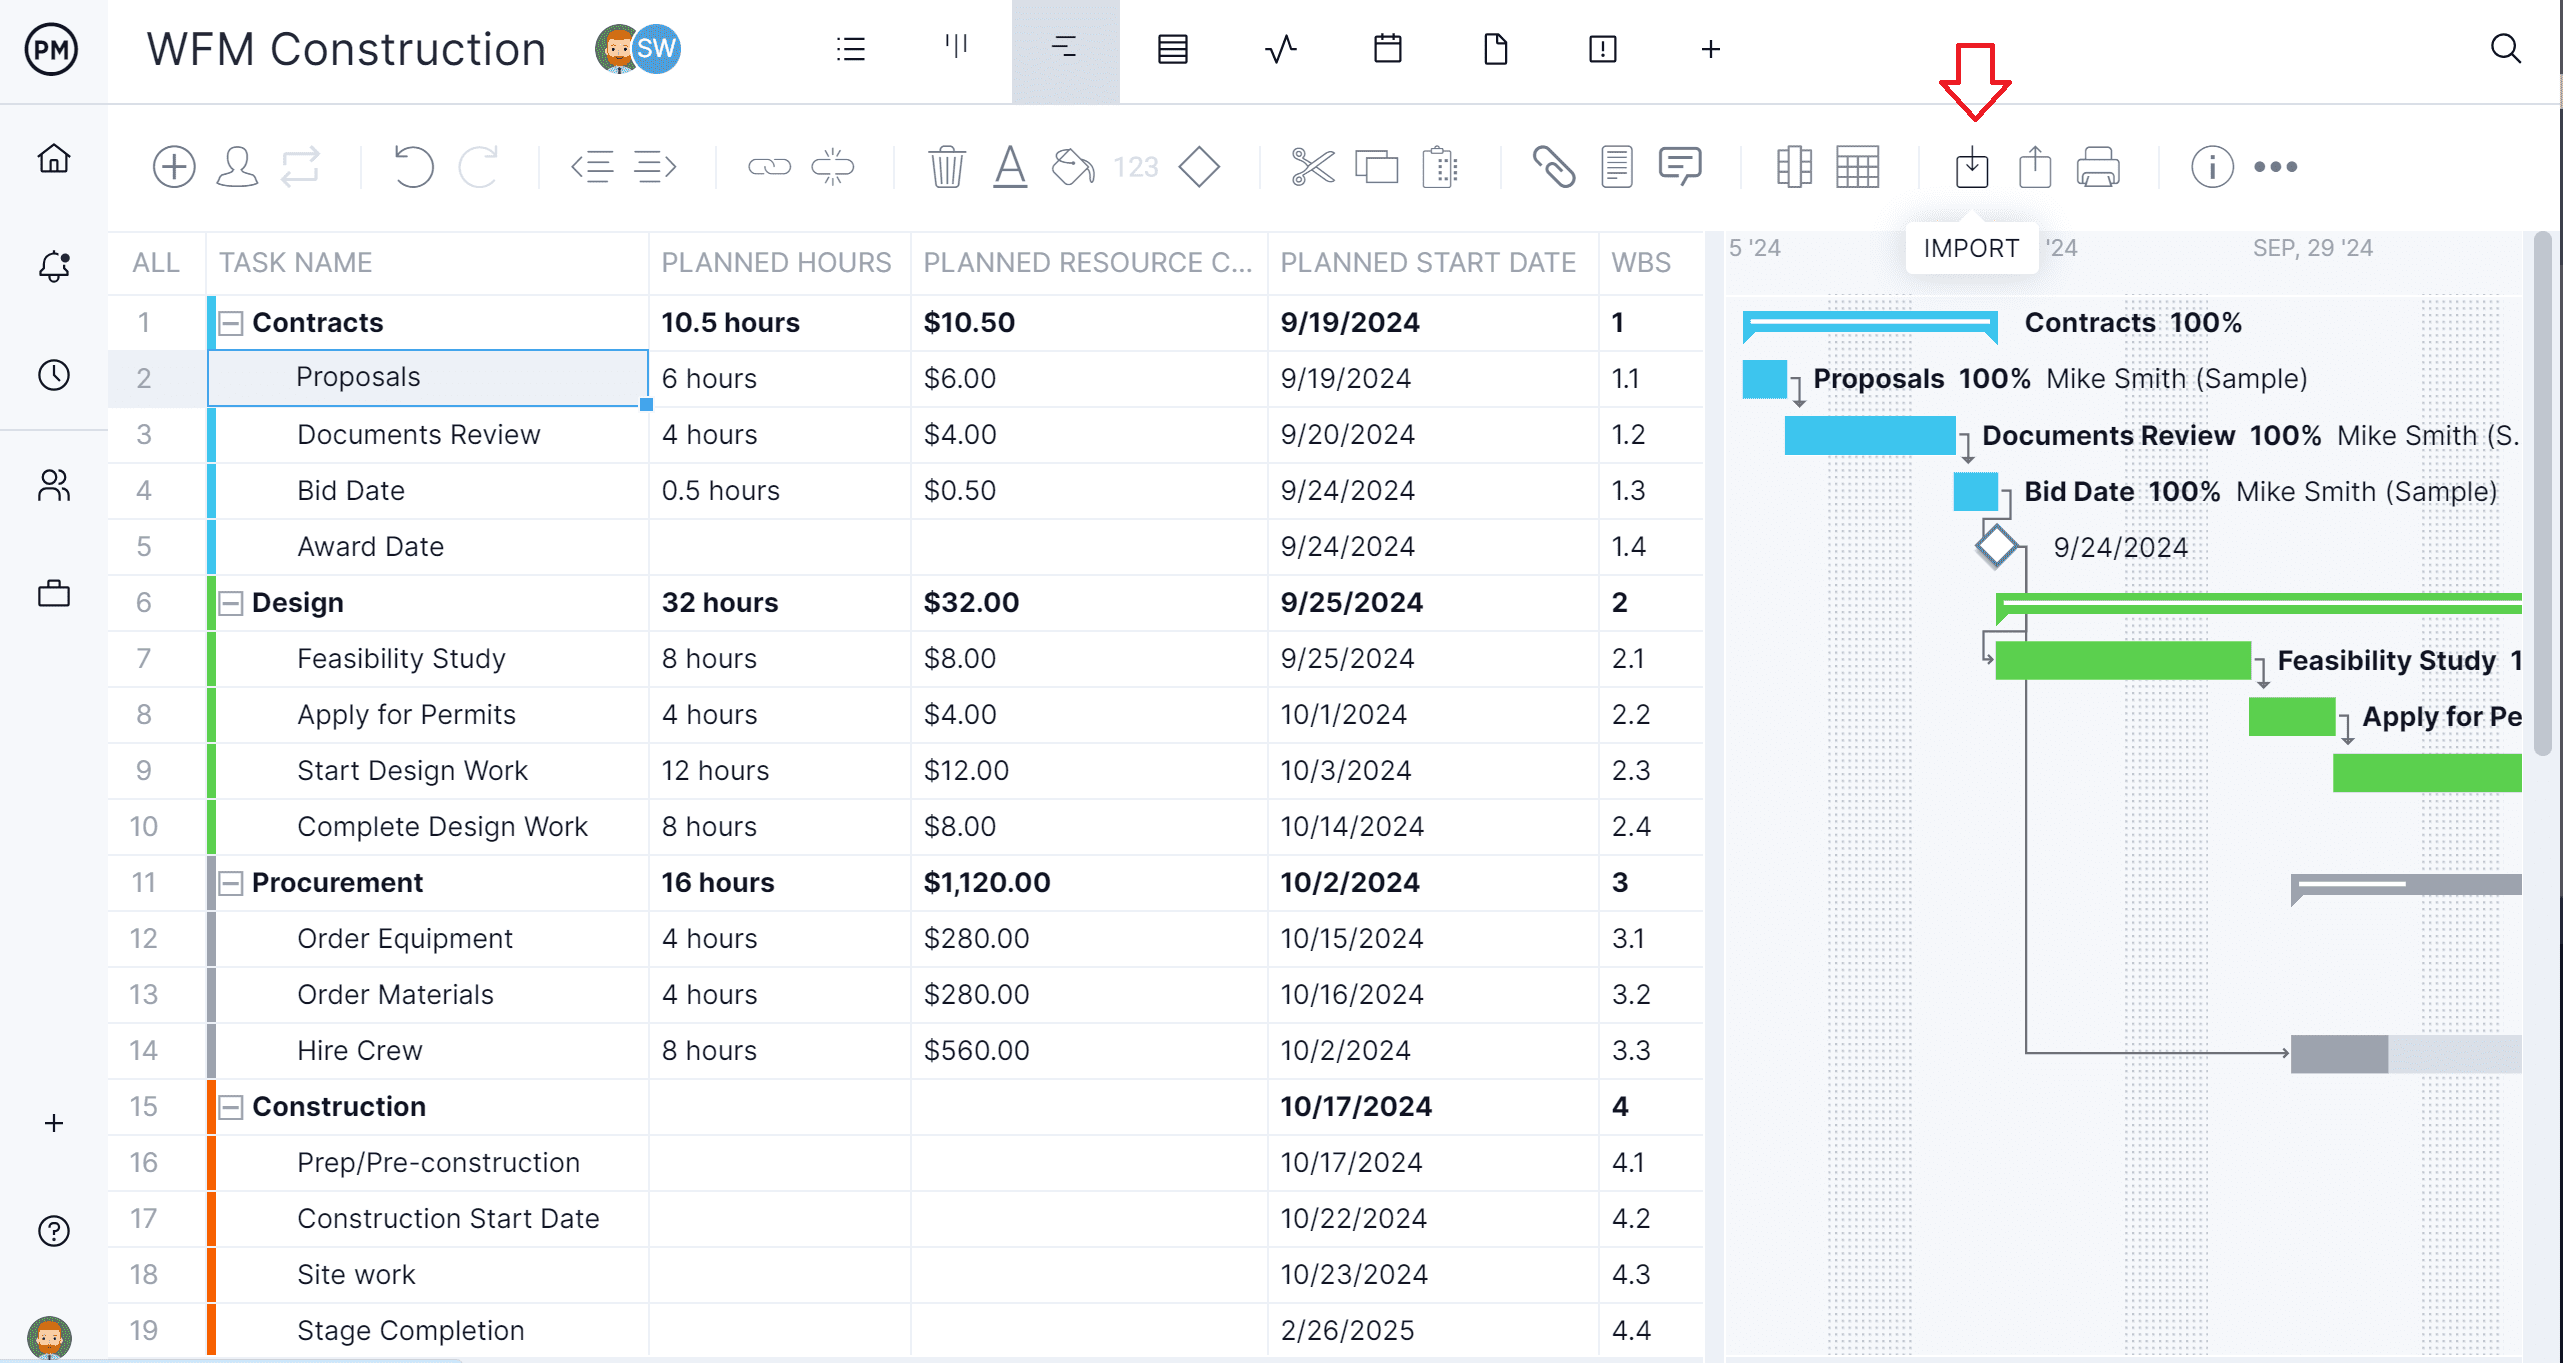
2. Select the Excel File and Import It into ProjectManager
In ProjectManager, go to the import section and select the option to upload an Excel file. Locate the file you exported from Smartsheet and select it. ProjectManager will recognize the spreadsheet and prepare the data for mapping into the new system.
3. Add the Data to a New or Existing Project
You can decide whether you want to create a new project in ProjectManager using your imported data or merge it into an existing one. Creating a new project ensures all the imported tasks, deadlines and assignments are organized from scratch. Merging with an existing project can be useful if you’re combining multiple data sources.
4. Choose What Data to Import
ProjectManager allows you to select which data fields you want to import from Smartsheet. You can include task names, deadlines, assignees, dependencies and more. This flexibility helps ensure you only import the most relevant information and keep your new project file streamlined.
5. Success! View Smartsheet Dashboard Data in ProjectManager
Once the import process is complete, you’ll be able to see your former Smartsheet dashboard data inside ProjectManager. From here, you can take advantage of ProjectManager’s advanced features such as multiple project views, resource tracking and real-time dashboards to enhance visibility and improve project performance.
Smartsheet Dashboard Pricing
The dashboard feature in Smartsheet is included starting from the first paid tiers—there is no permanently free plan that offers full dashboard access. This means that teams relying on dashboards must be on a paid plan, which could be a barrier for very small teams or individuals.
- Free Plan: Smartsheet dashboard is not included in this pricing plan.
- Pro Plan ($9/user/month, billed annually): Smartsheet dashboard is included in this pricing plan but limited to a maximum of ten widgets per dashboard.
- Business Plan ($19/user/month, billed annually): Smartsheet dashboard is included in this pricing plan with higher widget limits, advanced sharing options, and more customization features.
- Enterprise Plan (custom pricing): Smartsheet dashboard is included in this plan with full platform functionality, unlimited widgets, enhanced governance, and enterprise-level controls.
What Can You Use a Smartsheet Dashboard For?
The Smartsheet dashboard provides a convenient way to view project data at a glance. It brings together charts, reports and metrics from different sheets to create a clear visual snapshot of current progress. For quick status checks or high-level updates, it’s a useful feature that helps teams stay informed without having to navigate multiple files.
However, that’s about as far as its capabilities go. The Smartsheet dashboard doesn’t offer advanced project monitoring functions such as comparing planned versus actual performance, assessing cost or schedule variance, or tracking team productivity. It can’t be used to balance workloads or forecast project outcomes either.
The data it presents is static, giving only a surface-level picture rather than deep performance insights. While it looks professional and simplifies reporting, the Smartsheet dashboard ultimately lacks the analytical depth required for real project monitoring and performance evaluation.
Smartsheet Dashboard Example
Let’s prove our point by showing exactly how limited this software is by illustrating with a Smartsheet dashboard example. Below is a screenshot of what one looks like, and on first glance, it’s clear how limited it is.
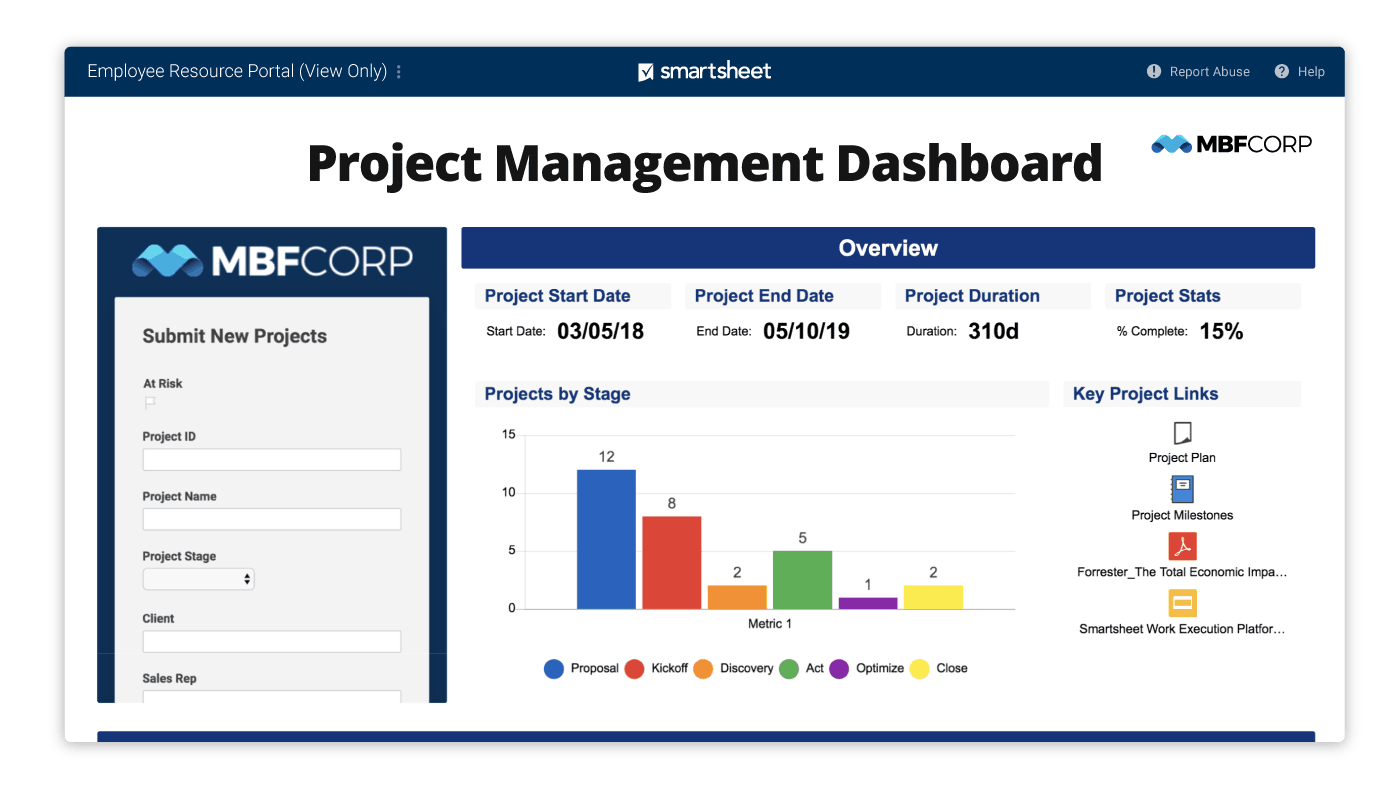
There is some useful project information, such as the start date, end date, duration and a percentage complete status. But in terms of key metrics, this dashboard is light on specifics. There’s one bar chart and some links, but it’s not much help as an overview of the project’s progress, performance and resources.
Cons of Making a Smartsheet Dashboard
There are more reasons to stay away from this software. One of the main drawbacks of creating a Smartsheet dashboard is the amount of manual setup required. We said it before, but it’s such a major flaw that it must be restated. While the tool offers flexibility, each widget often needs to be connected to specific sheets or reports.
This can become tedious when managing multiple data sources. If the underlying sheets are not well organized or consistently maintained, the dashboard can quickly become inaccurate or outdated. Another limitation is the lack of advanced analytics features. Smartsheet dashboards are primarily designed for high-level visualization rather than in-depth data exploration. They can show charts and metrics, but they don’t offer the same level of interactivity or drill-down capabilities that more specialized analytics tools provide.
This can be a challenge for teams that need deeper insights without exporting data to another platform. Performance can also be a concern for larger or more complex projects. Dashboards that pull from multiple sheets or large datasets may experience slow load times or delayed updates. In fast-paced environments where decisions rely on the most current information, this lag can be frustrating. Additionally, because dashboards are tied to the Smartsheet ecosystem, they may not integrate as seamlessly with external tools without extra configuration or third-party add-ons.
- No support for baselines or variance tracking: A Smartsheet dashboard cannot store or display a locked baseline schedule or budget for direct comparison with current performance data. This means you can’t visually track how far ahead or behind you are on key dates or spending in real time through the dashboard. Any variance analysis would need to be done in a sheet or report first, then summarized manually for the dashboard.
- No built-in resource or workload management visualizations: A Smartsheet dashboard lacks native widgets that dynamically display workload distribution or resource availability. This means you can’t see in real time who is overloaded or underutilized from the dashboard itself; such resource balancing views must be created in sheets or with external tools, then embedded as static or limited-refresh visuals.
- Limited linkage between dashboard metrics and reports: While you can tie dashboard metrics to cells in sheets, you can’t directly connect most widgets to complex reports or multi-sheet datasets. This restricts your ability to pull live cross-sheet aggregations into the dashboard without first building a summary sheet as an intermediary.
- No true portfolio-level rollup views: A Smartsheet dashboard cannot automatically roll up live data from multiple projects into a unified, portfolio-level summary without complex and expensive workarounds. While you can manually build summary reports or sheets to feed a dashboard, this functionality is not as seamless as other platforms.
- Some data requires manual updates to remain accurate: Depending on how your dashboard is set up, certain data widgets may not update automatically or can lag behind recent changes in the source sheets. This means extra manual refresh steps are needed to ensure viewers see the latest numbers.
ProjectManager Has a Better Dashboard Than Smartsheet
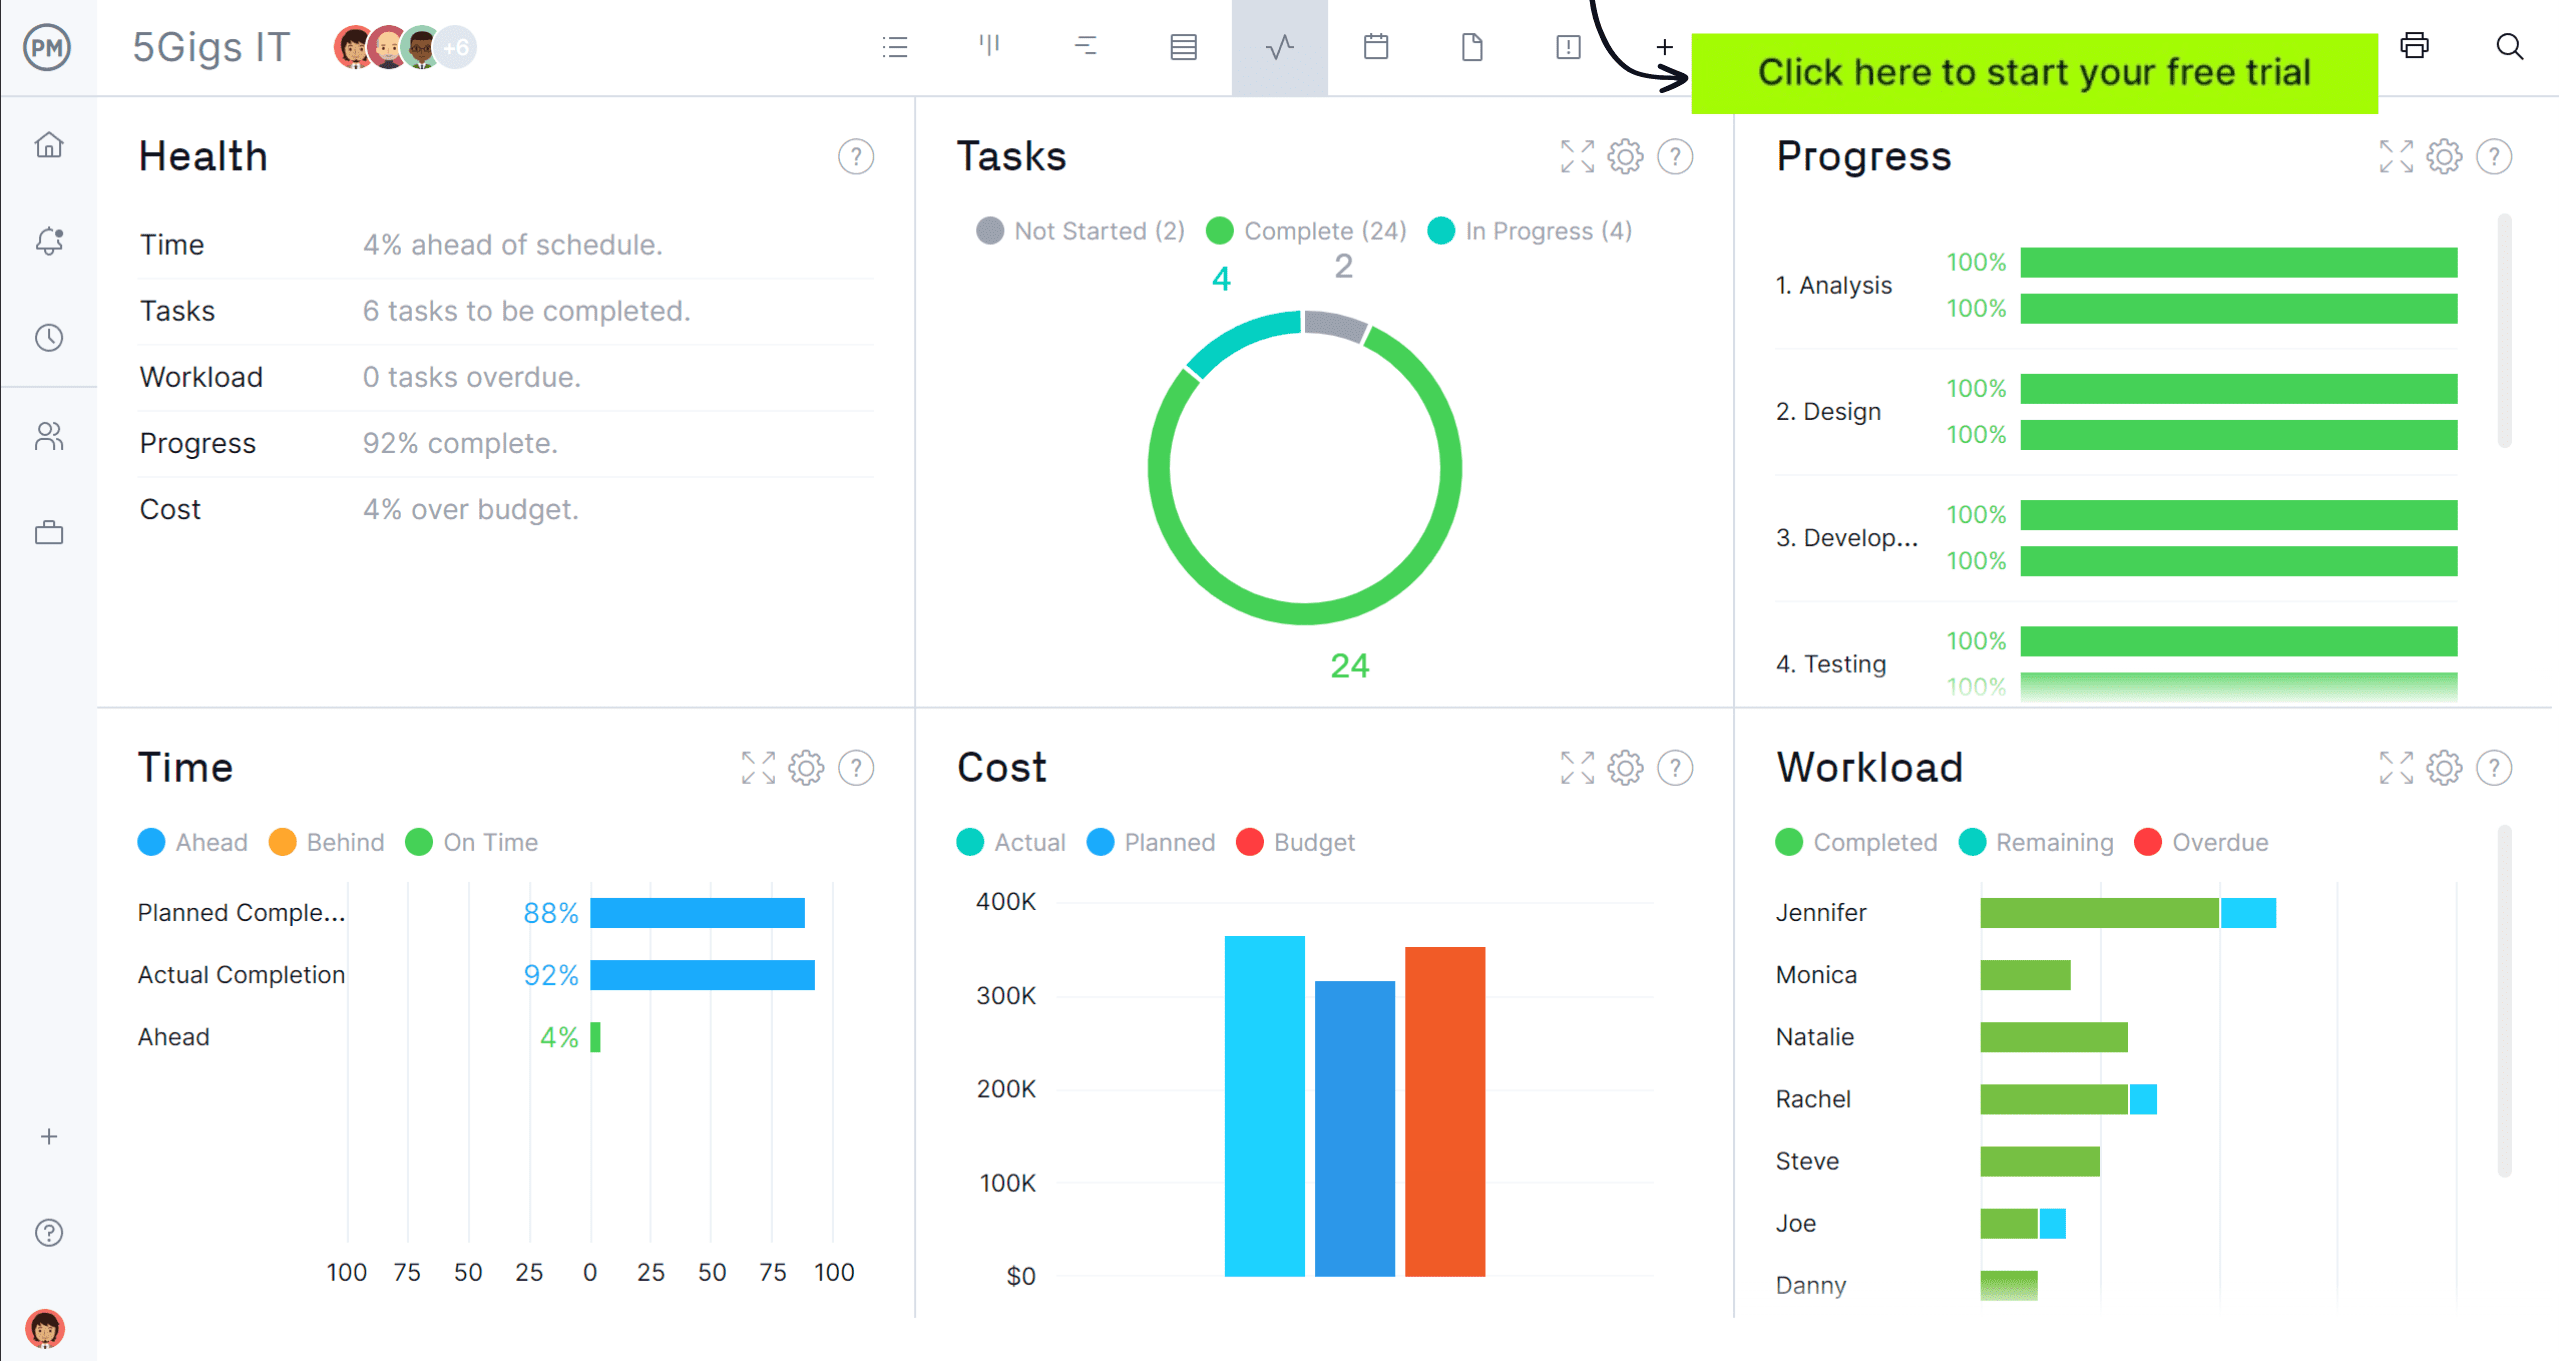
ProjectManager offers a more dynamic and adaptable dashboard than a Smartsheet dashboard, giving project managers real-time control over performance and progress. While Smartsheet dashboards can feel limited and require manual updates for accurate data, ProjectManager automatically refreshes as work is completed.
This ensures teams always have up-to-the-minute visibility into their projects. With multiple viewing options, customizable widgets and powerful integrations, ProjectManager’s dashboard turns raw data into actionable insights that drive better decisions.
- Access real-time data without manual refreshes: Smartsheet dashboards often require you to refresh or reconfigure data sources before you see the latest project updates. In ProjectManager, the dashboard automatically updates as team members log progress, complete tasks or adjust timelines. This means you can walk into a stakeholder meeting confident that the data you’re presenting is current. Real-time visibility reduces the risk of making decisions based on outdated information.
- Customize dashboards to match your workflow: Smartsheet dashboards offer customization, but ProjectManager takes it further with a variety of widget types, drag-and-drop arrangement and personalized views for different team roles. Set up a dashboard for executives that focuses on high-level KPIs while creating another for your team that shows task progress and deadlines. This flexibility ensures each audience sees exactly what they need, improving communication without cluttering the display.
- Visualize progress with multiple project views: In Smartsheet, you’re largely tied to grid-like layouts unless you build complex configurations. ProjectManager allows you to jump seamlessly between Gantt charts, kanban boards and calendar views while keeping the dashboard synced in real time. This means you can monitor progress in the visual format that best suits the situation without losing sight of your overall goals. These multiple views help you spot bottlenecks early and maintain a clearer understanding of your project’s status.
- Track resources alongside project metrics: Smartsheet dashboards focus heavily on task status but often require extra work to track resources effectively. ProjectManager integrates resource management directly into the dashboard so you can see workload distribution, team availability and task assignments at a glance. This connection between project performance and resource use helps managers prevent burnout and balance workloads.
Why ProjectManager Is Better Project Tracking Software Than Smartsheet
While Smartsheet offers some project tracking features, it can be limited in flexibility, visibility and real-time control. ProjectManager provides a more dynamic and integrated solution that allows teams to plan, execute and monitor every aspect of their projects with precision. From versatile project views to advanced resource tracking, ProjectManager gives managers and teams the tools they need to keep projects on schedule and within budget while adapting quickly to changes.
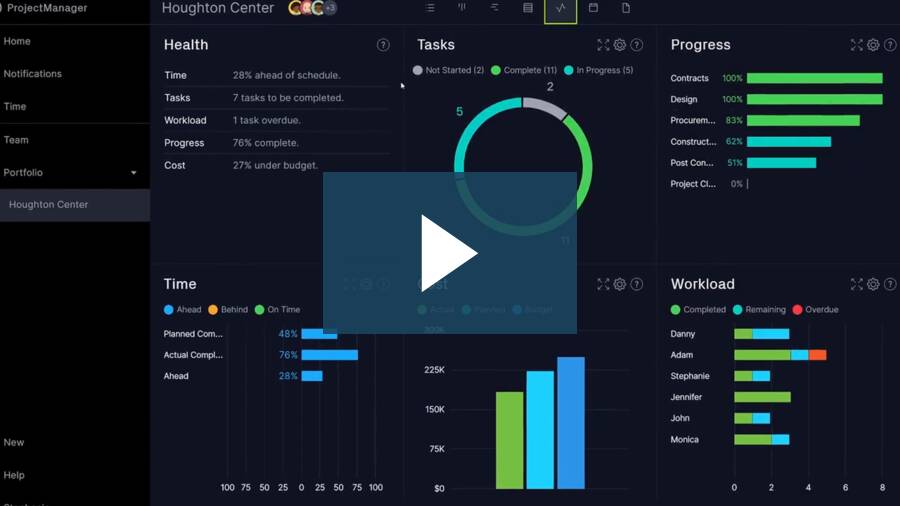
Learn more about ProjectManager’s powerful project and portfolio dashboards by watching the short video below.
Plan, Schedule and Track With Multiple Project Management Views
ProjectManager offers multiple views, including Gantt charts, kanban boards, task lists and calendar views. This flexibility means teams can choose the format that works best for their workflow while still sharing the same live project data.
Managers can plan tasks, set dependencies and milestones and track progress in real time. The ability to switch views without losing context helps ensure all team members stay aligned and informed throughout the project lifecycle.
Track Costs With Online Timesheets, Workload Charts and Reports
ProjectManager’s built-in timesheets allow for precise tracking of labor costs and billable hours, while workload charts visually show team capacity to prevent burnout. Detailed reports break down project performance by cost, time and resources, making it easier to spot risks before they impact delivery.
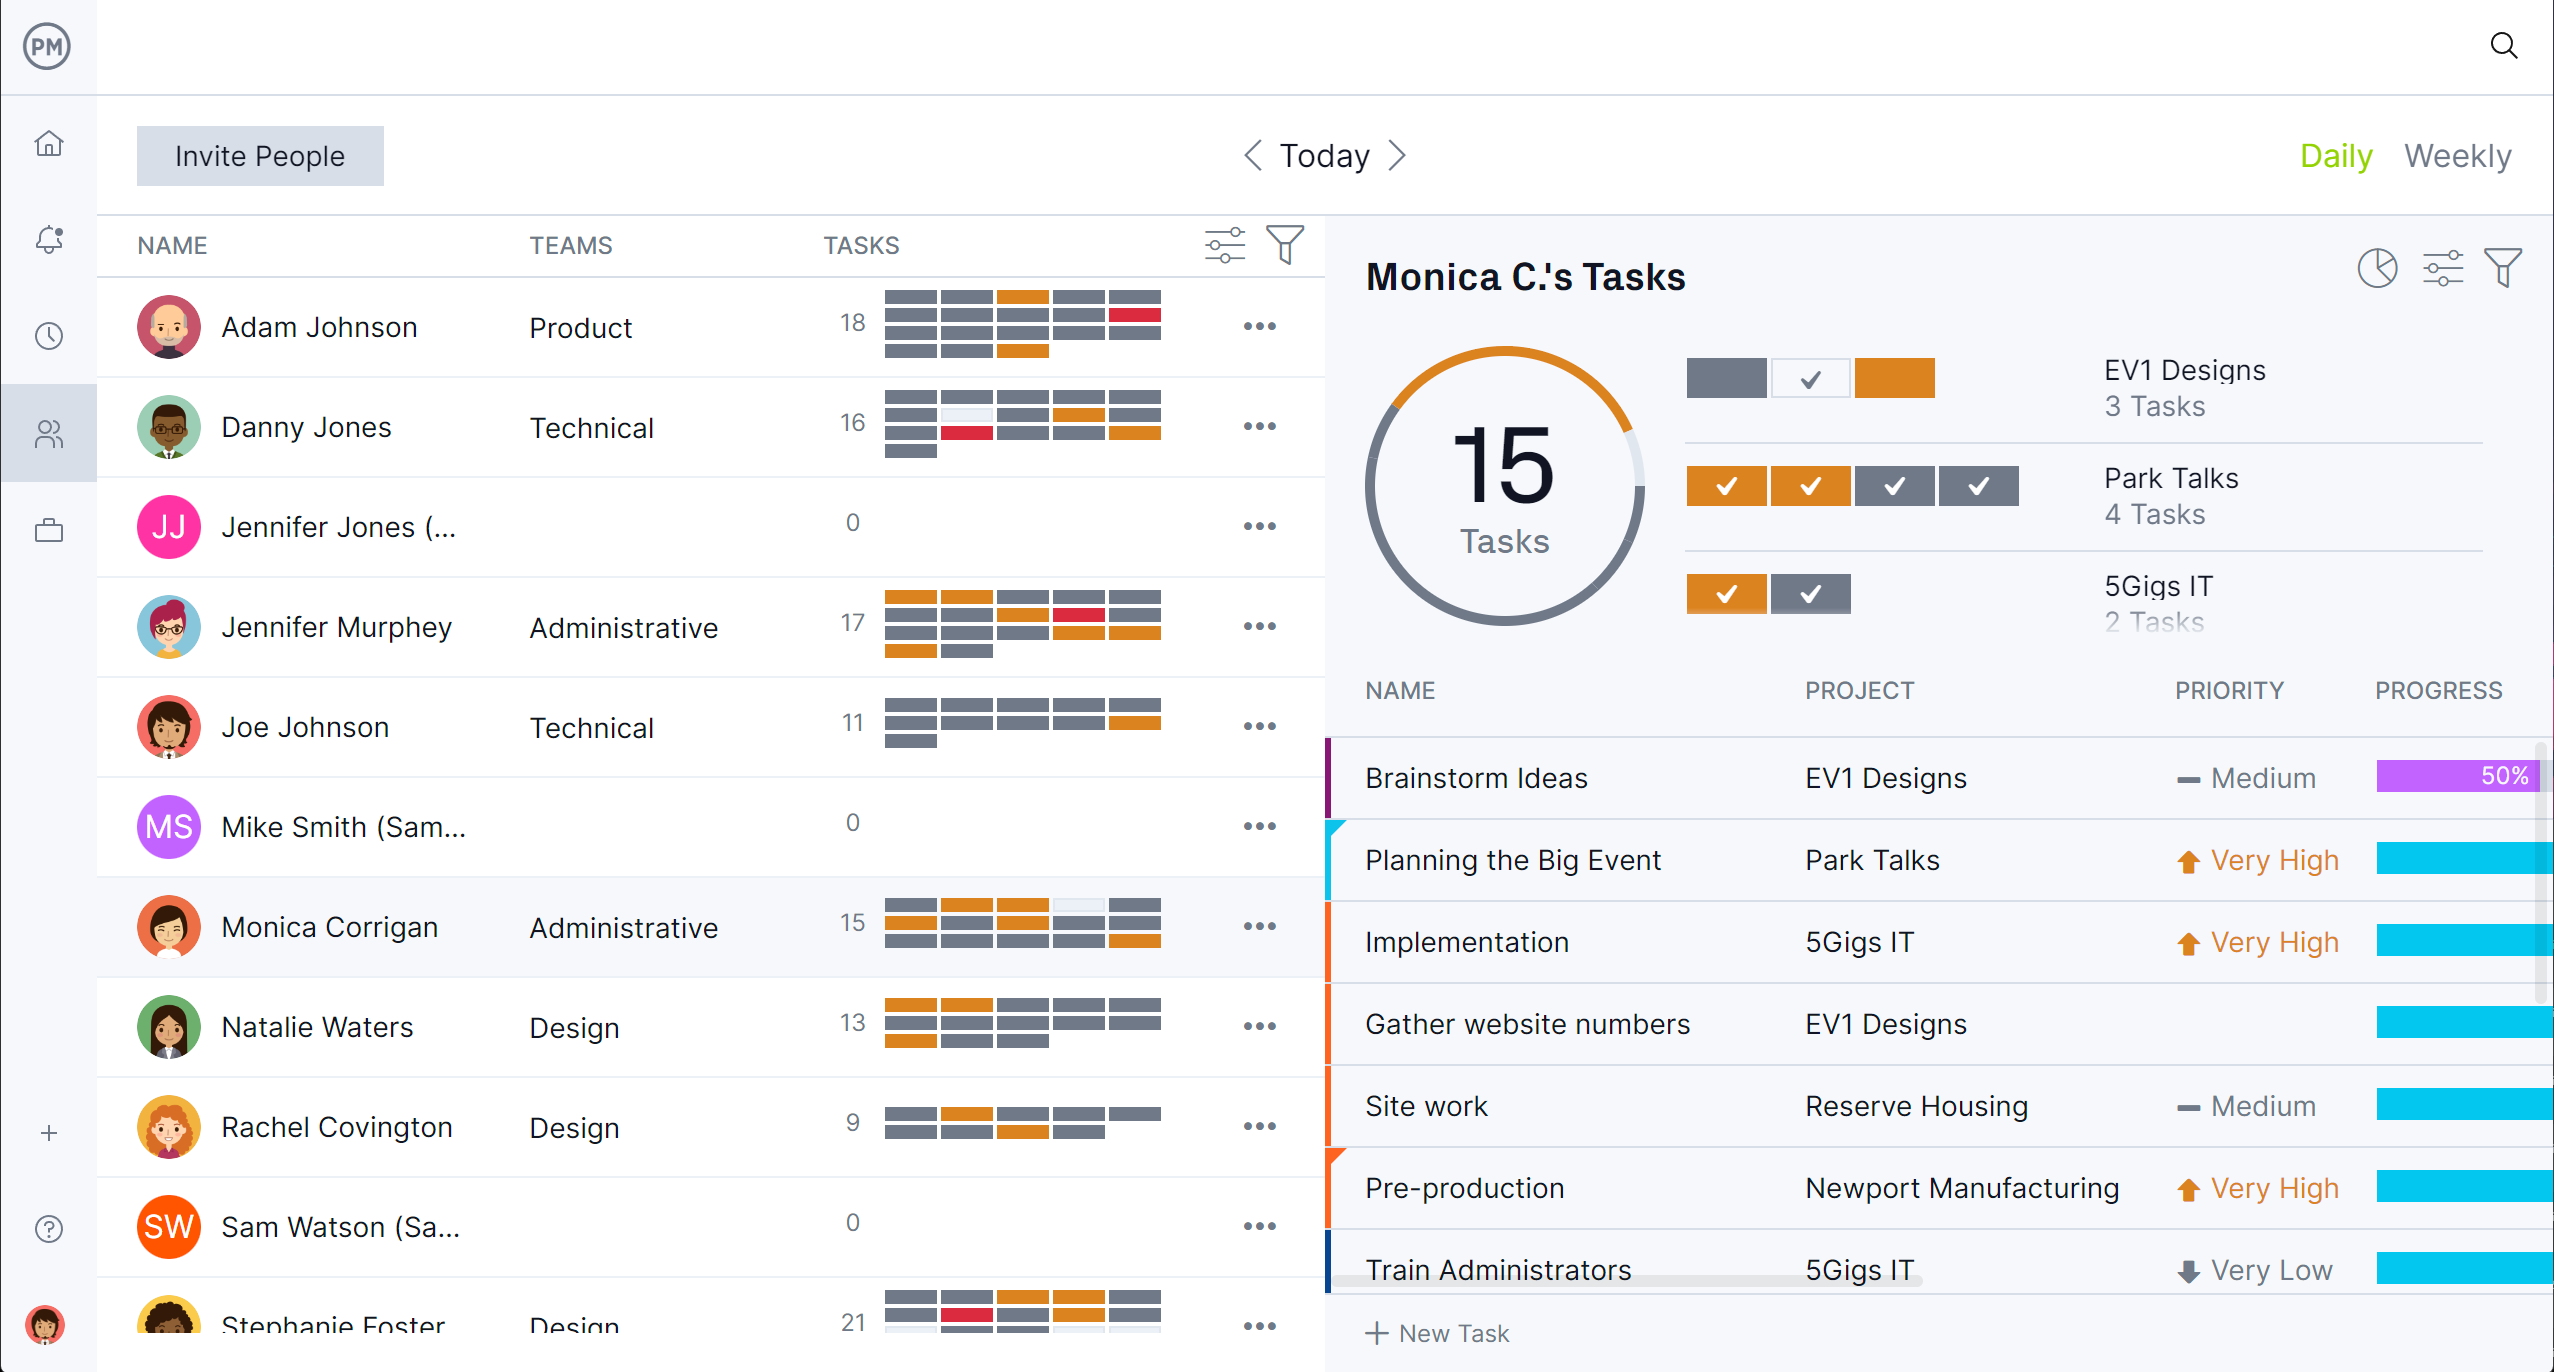
A team page provides a daily or weekly overview, which can be filtered and tasks updated without leaving the page. These tools work together to give managers complete visibility into budget and resource health, something that can be more cumbersome to achieve with Smartsheet’s dashboard limitations.
How to Make a Dashboard in Smartsheet
If, for whatever reason, readers are still interested in making a Smartsheet dashboard, follow these directions. Start by creating a new dashboard from the home screen. Name it and open the dashboard editor, where you can add widgets like charts, reports, text blocks or images. These widgets pull data from your existing Smartsheet sheets and reports, so you’ll need to have those prepared in advance. Each widget can be resized and positioned to create a layout that fits your needs.
Once the structure is in place, link each widget to its data source by selecting the sheet or report and choosing the fields you want to display. You can then customize colors, labels and formatting to match your branding or project style. After saving, your dashboard can be shared with stakeholders or team members for real-time viewing. Keep in mind that the data refresh rate depends on how your sheets are updated, which may affect the accuracy of what’s displayed.
Related Smartsheet Content
Still curious about Smartsheet? There are other articles you can read, which are linked below. They provide an overview, show various Smartsheet alternatives and compare the software to ProjectManager.
- What Is Smartsheet? Uses, Features and Pricing
- 14 Best Smartsheet Alternatives: Free & Paid Options Ranked (2025)
- Smartsheet vs. ProjectManager: Which Is the Better Project Management Software
ProjectManager is online project and portfolio management software that connects teams, whether they’re in the office or out in the field. They can share files, comment at the task level and stay updated with email and in-app notifications. Join teams at Avis, Nestle and Siemens who use our software to deliver successful projects. Get started with ProjectManager today for free.
