Manufacturing without a production timeline is guesswork with a deadline. Materials arrive, machines run, teams shift and orders ship — but without a clear map of when each phase of production must start and end, those activities don’t add up to a reliable output. A production timeline makes the sequence explicit: every phase of the production process placed on a time axis, with durations, dependencies, resource assignments and milestones that tell every team member exactly where the process stands and what happens next. It’s what separates a production plan that exists on paper from one that actually runs.
What Is a Production Timeline?
A production timeline is a visual, time-based representation of the full production process. It maps each phase of production — from raw material sourcing through manufacturing, quality control, packaging and delivery — against a calendar, showing how long each phase takes, how phases depend on one another, and where the process must be at any given date to meet the final delivery target.
Unlike a production schedule, which tracks what is being produced and in what quantities, a production timeline focuses on when each step happens and how the steps connect. It is the scheduling layer of production planning, used by manufacturing managers, operations teams and project managers to coordinate resources, anticipate bottlenecks and keep production moving toward an on-time delivery.
Production Timeline vs. Production Schedule
These two tools are closely related but address different questions. Using them interchangeably creates confusion about who owns which data and where to look when something goes wrong.
A production schedule is a demand-driven plan that specifies what to produce, how many units to produce and by when. It is driven by customer orders or sales forecasts and answers the question: what output do we need, and when does it need to be ready? A master production schedule is the authoritative version of this plan at the facility or product-family level.
A production timeline answers a different question: how do we get there? It maps the actual steps of the production process — procurement, fabrication, assembly, inspection, packaging — against a time axis, showing the sequence and duration of each phase. It is the execution layer beneath the production schedule.
| Production Schedule | Production Timeline | |
| Focus | What to produce and in what quantity | When each production phase happens |
| Driven by | Customer orders, forecasts | Production process and capacity |
| Primary view | Output targets by date | Phase sequence on a time axis |
| Used to | Commit to delivery dates | Coordinate teams and catch delays |
Build Production Timelines With ProjectManager
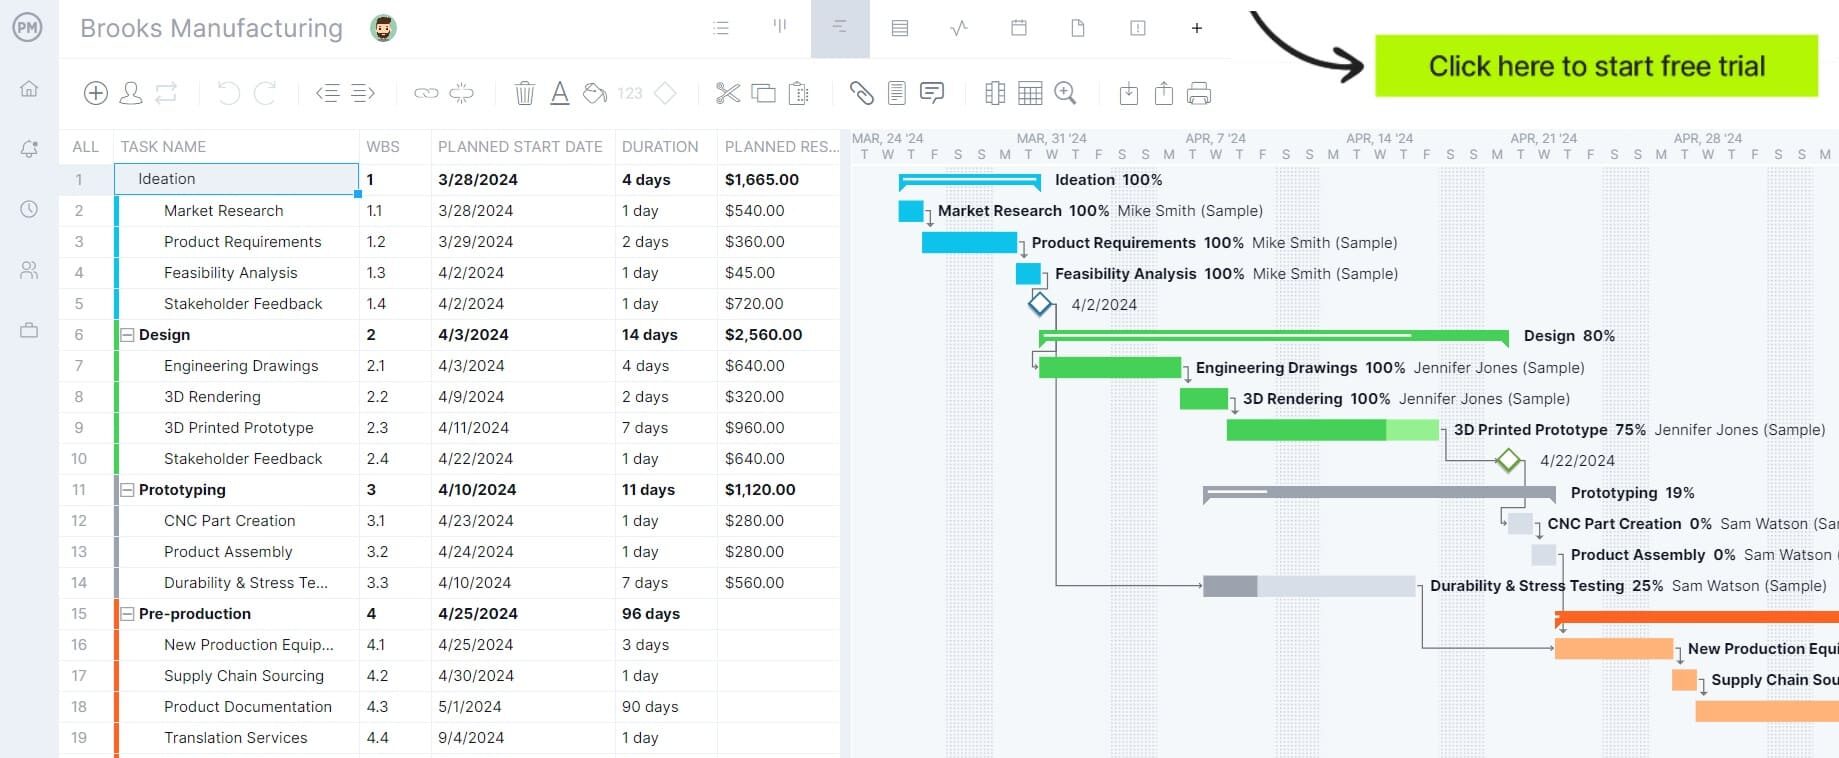
ProjectManager is online project management software with interactive Gantt charts built for production teams — create your production timeline, assign resources and track progress in real time. Try it free for 30 days.
Why Use a Production Timeline?
A production timeline does more than document the plan — it actively supports the decisions and coordination that keep production on track.
- Surfaces bottlenecks before they cause delays. When every phase is mapped with a duration and dependencies, capacity constraints become visible before they stall production. A phase that depends on a resource already committed elsewhere shows up as a conflict on the timeline, not as a missed deadline two weeks later.
- Coordinates across departments. Procurement, manufacturing, quality and logistics all need to act at the right time for production to run without gaps. A shared production timeline gives every team a single reference point for when their work must begin and end.
- Connects production to delivery commitments. Working backward from a committed ship date, the production timeline shows whether the process, as currently sequenced, can hit that date — and what would need to change if it can’t. It turns a delivery promise into a testable plan.
- Tracks actual vs. planned progress. As production runs, the timeline captures where each phase stands against the plan. Variance is visible in real time, which allows adjustments to downstream phases before the overall schedule is compromised.
- Supports resource allocation. With phase durations and overlaps visible, production managers can see where labor, equipment and materials need to be concentrated and where they can be shifted to accelerate a bottleneck phase.
Get your free
Production timeline
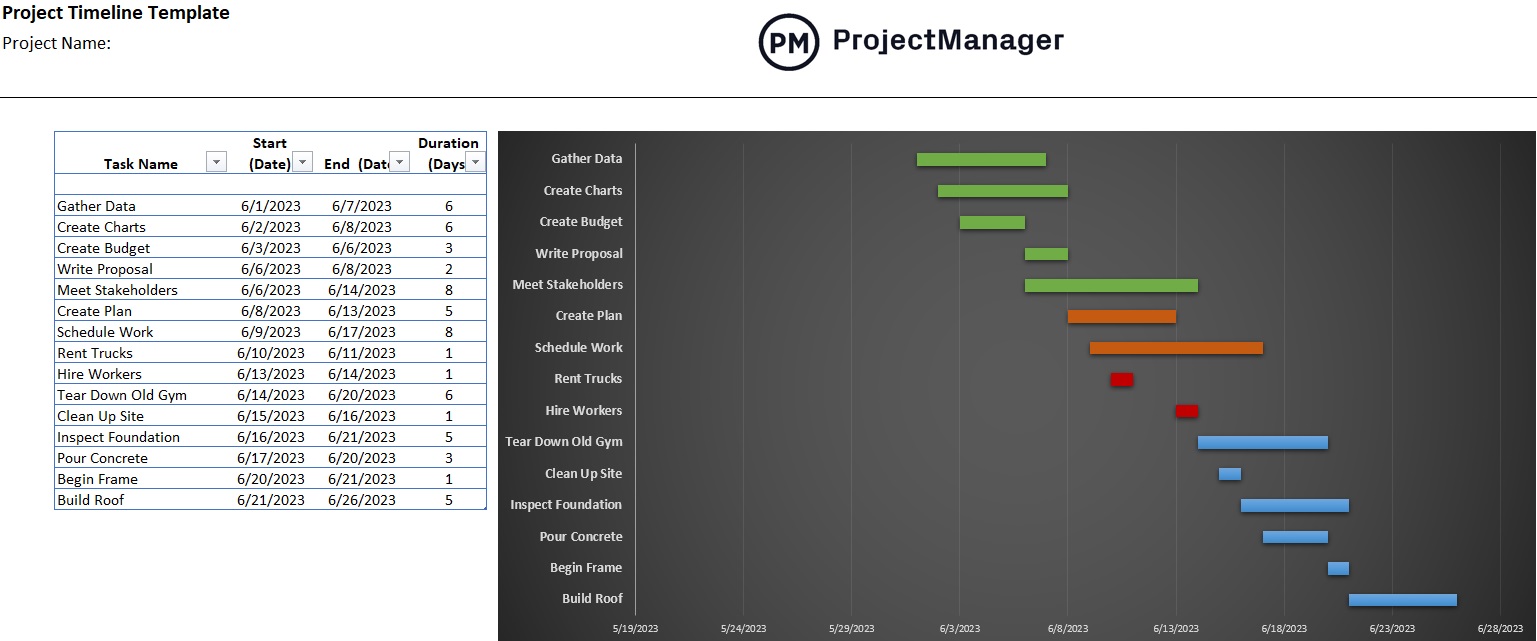
Use this free Project Timeline Template for Excel to manage your projects better.
How to Create a Production Timeline
Follow these steps to build a production timeline that connects every phase of the process to a calendar your team can actually execute against.
1. Define the production phases
Break the production process into its distinct phases. For a manufactured product, these might include raw material sourcing, supplier lead times, component manufacturing, sub-assembly, final assembly, quality inspection, packaging and outbound logistics. Each phase should be discrete — with a clear start point, end point and a single team or function responsible for it.
2. Estimate the duration of each phase
For each phase, determine how long it takes under normal operating conditions. Use historical production data where available; for new processes, use structured estimates from the teams doing the work. Duration estimates should reflect realistic throughput, not theoretical capacity — a machine that runs at 85% utilization doesn’t deliver 100% of theoretical output.
3. Map dependencies between phases
Identify which phases must complete before the next can begin (finish-to-start dependencies) and which can run in parallel. Assembly cannot start before components are manufactured; quality inspection cannot begin until assembly is complete. Overlapping phases where possible compresses the overall timeline without adding risk.
4. Assign resources to each phase
Attach the labor, equipment, materials and budget required to complete each phase. Resource assignment makes the timeline executable rather than theoretical — a phase without assigned resources is a plan gap, not a plan. A resource plan built alongside the timeline surfaces conflicts before they affect the schedule.
5. Set milestones
Identify the three to five points in the timeline where meaningful progress must be confirmed. Milestones are typically placed at phase boundaries — materials received, production complete, QC passed, ready for shipment — and serve as checkpoints where the overall timeline health can be assessed. A slipped milestone triggers a review of the downstream schedule before the delivery date is at risk.
6. Build the timeline on a Gantt chart
A Gantt chart is the standard format for a production timeline. Phases appear as horizontal bars on a time axis; dependencies appear as links between bars; milestones appear as fixed-point markers. The Gantt makes the sequence, duration and dependency structure of the production process visible at a glance — which is exactly what a time-axis representation needs to deliver.
7. Review and update as production runs
A production timeline is a living document. Update it as phases complete, as durations deviate from estimates and as upstream delays ripple through the schedule. A timeline that is updated in real time gives production managers the visibility to intervene before a local delay becomes a missed delivery. Use a production status report to communicate timeline health to stakeholders on a regular cadence.
What to Include in a Production Timeline
A production timeline that supports real decision-making includes more than a list of phases and dates. The following elements give the timeline its operational value.
- Phase names and descriptions — Each production phase listed with a clear label and a brief description of what work it covers. Ambiguous phase names create handoff problems; specific names make responsibilities clear.
- Phase durations — The planned duration for each phase in working days or shifts. Duration is the foundational data point from which everything else on the timeline is calculated.
- Start and end dates — The calendar dates on which each phase is scheduled to begin and end, derived from the phase sequence, durations and any fixed constraints such as a committed ship date or a supplier delivery window.
- Dependencies — Which phases must complete before a given phase can begin. Documenting dependencies is what makes the timeline predictive — when a phase slips, the impact on dependent phases is calculated from the dependency map, not guessed.
- Resource assignments — The labor, equipment and materials allocated to each phase. Resource assignments make it possible to spot overallocation conflicts before they cause stoppage.
- Milestones — The key checkpoints at which the overall timeline health is formally assessed: material receipt, production complete, QC passed, packaging complete, ready to ship.
- Buffer time — Planned contingency time built into the timeline at key phase boundaries. Buffer absorbs minor slippage without cascading to the delivery date; without it, any variance directly threatens the commitment.
- Quality checkpoints — Inspection and approval gates at which production output is verified before the next phase begins. Quality checkpoints are milestones with a pass/fail condition; a failed checkpoint triggers a rework phase that must be accommodated in the timeline.
- Responsible parties — The team or individual accountable for each phase. When a phase slips, the responsible party is the first contact for root cause and recovery options.
- Delivery date — The committed date by which the finished product must be shipped or handed off. The delivery date is the fixed endpoint from which the entire timeline works backward.
Production Timeline Example
The following example shows a production timeline for a furniture manufacturer producing a new outdoor seating collection for spring retail delivery.
Product: 4-piece outdoor seating collection (sofa, loveseat, 2 chairs)
Order quantity: 500 sets
Committed ship date: March 15
| Phase | Owner | Duration | Dates |
| Raw material procurement (aluminum frame, fabric, foam) | Procurement | 14 days | Jan 6 – Jan 19 |
| Frame fabrication and powder coating | Fabrication | 10 days | Jan 20 – Jan 29 |
| Foam cutting and fabric cutting | Upholstery Prep | 8 days | Jan 20 – Jan 27 |
| Cushion assembly and upholstery | Upholstery | 12 days | Jan 28 – Feb 8 |
| Final assembly (frame + cushions) | Assembly | 10 days | Feb 10 – Feb 19 |
| Quality inspection | QC | 5 days | Feb 20 – Feb 24 |
| Packaging and labeling | Packaging | 8 days | Feb 25 – Mar 4 |
| Outbound logistics and loading | Logistics | 5 days | Mar 10 – Mar 14 |
Milestones:
- Jan 19: All raw materials received and verified
- Feb 9: Frame and cushion components complete; final assembly begins
- Feb 24: QC passed; zero rework items outstanding
- Mar 4: All units packaged and labeled; logistics scheduling confirmed
- Mar 15: Ship date
Note that frame fabrication and cushion prep run in parallel (Jan 20–27), compressing the overall timeline by 8 days versus running them sequentially. The 5-day gap between packaging complete (Mar 4) and logistics start (Mar 10) is intentional buffer that absorbs minor slippage in any upstream phase.
Free Production Timeline Template
Rather than building a production timeline from scratch, start from a free template. Download ProjectManager’s project timeline template, add your production phases and dates, and you have a working timeline in minutes.
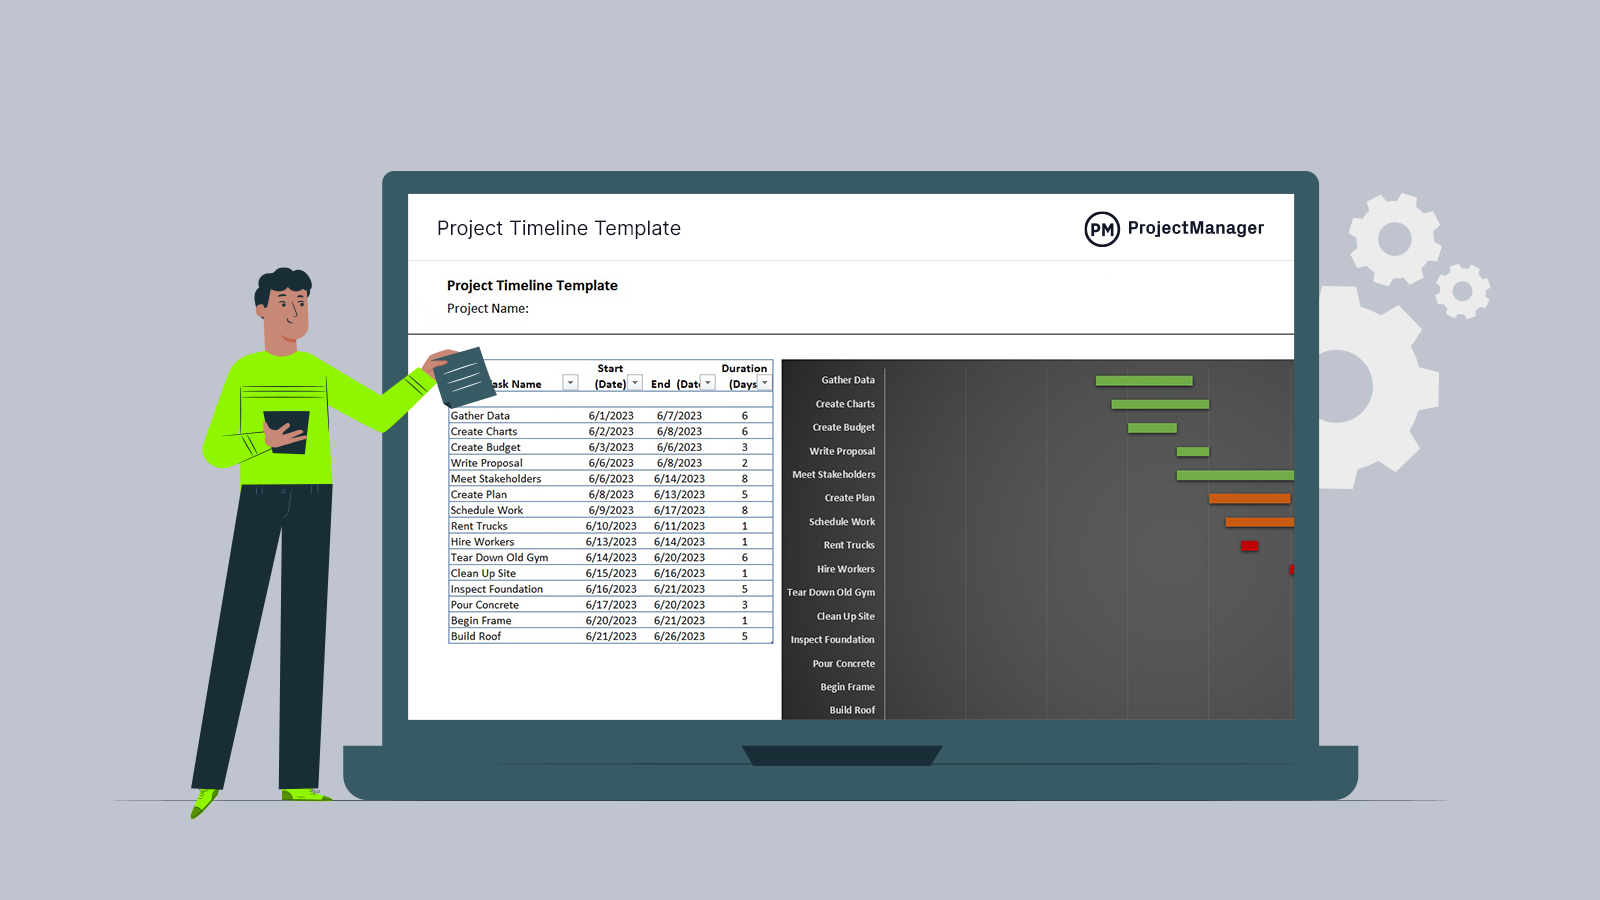
It’s free to download and easy to customize for any production process.
Benefits of Using a Production Timeline
- Earlier visibility into delays. Phase-level tracking surfaces slippage while there is still time to respond — before a missed phase deadline becomes a missed ship date.
- Reduced coordination failures. A shared timeline eliminates the information gaps between procurement, production, quality and logistics that cause handoff failures and idle time between phases.
- More reliable delivery commitments. Working backward from a delivery date confirms whether the production process can meet the commitment before the commitment is made — not after production is already underway.
- Better capacity utilization. With resource assignments visible against the timeline, production managers can identify where capacity is underused and where it is overcommitted, and rebalance before the imbalance causes a stoppage.
- Faster response to disruption. When a supplier delays a material shipment or a machine goes down, the timeline shows immediately which downstream phases are affected and by how much. Recovery options can be evaluated against the full schedule rather than phase by phase.
Manage Production Timelines With ProjectManager
ProjectManager gives production teams the tools to build, track and update their timeline in one place — from the initial schedule through delivery.
A template captures the structure of your production timeline. Running it requires tools that connect the plan to the actual production process — task tracking, schedule updates, resource visibility and real-time progress monitoring that doesn’t depend on a shift supervisor walking the floor.
Build Production Timelines on an Interactive Gantt Chart
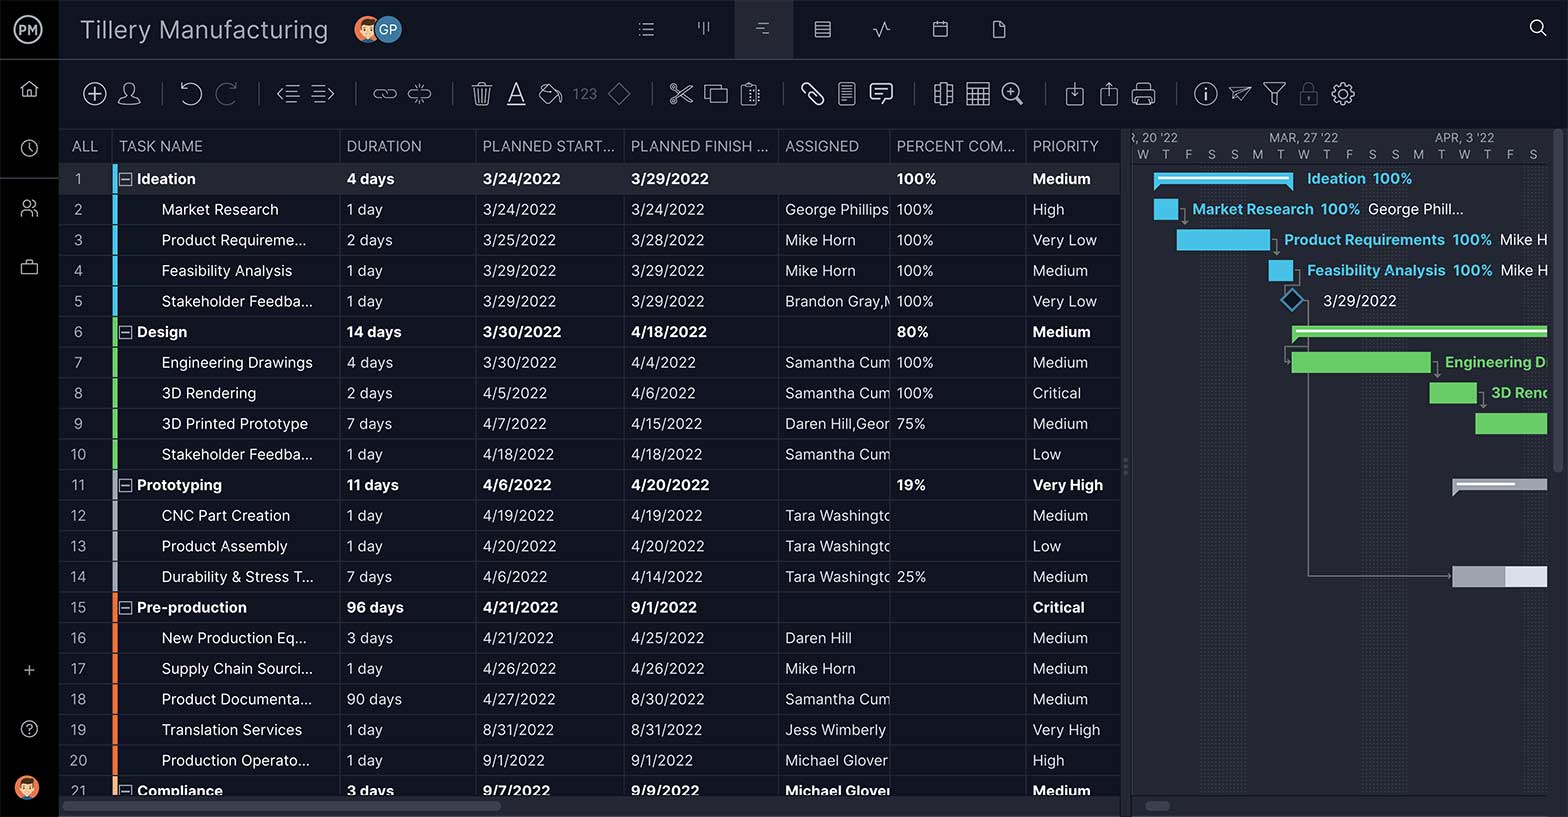
ProjectManager‘s Gantt charts let you build your production timeline as a live, interactive schedule. Add each production phase as a task, assign it to the responsible team, set start and end dates and link phase dependencies so the schedule reflects the actual production sequence. When a phase slips, the Gantt calculates the downstream impact automatically — giving production managers the information they need to adjust before the delivery date is at risk.
Monitor Production Progress in Real Time
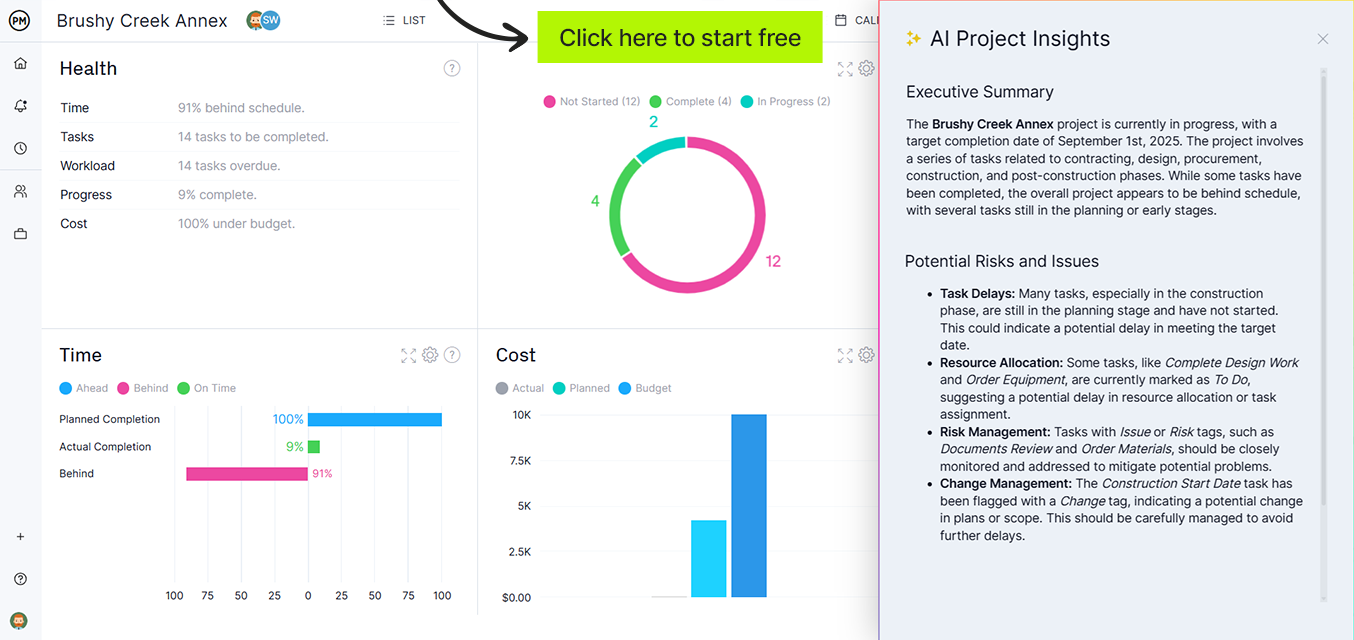
Knowing where production stands shouldn’t require a floor walk or a morning meeting. ProjectManager’s real-time dashboards pull live data from your production tasks and display phase completion, schedule variance and resource utilization at a glance. When actual progress diverges from the timeline, the dashboard shows it immediately — before the variance compounds into a delivery miss.