Managing schedules can be simpler when the right tool is in place. A Smartsheet Gantt chart organizes tasks, dependencies and timelines in a unified view while keeping stakeholders aligned. However, understanding how it works and where it falls short is essential before committing to it.
What Is Smartsheet?
Smartsheet is a cloud‑based work and project management platform that combines a spreadsheet‑like interface with tools to plan, assign and monitor work. It is commonly used across construction, marketing, IT and operations to coordinate schedules, automate workflows and track progress in real time. Teams use Smartsheet to assign tasks, organize calendars, collaborate on documents and oversee progress from inception to completion.
Does Smartsheet Have a Gantt Chart?
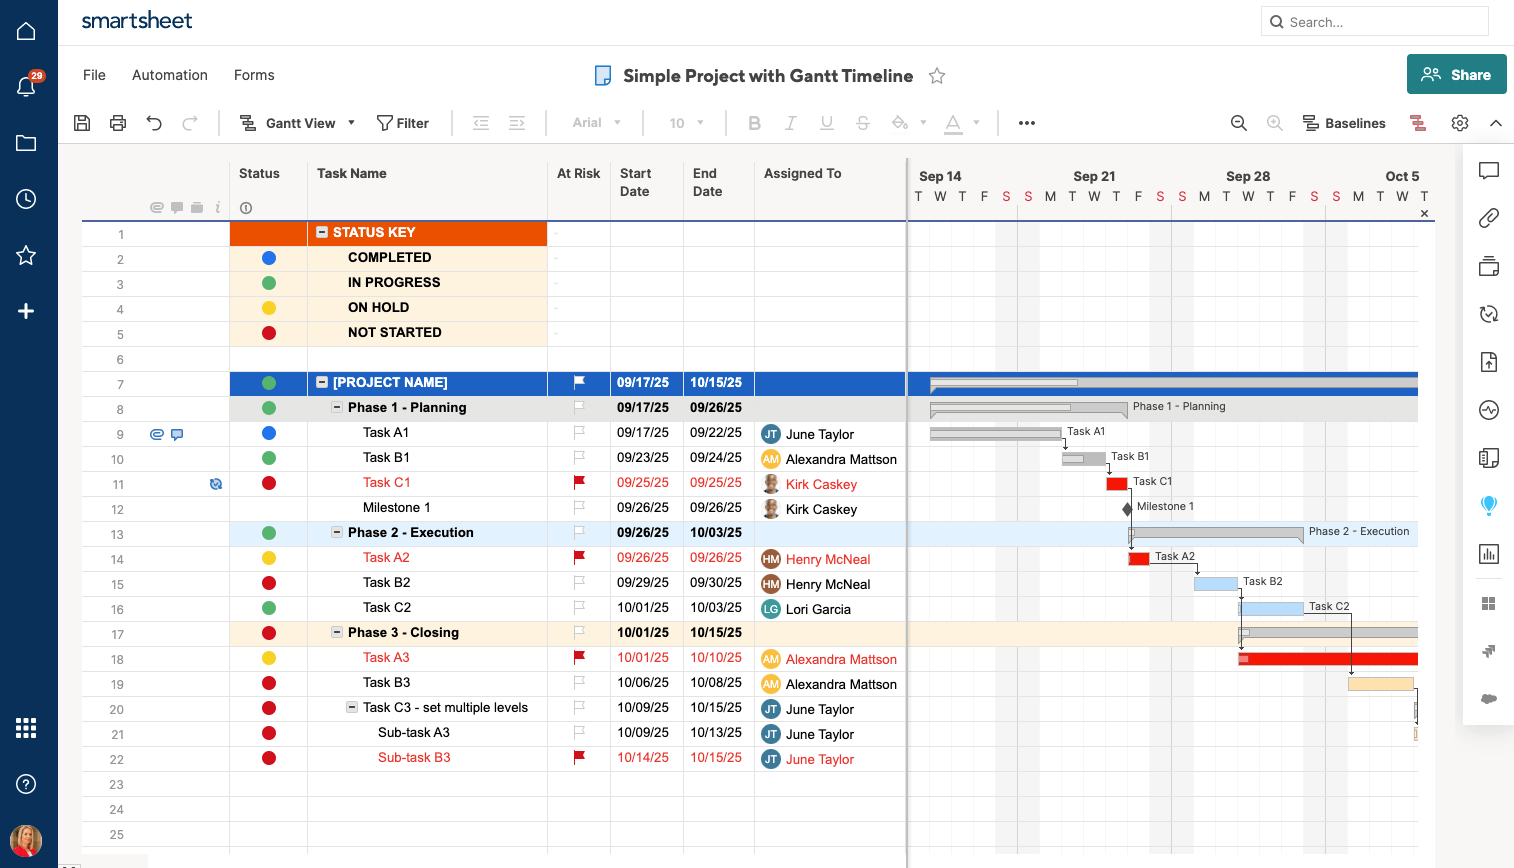
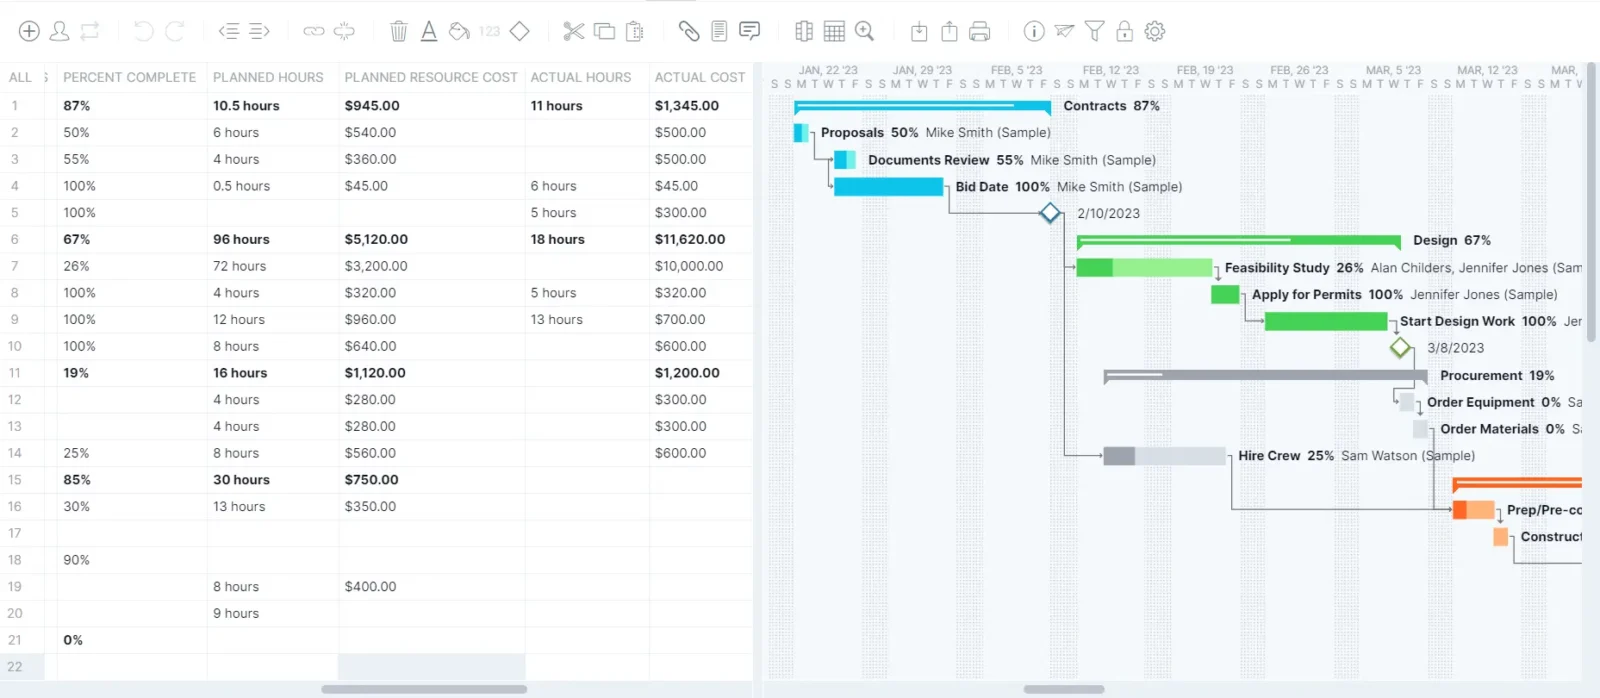
Smartsheet includes a Gantt chart view that integrates a grid on the left with a timeline on the right. This view allows users to see task durations, dependencies and milestones in one place, making it a core scheduling option within the platform.
Short Answer: Yes, Smartsheet Has Gantt Charts
Smartsheet’s Gantt charts are functional and easy to edit. Users can drag and drop task bars, color‑code phases or owners and assign tasks directly from the timeline. Dependencies and critical path activities can be highlighted with a click, while baselines compare current dates to the original plan for schedule variance. Collaboration features let teammates add comments, attach files and receive automated alerts, and data can be imported from Excel, MS Project, Google and Trello or exported to PDF or PNG.
Long Answer: Smartsheet’s Gantt Charts Lack Key Features for Project Management
Although Smartsheet provides a usable Gantt view, it lacks advanced project management capabilities found in more robust tools. There is no built‑in way to estimate costs per task or log actual expenses, and resource allocation is handled through separate add‑ons rather than within the timeline. Smartsheet also limits how thoroughly you can compare planned and actual start and finish dates because baselines and variance tracking are basic. Organizations needing deeper cost, resource and performance analysis may outgrow Smartsheet’s Gantt charts quickly.
ProjectManager is award-winning project and portfolio management software that has Gantt charts that link all four types of task dependencies to avoid costly delays. They can filter for the critical path and set a baseline to track project variance in real time. Our Gantt charts update automatically and can be shared easily with your project team, even Apple users. Microsoft Project is not known for its collaboration or ease of use. Our software is easier to use, fosters collaboration, including a mobile app, and is not as expensive as Microsoft Project. Get started with ProjectManager today for free.
How to Make a Smartsheet Gantt Chart Better With ProjectManager
Transferring schedules between Smartsheet and ProjectManager is straightforward. Export your Smartsheet Gantt chart as a Microsoft Project XML or Excel file and then import it into ProjectManager to unlock advanced features like workload and resource allocation charts, timesheets, kanban boards, project calendars and more. The process also works in reverse, so you can round‑trip data between the two tools. To try it yourself, simply start a free trial of ProjectManager.

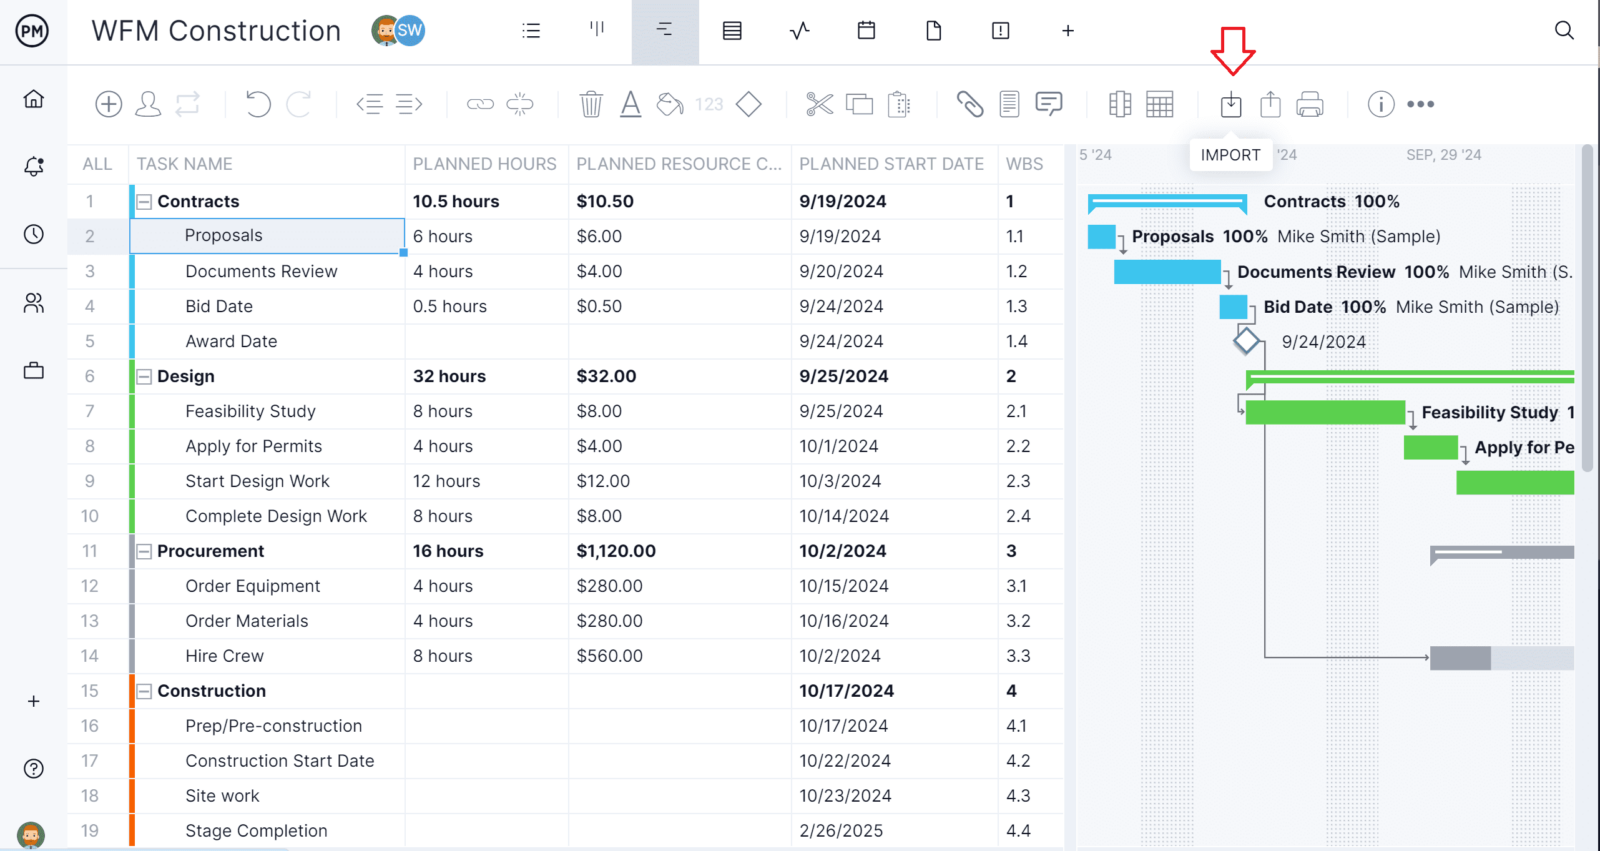
1. Use the Import Button on the Gantt Chart
Export your Smartsheet project as an MPP file and open ProjectManager. In the Gantt view, select the import option and choose to bring in data from a Microsoft Project (MPP) file. This initiates the guided import process and prepares the file for conversion.
2. Select Which MPP File You Want to Import
Browse your local drive for the exported Smartsheet file. Selecting the correct MPP ensures that all task names, dates and hierarchies transfer accurately into ProjectManager’s Gantt chart.
3. Choose Your MPP File Import Options
During import, decide whether to map columns automatically or manually. ProjectManager lets you match Smartsheet fields like task name, start date and finish date to its own columns to avoid data misalignment.
4. Import All Data or Just the Task List
ProjectManager offers the option to import every column (including predecessors and resources) or only the basic task list. Choose the full import to maintain dependencies and other metadata from Smartsheet.
5. Close the Success Prompt
Once the import completes, ProjectManager displays a confirmation. Closing this prompt takes you directly to the newly created Gantt chart, ready for review and edits.

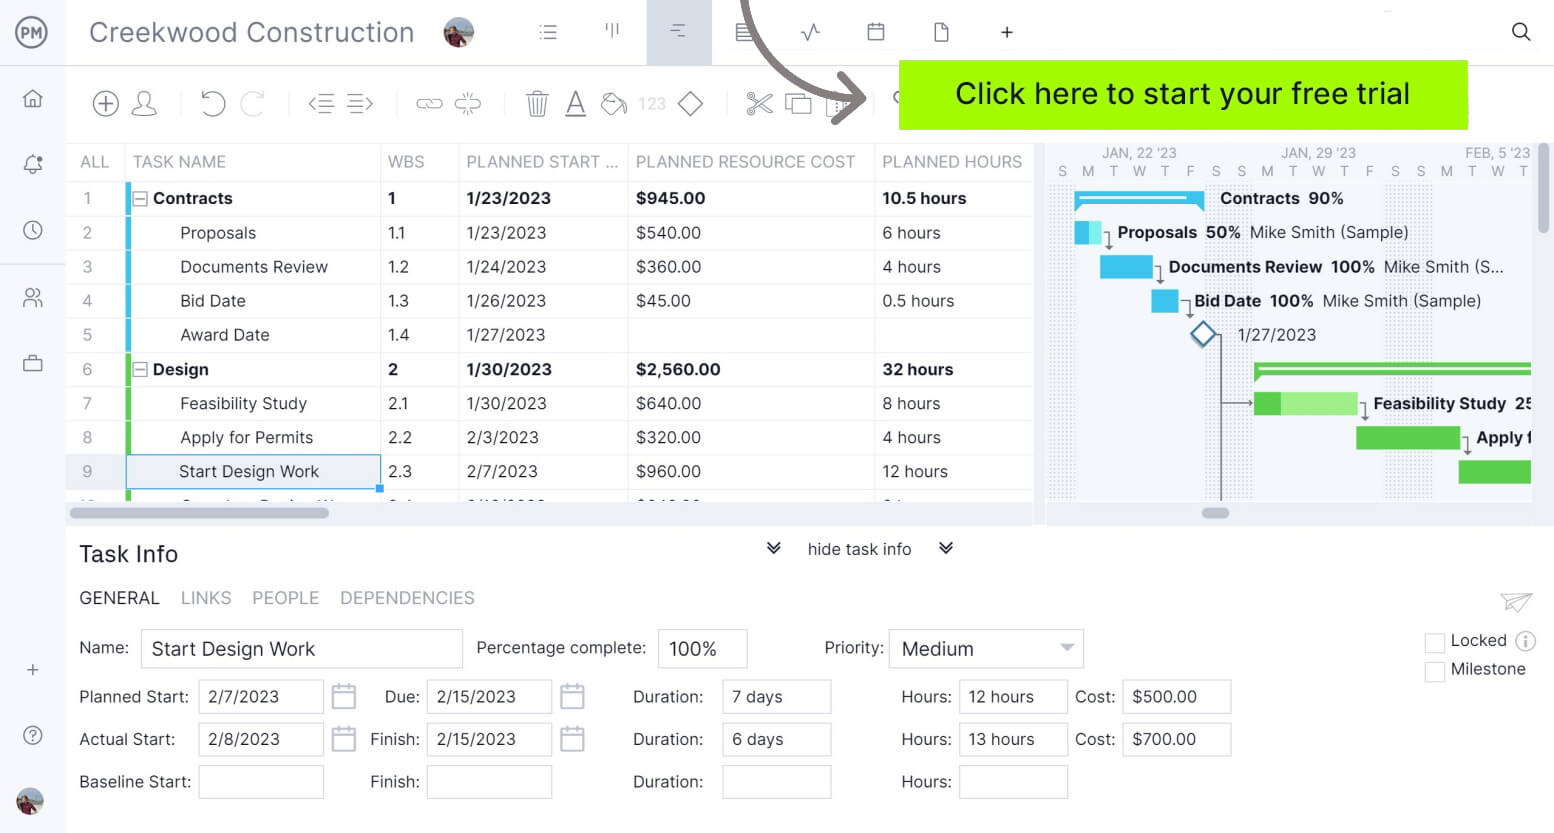
6. Your Smartsheet Gantt Chart Is Ready to Edit in ProjectManager
With the data imported, you can refine the plan using ProjectManager’s advanced features. Assign resources, estimate costs, set baselines, link multiple dependency types and monitor progress with real‑time dashboards—all from a more powerful Gantt interface.
Key Features and Pros of Smartsheet Gantt Charts
Smartsheet’s Gantt view covers essential scheduling needs and offers several advantages for teams that like a spreadsheet feel.
- Tracks tasks with start and end dates on a timeline and links them so you see how one step affects another.
- Lets you set working days, adjust the scale from days to months and group subtasks under phases with automatic roll‑up of progress.
- Uses colors, baselines and critical‑path markers to show which tasks are late, risky or driving the finish date.
- Provides drag‑and‑drop editing, lets you choose what each column stores and summarizes key metrics in one panel.
- Offers collaboration tools like comments, file attachments and @mentions plus automated reminders and alerts.
- Allows you to color‑code tasks, assign work to team members and manage workloads with built‑in notifications.
- Supports importing data from Excel, MS Project and other tools and exporting the finished chart to PDF or PNG for sharing.
- Updates automatically whenever you adjust a task so the timeline and dependencies stay accurate.
Cons of Making a Gantt Chart in Smartsheet
Despite these strengths, Smartsheet’s Gantt functionality has notable shortcomings that can hinder complex projects or enterprises with advanced needs.
- There’s no built‑in cost tracking, so you can’t compare budgets to actual spending.
- The basic Gantt view doesn’t include resource assignment or workload balancing without paid add‑ons.
- Comparison features are limited, making it hard to see variances between planned and actual dates or budgets.
- It can be hard to learn, dashboards are manual, and connecting to other apps or using advanced features adds extra cost.
- Reports and dashboards aren’t automatic; you have to build and refresh them yourself.
- There’s no native time tracking, so you’ll need a separate tool if you want to log hours or timesheets.
- Task dependency options are basic, which makes it tricky to model complex schedules and constraints.
- Integrations often rely on third‑party services or custom workflows, which adds cost and complexity.
How to Make a Gantt Chart in Smartsheet
Smartsheet’s Gantt view is built upon a regular sheet with date columns. Follow these steps to create your own Gantt chart.
1. Add Tasks and Date Columns
Create a new sheet and list your tasks in rows. Add at least two date columns—start and end dates—to allow Smartsheet to calculate durations and draw Gantt bars. Without these columns, the timeline cannot be generated.
2. Switch to Gantt View
From the toolbar, select Gantt View to split the screen into a grid on the left and a timeline on the right. Use the divider to adjust how much space each section occupies.
3. Enable Dependencies and Configure Settings
Right-click a column header and select Edit Project Settings or use the settings button to open the project settings dialog. Here you can enable dependencies, choose predecessor columns and set other scheduling options.
4. Adjust the Timescale
Use the zoom in and zoom out icons to change the timescale between quarter, month, week or day views. Smartsheet will save your timescale settings when you export the chart.
5. Edit Tasks Directly on the Timeline
Drag the center of a taskbar to move its start and finish dates, or drag one end to adjust the duration. These adjustments update the underlying date columns automatically.
6. Customize Bars and Hierarchy
Right-click a taskbar to open color settings and choose custom colors for different phases or owners. Indent rows in the grid to create parent-child relationships; parent rows calculate progress and durations based on their subtasks.
ProjectManager Has Better Gantt Charts Than Smartsheet
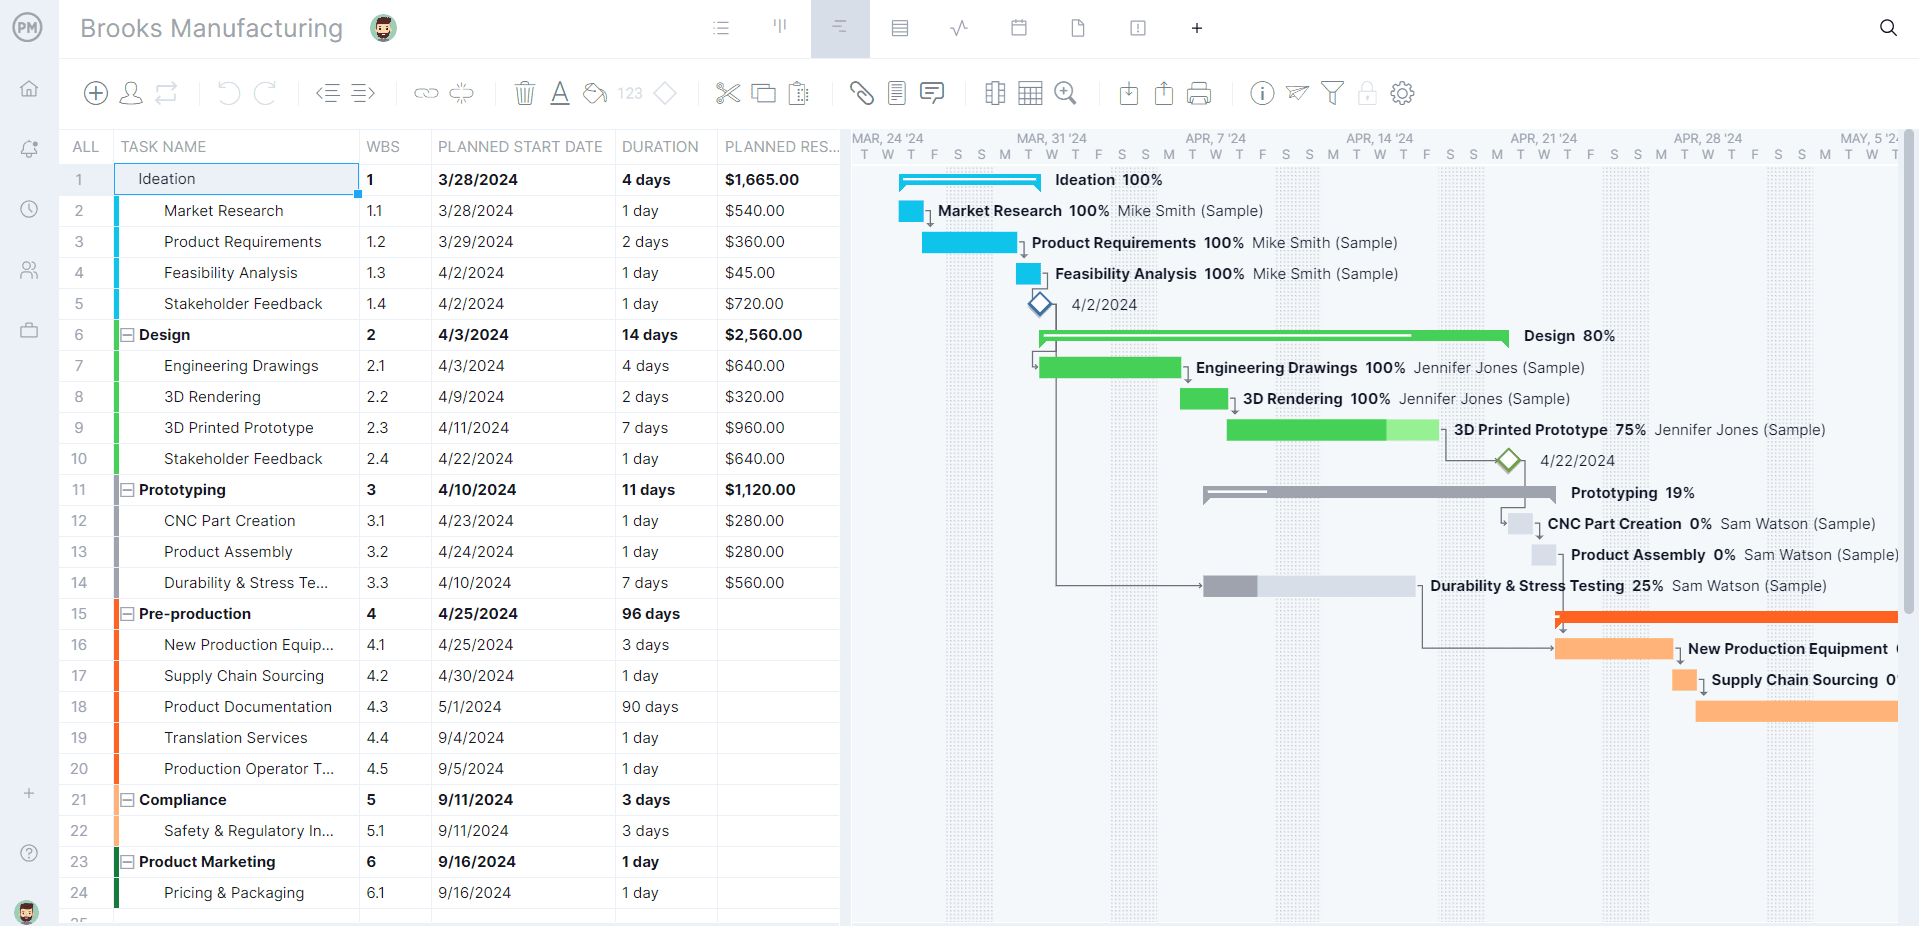
Smartsheet’s Gantt view is convenient but limited. ProjectManager offers a more powerful alternative, providing deeper cost and resource tracking, richer variance analysis and integration with other project views and dashboards.
Superior Cost and Resource Tracking Gantt Chart Features
For resource and cost tracking, the difference between Smartsheet’s Gantt chart and ProjectManager’s Gantt chart is very clear. In ProjectManager you can assign people, equipment and materials to tasks, set hourly rates or budget lines and then see how costs accrue as time is logged. Workload charts make it clear who is overbooked or underused, while timesheets feed directly into the Gantt so there’s no manual reconciliation. You can drag tasks to adjust assignments and the system recalculates hours, utilization and forecast spend in real time, helping you catch overruns before they happen.
Planned vs Actual Comparisons
Another area where ProjectManager shines is in comparing the plan to actual performance. Baselines capture your initial project schedule and budget, and as your team updates progress the software computes variance on dates, costs and durations. Visual indicators call attention to tasks trending late or over budget, allowing you to drill down into the reasons and adjust course. You can save multiple baselines to track scope changes over time and generate reports that show whether your corrective actions are working.
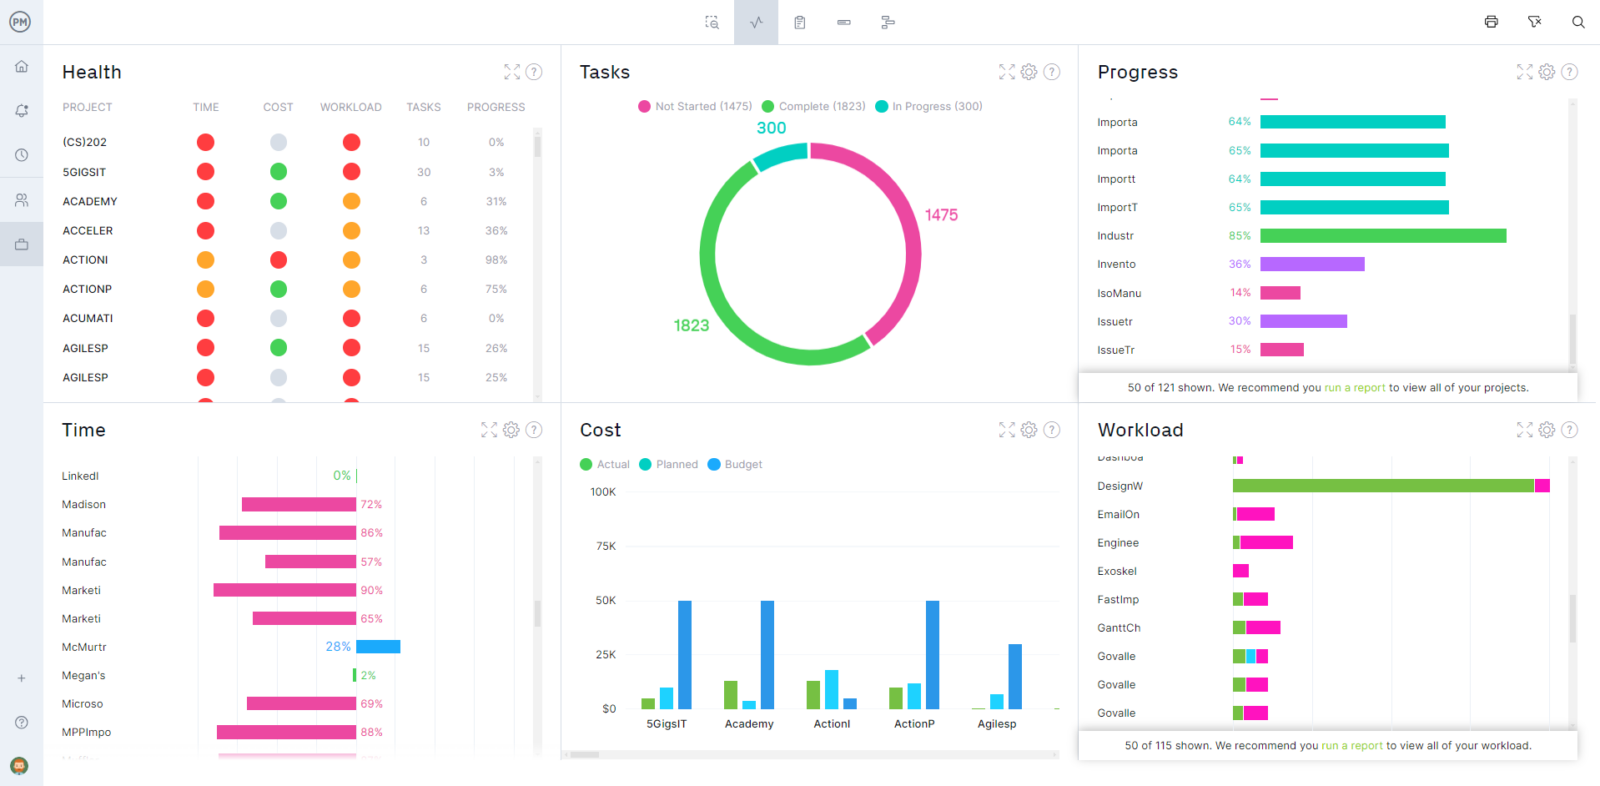
Syncs with Other Project Views and Real‑Time Project Tracking Dashboards
Finally, ProjectManager’s Gantt chart doesn’t live in isolation. Any changes you make to tasks propagate to kanban boards, task lists and resource calendars, ensuring everyone sees the same information regardless of how the project management tools they prefer to work. A live dashboard aggregates key metrics such as completion percentage, budget consumption and team availability, updating as the Gantt changes. With integrations to tools like Slack, Google Drive and Microsoft Office you can collaborate with stakeholders seamlessly and keep your entire project ecosystem in sync.
ProjectManager is online project and portfolio management software that connects teams whether they’re in the office, out in the field or anywhere in between. They can share files, comment at the task level and stay updated with email and in-app notifications. Join teams at Avis, Nestle and Siemens who use our software to deliver successful projects. Get started with ProjectManager today for free.
