Choosing the best PERT chart maker is essential for teams looking to streamline project planning and visualize timelines with precision. A PERT (program evaluation review technique) chart maker is a software tool used to create visual diagrams that map out tasks, durations and dependencies in a project. These tools help identify the critical path, optimize scheduling and manage uncertainty in task completion times. The best PERT chart software simplifies complex project structures into clear, actionable visuals that support better decision-making and time estimation.
Also known as a PERT diagram maker or PERT CPM maker, these tools often come with features that combine the flexibility of visual planning with the logic of critical path methodology (CPM). The ideal solution will offer drag-and-drop functionality, automatic dependency mapping, collaboration tools and integration with other project management features like Gantt charts and dashboards. In this blog, we’ll compare top PERT chart makers to help you find the software that fits your needs—whether you’re managing a large portfolio or a single complex project.
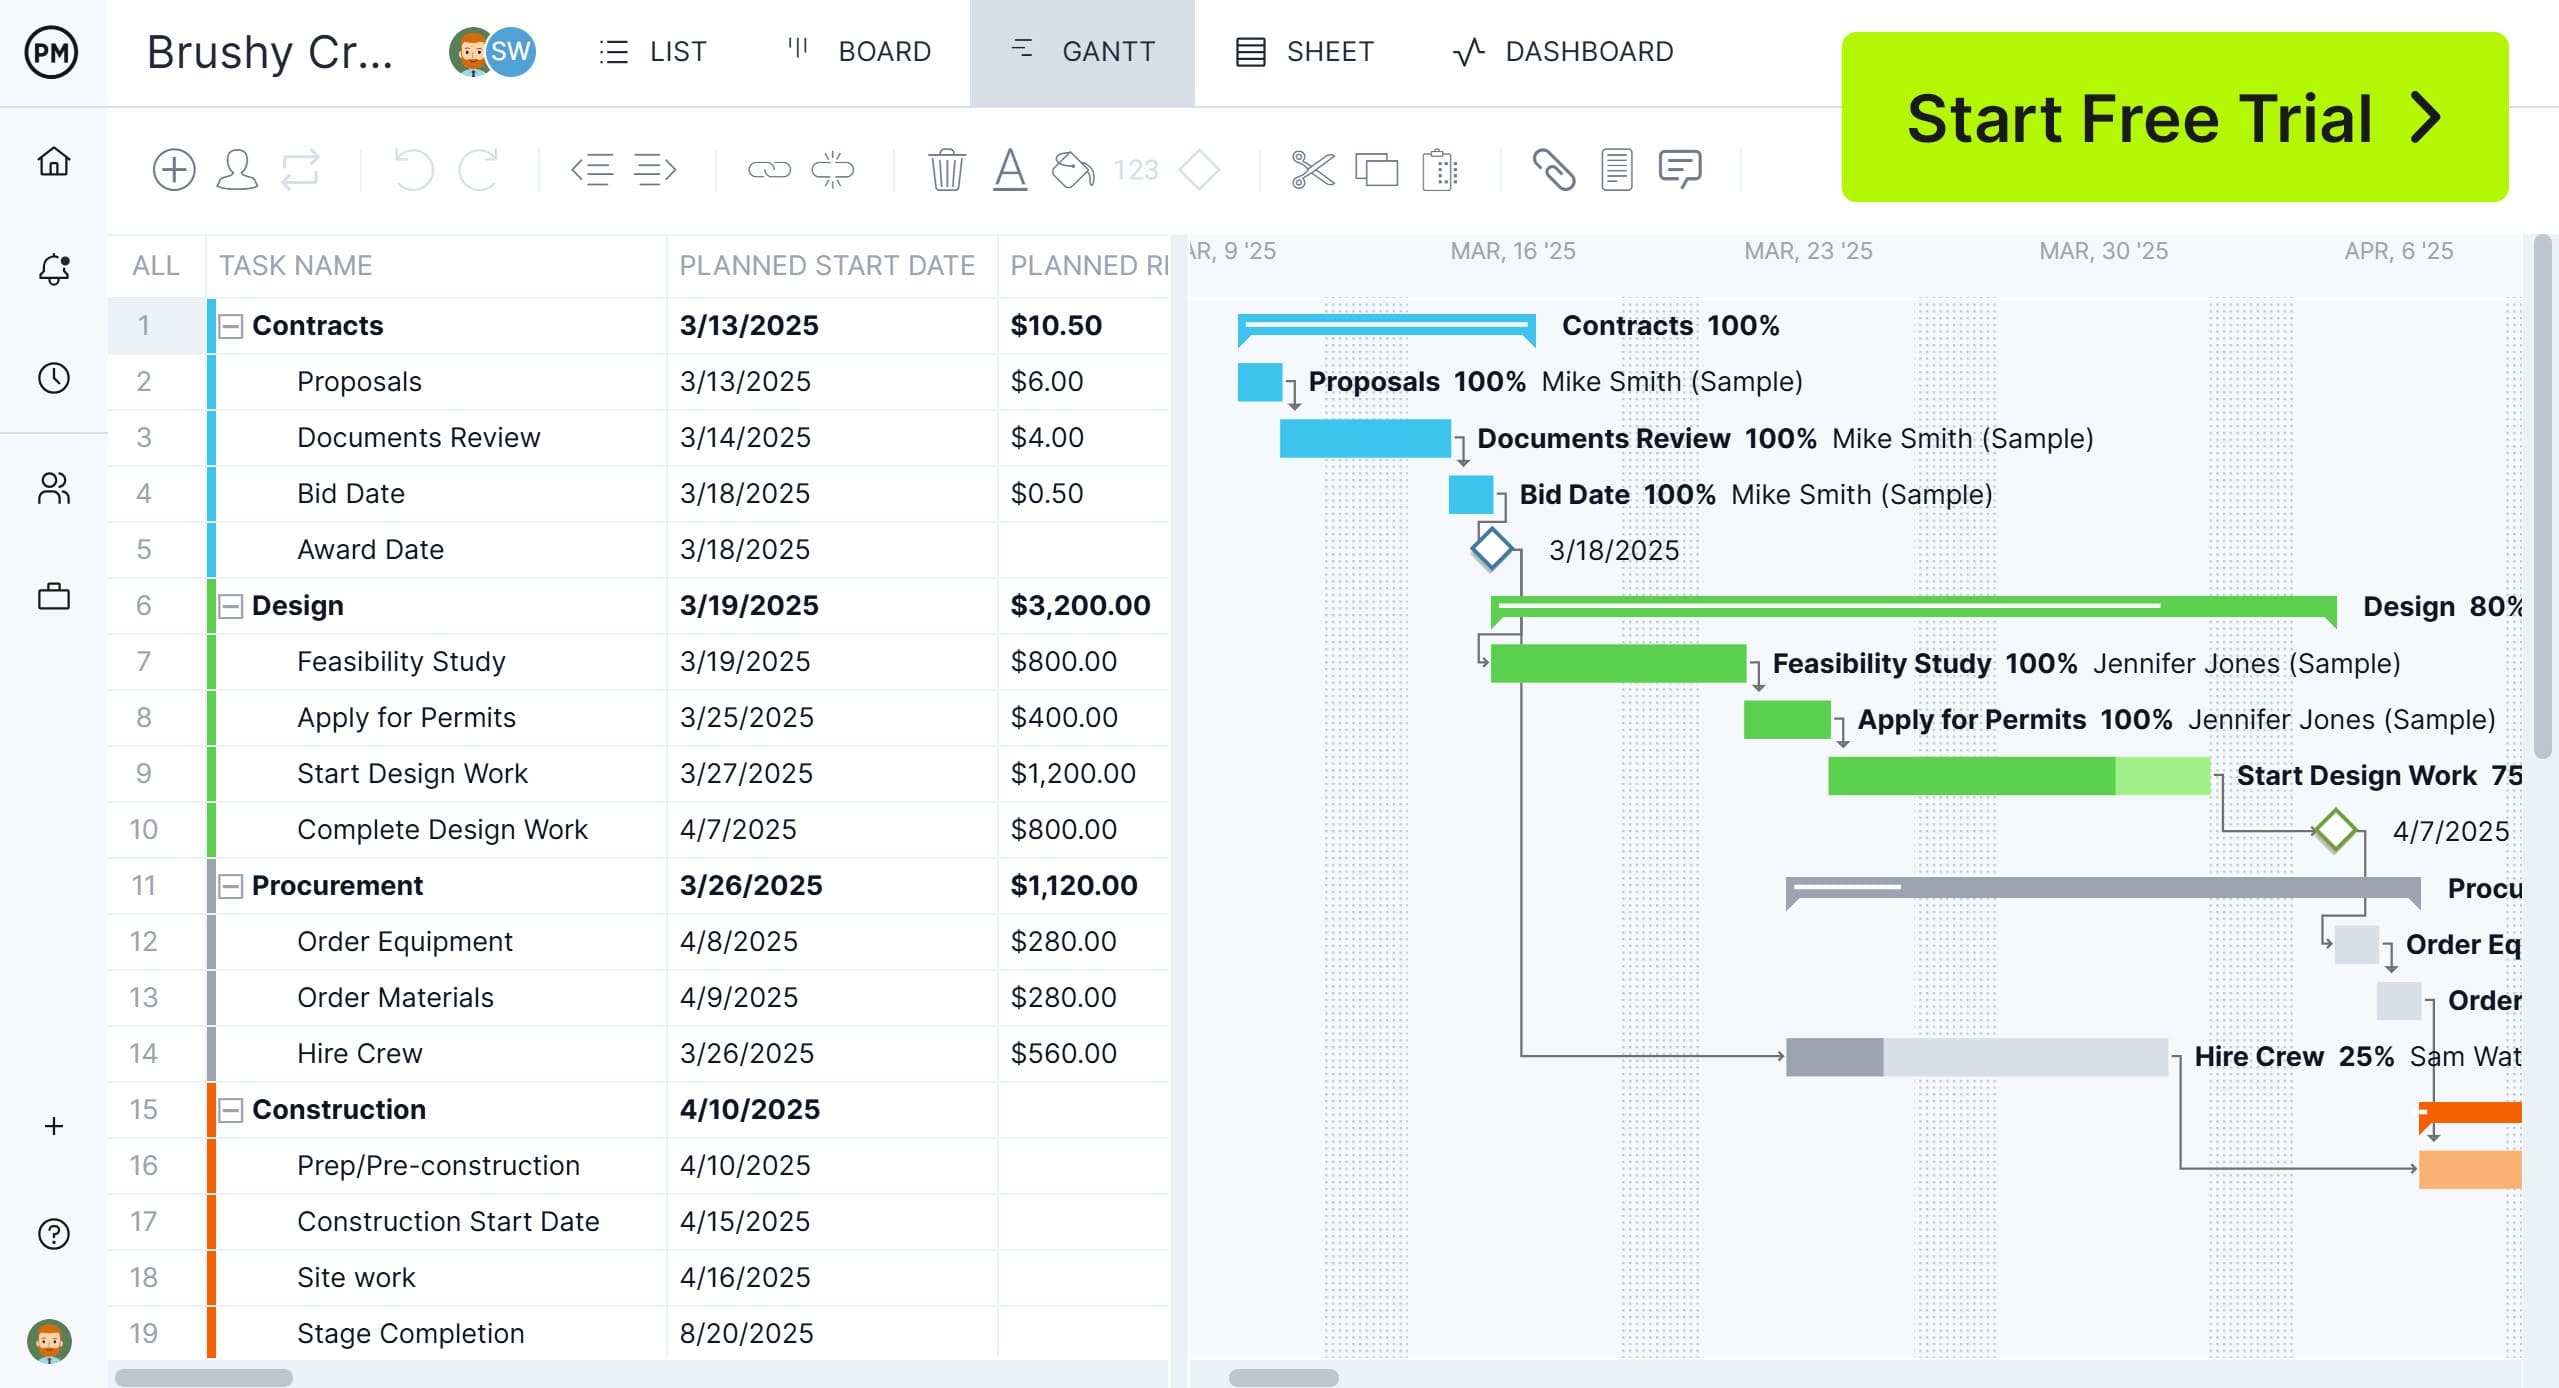
ProjectManager is award-winning project and portfolio management software with Gantt charts that are better than a PERT chart maker. Our Gantt charts automatically calculate the critical path, eliminating the need for manual analysis typically required with traditional PERT diagrams.
While PERT charts are designed to identify task sequences and project timelines, our software enhances that functionality with a dynamic Gantt view that visually maps out the entire schedule and highlights the critical path in real time. It also supports all four task dependencies, offering complete flexibility for complex project planning. Additionally, users can set a baseline to track planned versus actual progress, making it easy to monitor schedule variance and maintain control from start to finish. Get started with ProjectManager today for free.
But don’t take our word on it. Let’s give the competition a fair trial. Below are the best PERT chart maker software products on the market. We review what they can do and list the pros and cons of each so you can make an educated decision.
1. Microsoft Excel
Microsoft Excel can function as a PERT chart maker because it offers flexible spreadsheet tools and visual features like SmartArt, shapes and formulas that allow users to manually build project networks. Users can input task names, durations and dependencies into a table, then use diagrams to visually map out the sequence of activities. For basic project planning and early-stage scheduling, Excel provides a customizable and accessible way to represent PERT diagrams without the need for specialized software.
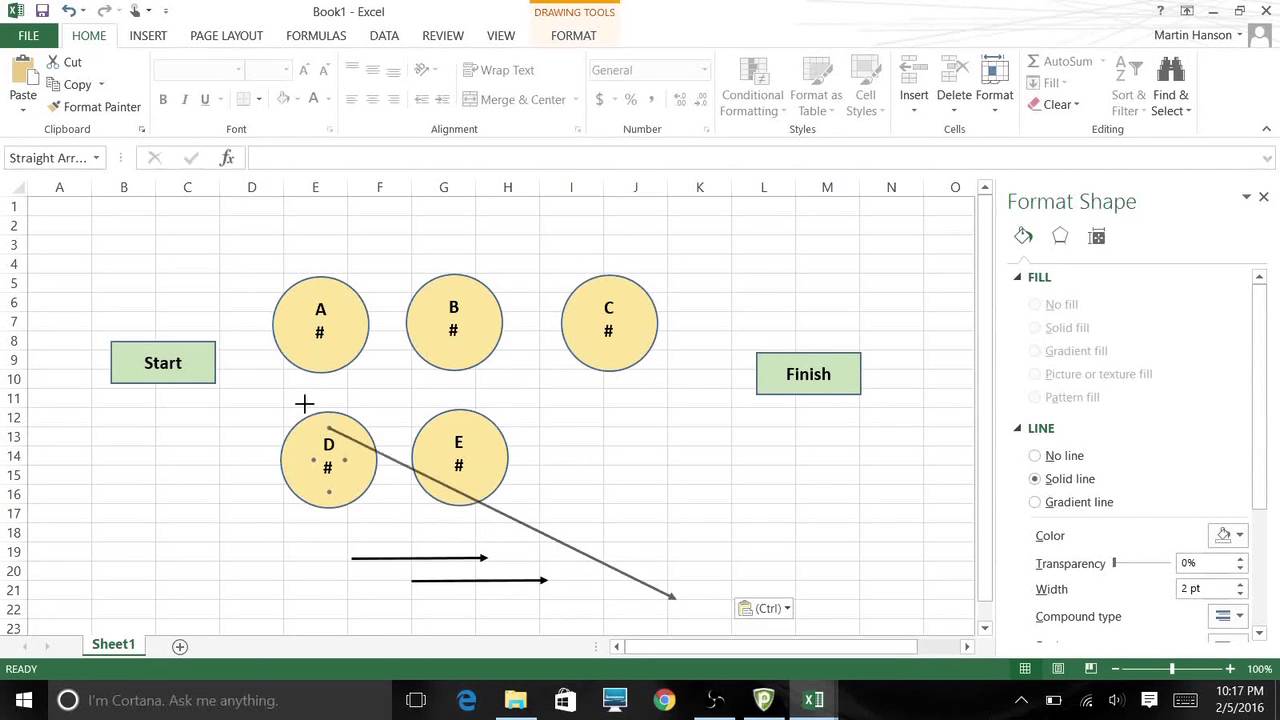
However, Excel is not ideal as a PERT chart maker because it lacks built-in project management capabilities like automatic critical path calculation, real-time updates or dependency tracking. Creating and maintaining PERT charts in Excel is time-consuming, especially for complex projects, and any changes require manual adjustments across the chart. It also doesn’t support advanced scheduling features like baseline tracking or multiple dependency types, making it less efficient and error-prone compared to dedicated tools like ProjectManager.
Pros of this PERT Chart Maker
- Microsoft Excel is free software
- Flexible spreadsheet tools can manually build project networks
- Task names, durations and dependencies can be added
Cons of this PERT Chart Maker
- Lacks built-in project management features
- No automatic critical path calculations
- Time-consuming process to create PERT chart
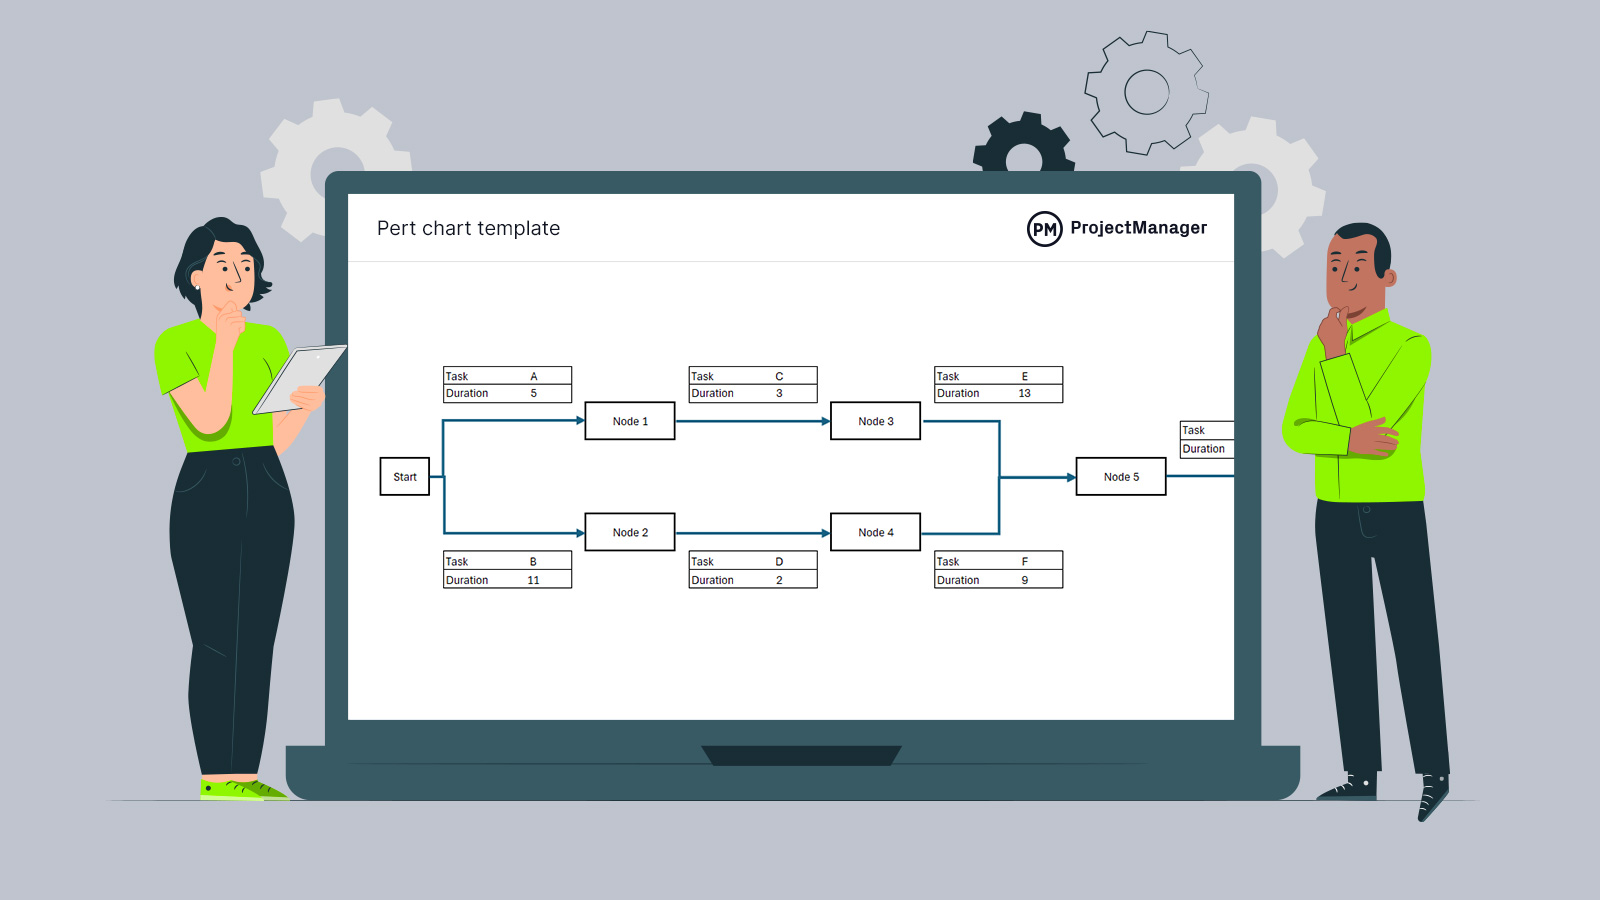
Get your free
PERT Chart Template
Use this free PERT Chart Template for Excel to manage your projects better.
2. Lucidchart
Lucidchart can be used as a PERT chart maker thanks to its intuitive drag-and-drop interface and strong diagramming capabilities. It allows users to create custom network diagrams by manually placing tasks, connecting them with arrows to show dependencies and labeling nodes with time estimates. Its collaborative features also make it easy for teams to co-edit and comment on charts in real time, making it a useful option for visually organizing a project’s workflow during the planning phase.
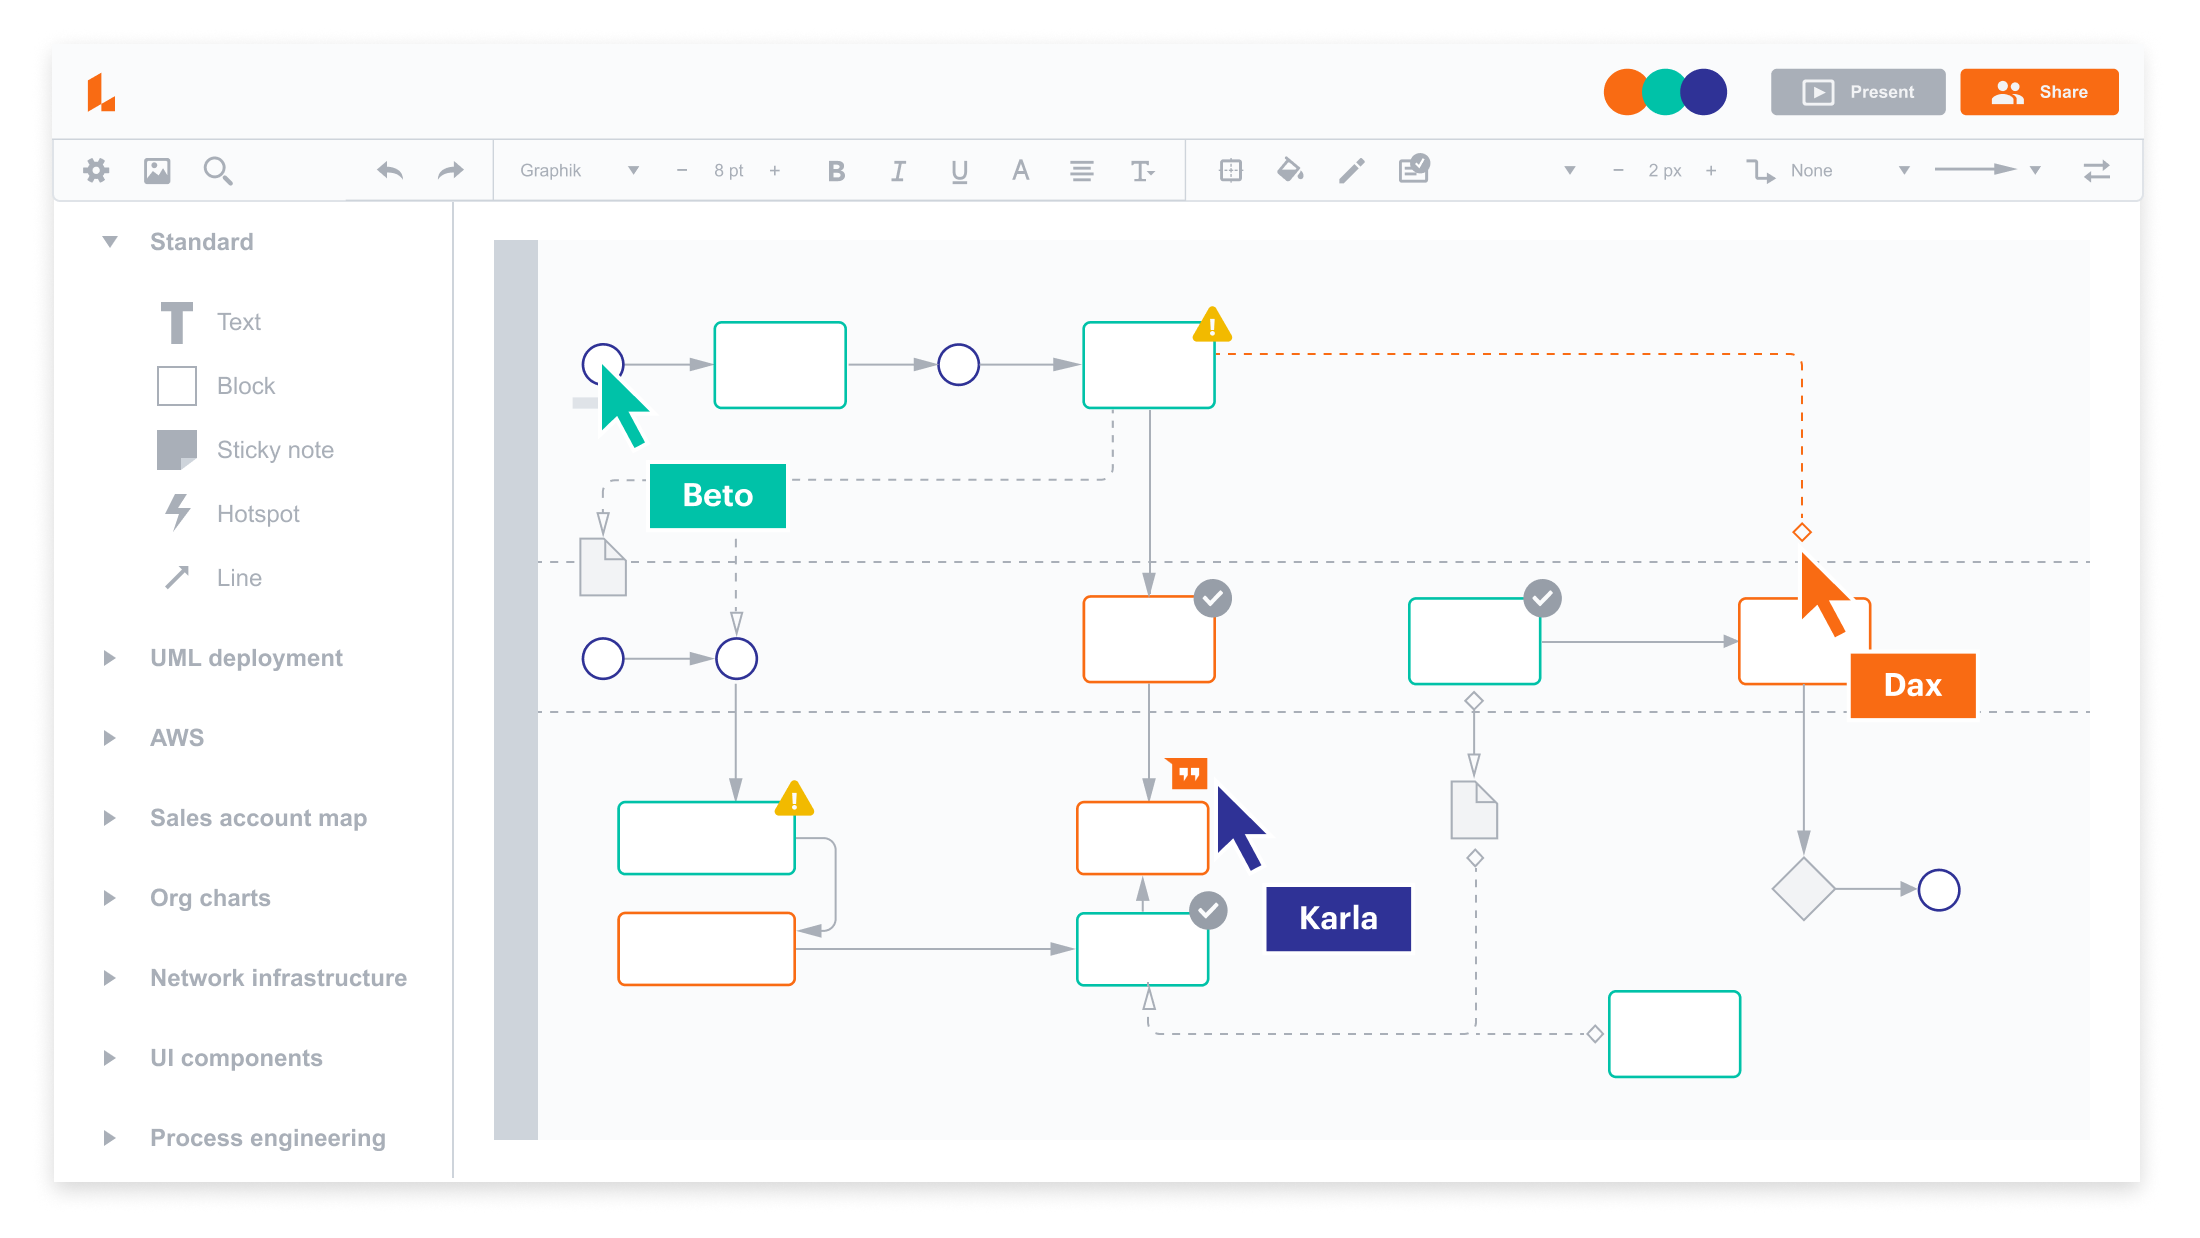
However, Lucidchart falls short as a robust PERT chart maker because it lacks integrated project management features like automatic critical path calculation, task tracking or timeline management. Since it’s primarily a diagramming tool rather than a project scheduling platform, users have to manually update task durations and dependencies, and there’s no real-time linking to actual project progress. This limits its usefulness for managing active projects or making data-driven adjustments as work evolves.
Pros of this PERT Chart Maker
- Strong diagramming capabilities
- Collaborative features allow teams to co-edit and comment
- Helps to visually organize projects during planning
Cons of this PERT Chart Maker
- No integrated project management features like critical path, task tracking or timeline management
- Users have to manually update task durations and dependencies
- Not real-time linking to actual project progress
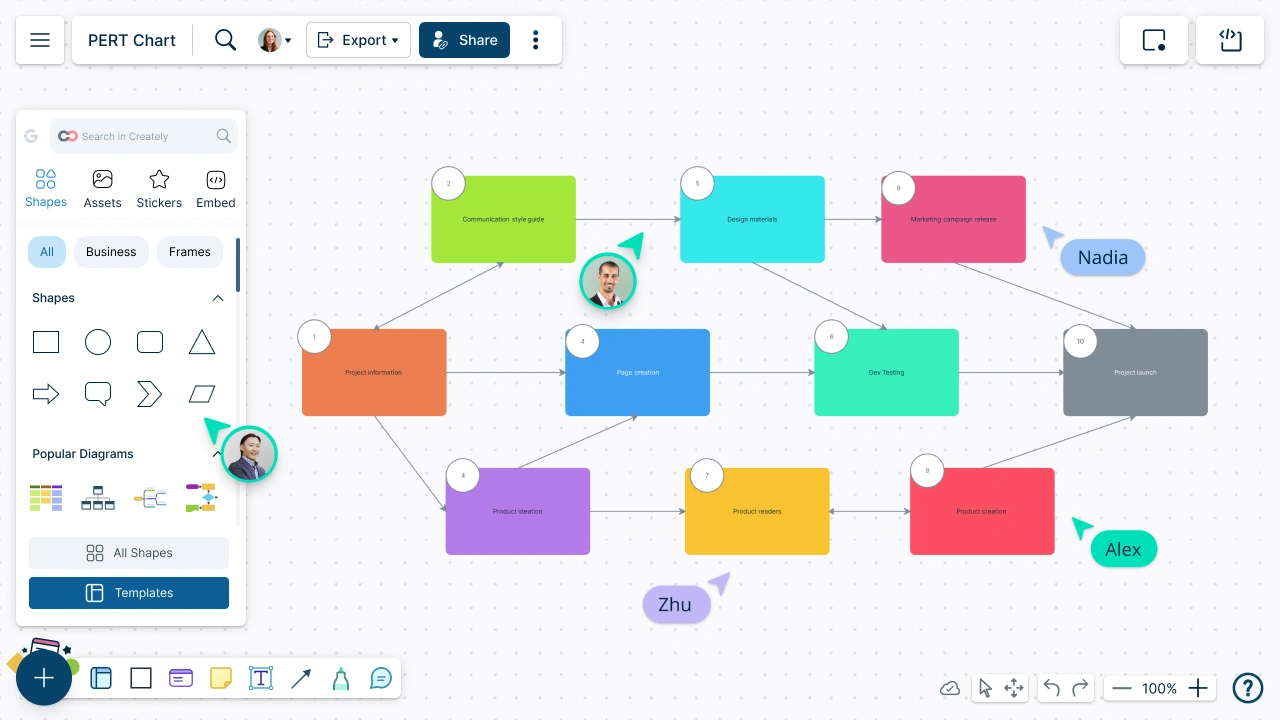
3. Creately
Creately can serve as a PERT chart maker because it offers an easy-to-use interface for building network diagrams with nodes, connectors and labeled dependencies. It provides ready-made templates for PERT charts and supports drag-and-drop functionality, making it simple to visualize project workflows and estimate task durations. With real-time collaboration features, Creately also enables teams to work together on diagram creation and share updates efficiently, which can be helpful during the early planning and brainstorming stages of a project.
However, Creately is not a fully capable PERT chart maker for managing complex projects because it lacks integrated project scheduling tools like automatic critical path analysis, task dependency logic or baseline tracking. Its focus is more on visual diagramming than on executing or updating project plans in real time. This means users must manually adjust timelines and relationships between tasks, increasing the risk of errors and limiting its practicality for ongoing project management.
Pros of this PERT Chart Maker
- Easy-to-use interface
- Ready-made PERT templates with drag-and-drop functionality
- Real-time collaboration features
Cons of this PERT Chart Maker
- Lacks integrated project scheduling like critical path analysis, task dependency and baseline tracking
- More visual diagramming than executing or updating project plans in real time
- Users must manually adjust timelines and relationships between tasks
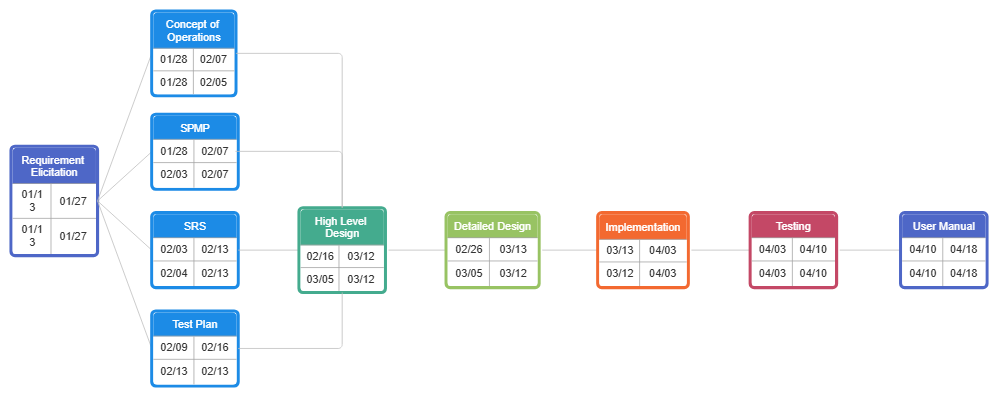
4. SmartDraw
SmartDraw is a good PERT chart maker because it offers specialized templates and diagramming tools specifically designed for project management workflows. Its user-friendly interface allows users to quickly build network diagrams with task nodes, duration labels and directional arrows to illustrate dependencies.
SmartDraw also integrates with tools like Microsoft Office and Google Workspace, making it easy to export or embed PERT charts into other documents and presentations. For teams looking to visualize project tasks and sequences clearly, SmartDraw provides a fast and visually polished solution.
However, SmartDraw falls short as a full-featured PERT chart maker because it lacks dynamic scheduling capabilities such as real-time updates, automatic critical path calculation or built-in task management. Since it focuses on creating static diagrams, any changes to task durations or dependencies require manual edits, which can become tedious and error-prone in complex projects. Without the ability to track progress or analyze timelines, SmartDraw is more suited to initial planning than to actively managing a project through completion.
Pros of this PERT Chart Maker
- Templates and diagramming tools designed for project management workflows
- User-friendly interface allows for quick-built network diagrams
- Integrates with Microsoft Office and Google Workspace
Cons of this PERT Chart Maker
- No real-time updates, automatic critical path calculation or built-in task management
- Requires manual edits to task dependencies and task durations
- No tracking ability or way to analyze timelines
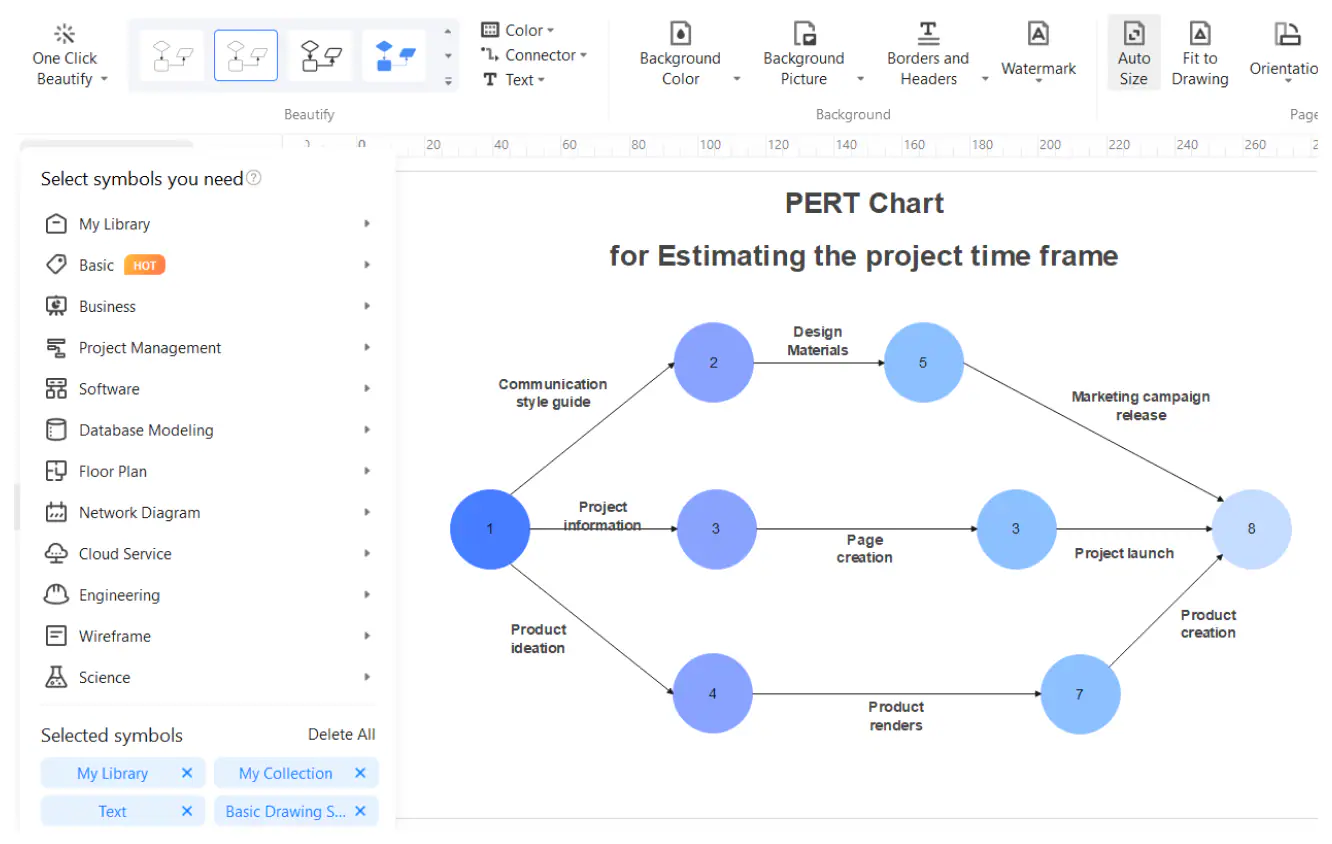
5. EdrawMax
EdrawMax is a useful PERT chart maker because it offers a wide range of pre-designed templates and shapes specifically tailored for project planning diagrams. Its intuitive drag-and-drop interface makes it easy to create detailed network diagrams that map task sequences, durations and dependencies.
EdrawMax also supports exporting to multiple file formats and integrates with common platforms like Microsoft Office, which makes sharing and presenting PERT charts straightforward. For visualizing the structure of a project and organizing tasks in a clear format, EdrawMax is a flexible and user-friendly tool.
However, EdrawMax is not ideal for managing complex projects because it lacks built-in scheduling intelligence, such as automatic critical path identification, real-time task tracking or resource allocation tools. Users must manually calculate timelines and update dependencies, which limits its effectiveness as a live project management solution. While it’s solid for visual design, EdrawMax does not support the dynamic project planning and execution features that dedicated project management software offers.
Pros of this PERT Chart Maker
- Has predesigned templates and shapes for project planning diagrams
- Intuitive drag-and-drop interface makes it easy to create network diagrams
- Supports exporting to multiple file formats and has integrations with Microsoft Office
Cons of this PERT Chart Maker
- No critical path identification, real-time task tracking or resource allocation tools
- Manual calculation of timelines and updated dependencies
- Does not support dynamic project planning and execution features
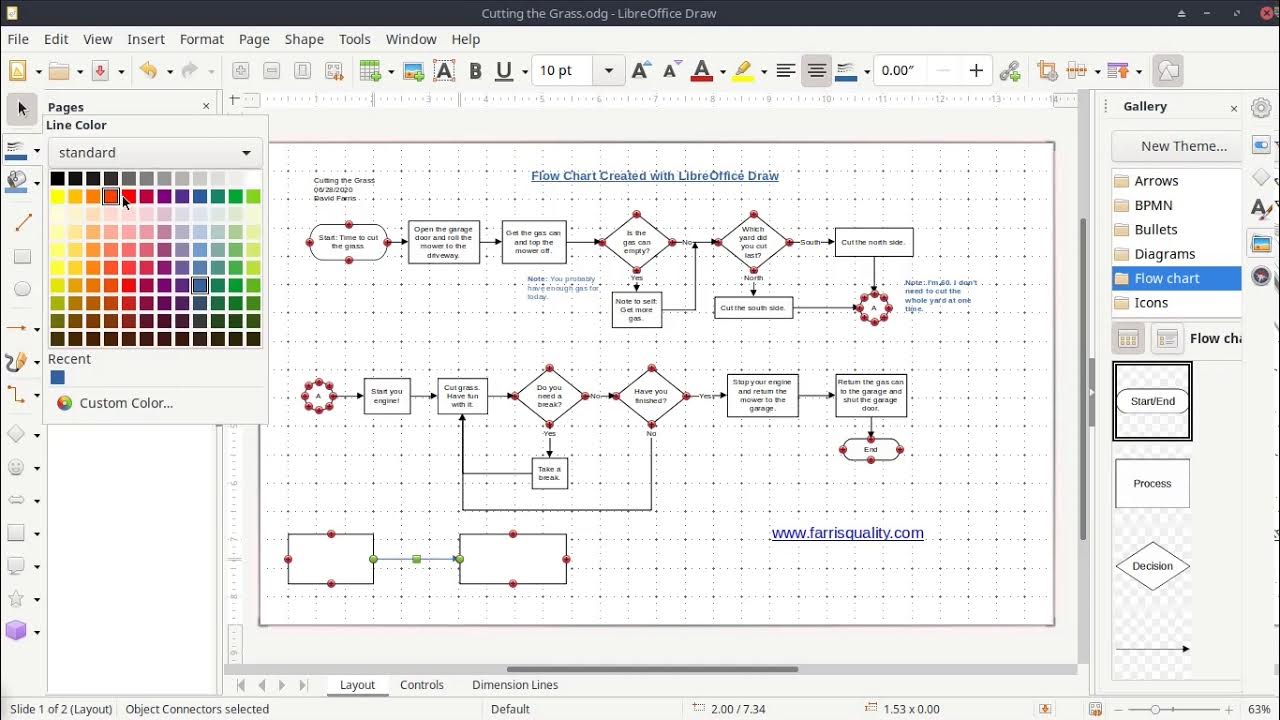
6. LibreOffice Draw
LibreOffice Draw can function as a basic PERT chart maker, which allows users to manually create network diagrams by placing shapes, connecting them with arrows and labeling tasks with durations. As a free and open-source suite, it’s accessible to anyone and offers customizable templates that can mimic PERT charts. For simple projects or users with limited resources, LibreOffice Draw provides a no-cost way to visually map out task sequences and dependencies without needing premium software.
However, LibreOffice Draw is not an ideal PERT chart maker for more advanced or dynamic project needs. It lacks features like automatic critical path analysis, real-time updates or task tracking, which are essential for managing evolving project timelines.
All chart creation and updates must be done manually, increasing the risk of error and making the process time-consuming. Without integration with broader project tools or built-in scheduling logic, LibreOffice is better suited for static visual planning than for comprehensive project management.
Pros of this PERT Chart Maker
- Free, open-source software
- Manually creates network diagrams and labels tasks with durations
- Offers customizable templates that can mimic PERT charts
Cons of this PERT Chart Maker
- Not ideal for advanced or dynamic project needs
- No critical path analysis, real-time updates or task tracking
- Chart updates must be done manually
Free Related Project Management Templates
Free templates can help with a PERT chart maker and planning for projects. While project management software is always better, these free project management templates are only a few of the over 100 free ones found on our site.
Gantt Chart Template
Download this free Gantt chart template to visually outline tasks along a timeline, making it easier to schedule, assign and track work. It includes columns for task names, start and end dates and durations, alongside a horizontal bar chart that maps each task to its place in the project schedule. Gantt chart templates help project managers quickly organize workflows, monitor progress and adjust plans as needed—all without having to build the chart from scratch.
Critical Path Template
Use this free critical path template to identify the sequence of dependent tasks that directly determine the project’s overall duration. It includes task names, durations, dependencies and calculated start and finish dates, highlighting which tasks are on the critical path—meaning any delay in these tasks will delay the entire project. This template allows project managers to focus on time-sensitive activities, optimize schedules and allocate resources efficiently to keep the project on track.
Project Dashboard Template
This free project dashboard template is a visual tool that consolidates key project data into a single, easy-to-read view. It includes metrics like task progress, deadlines, budget status, resource allocation and risk indicators. Designed to provide real-time insights at a glance, a project dashboard template helps stakeholders track performance, spot issues early and make informed decisions without digging through multiple reports or spreadsheets.
ProjectManager Is Better Than a PERT Chart Maker
ProjectManager goes beyond the limitations of a traditional PERT chart maker by not only identifying the critical path automatically but also integrating that analysis directly into a live project schedule. While PERT charts require manual input and recalculation as things change, our dynamic Gantt chart highlights the critical path in real time, allowing teams to instantly see which tasks impact the overall timeline.
Additionally, our platform includes robust resource management tools that help allocate team members efficiently, balance workloads across projects and forecast availability—capabilities that PERT chart tools simply don’t offer.
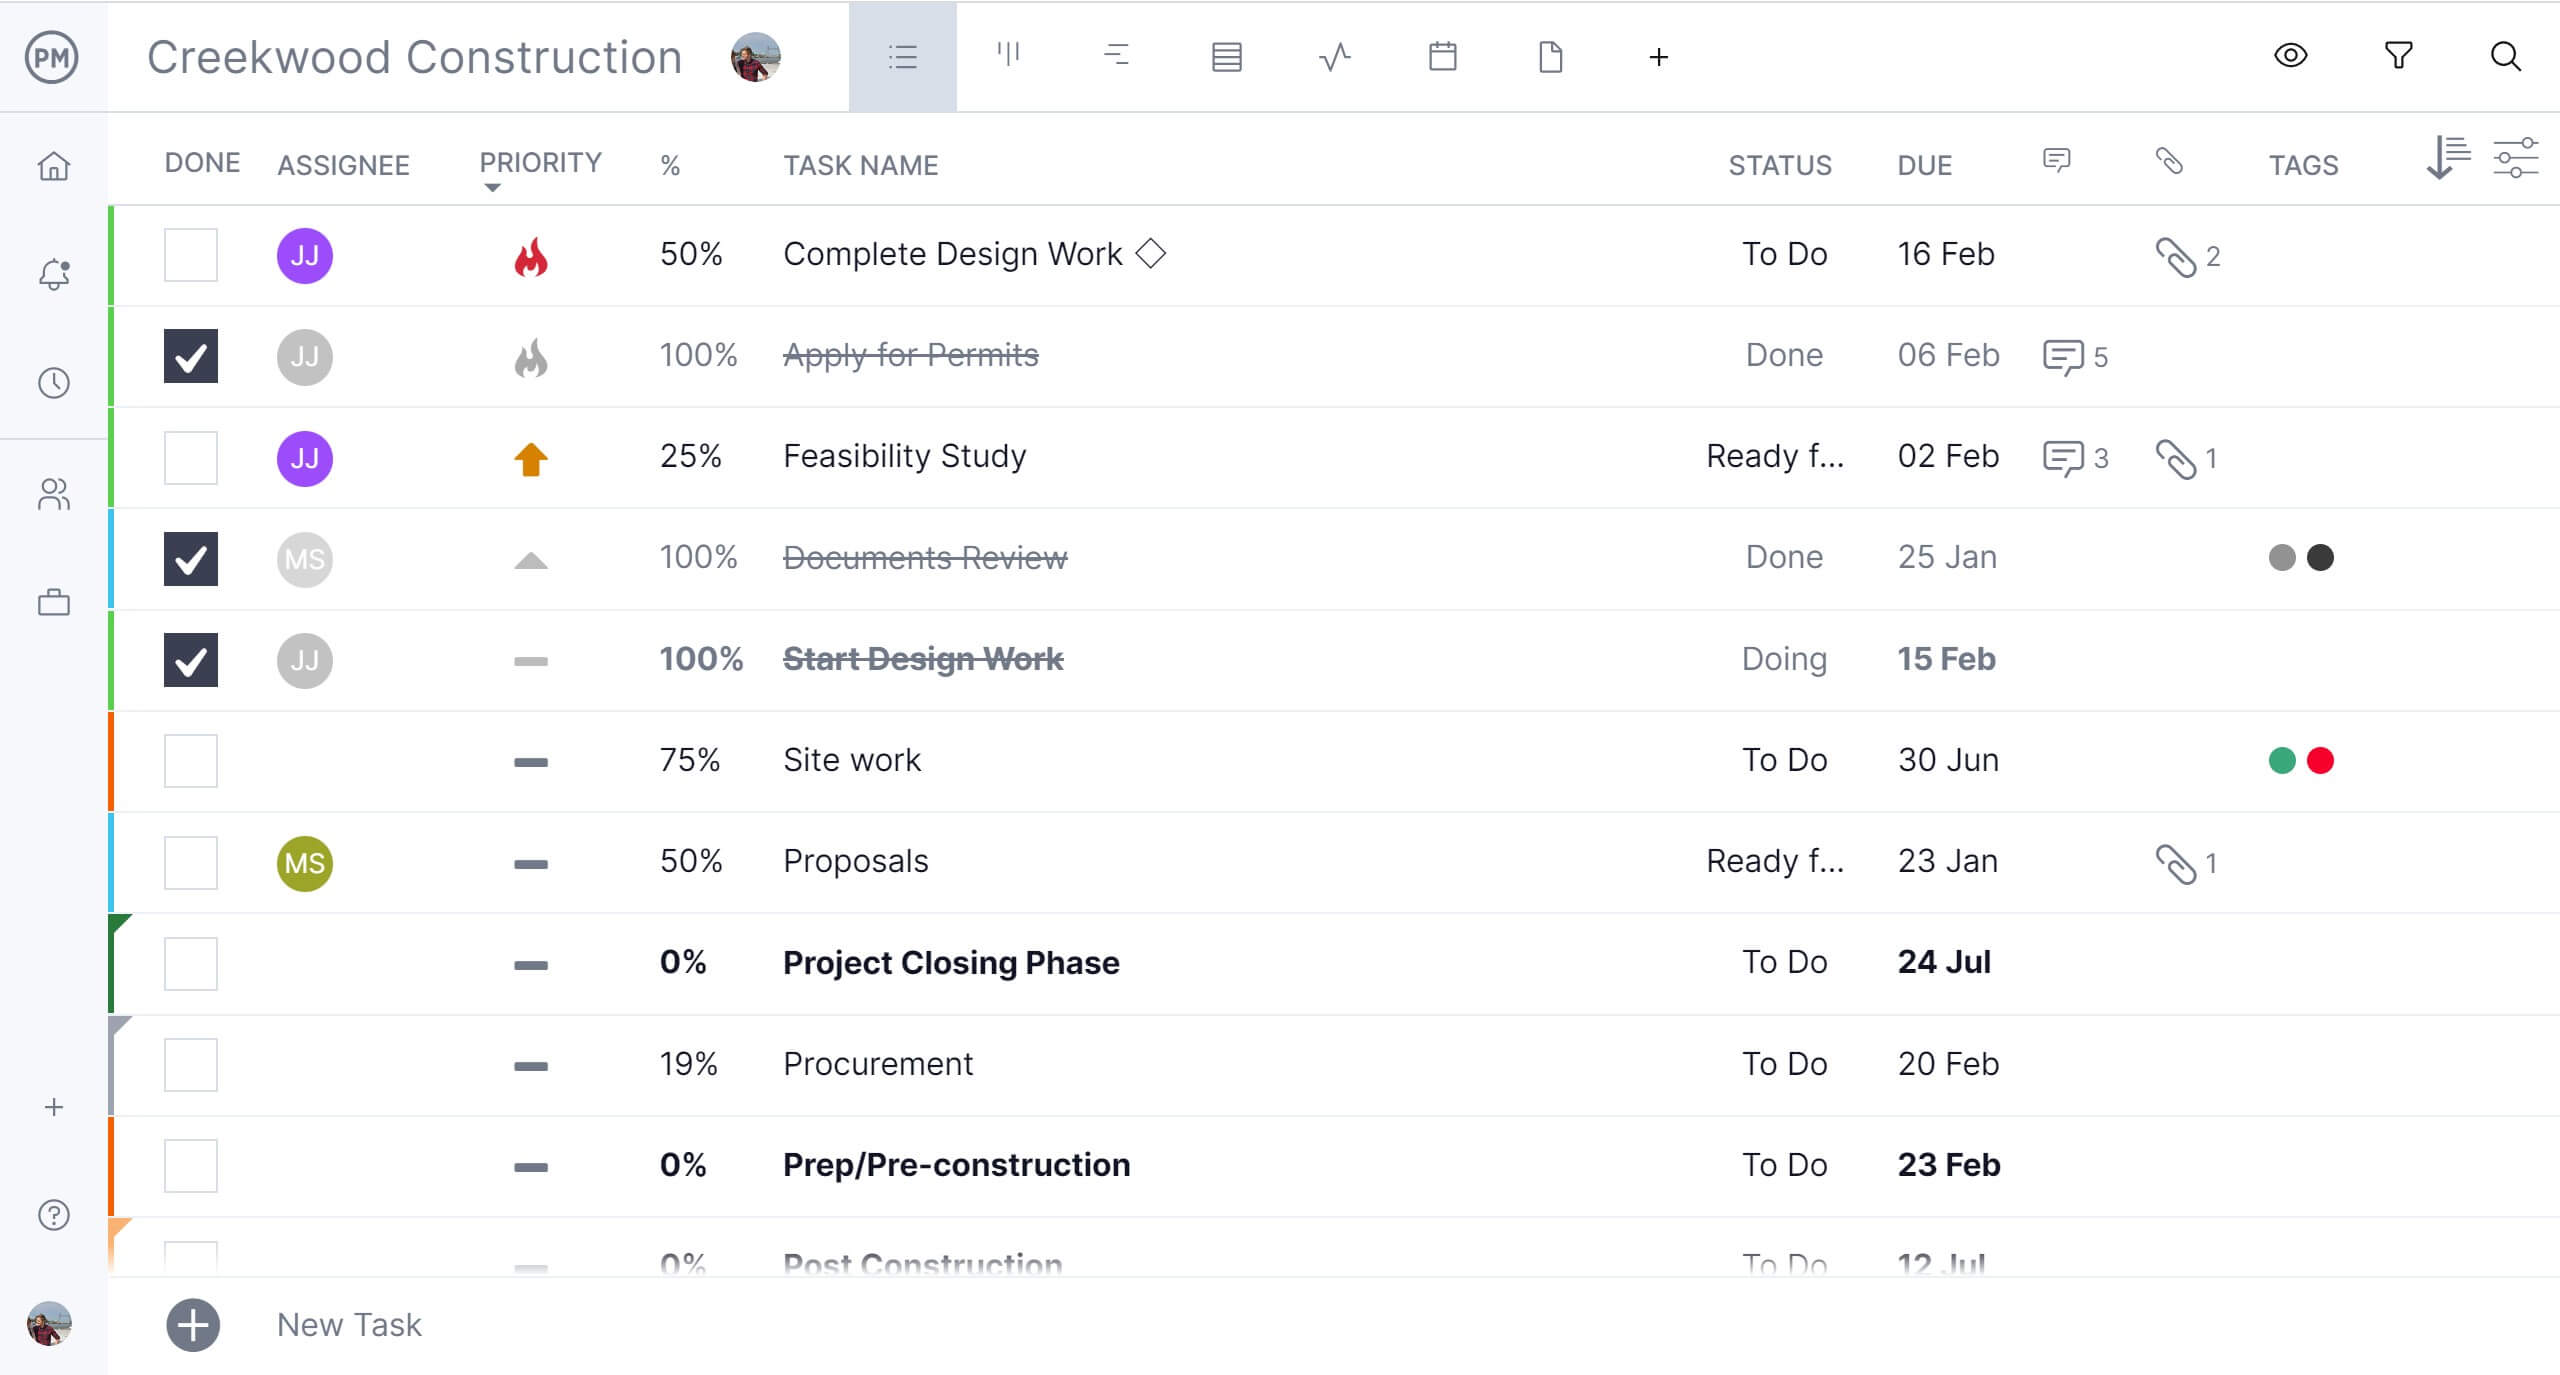
Keep Teams Aligned Across Multiple Project Views
Our multiple project views make it easier for everyone on the team to work the way they prefer without losing alignment. Whether users want to manage tasks through a Gantt chart, kanban board, task list or calendar, ProjectManager keeps all views synced in real time.
This flexibility improves collaboration and visibility across the organization while still preserving the structure needed to meet deadlines and goals. Project sponsors and team leads can get both a high-level overview and a detailed breakdown without switching tools or exporting data.
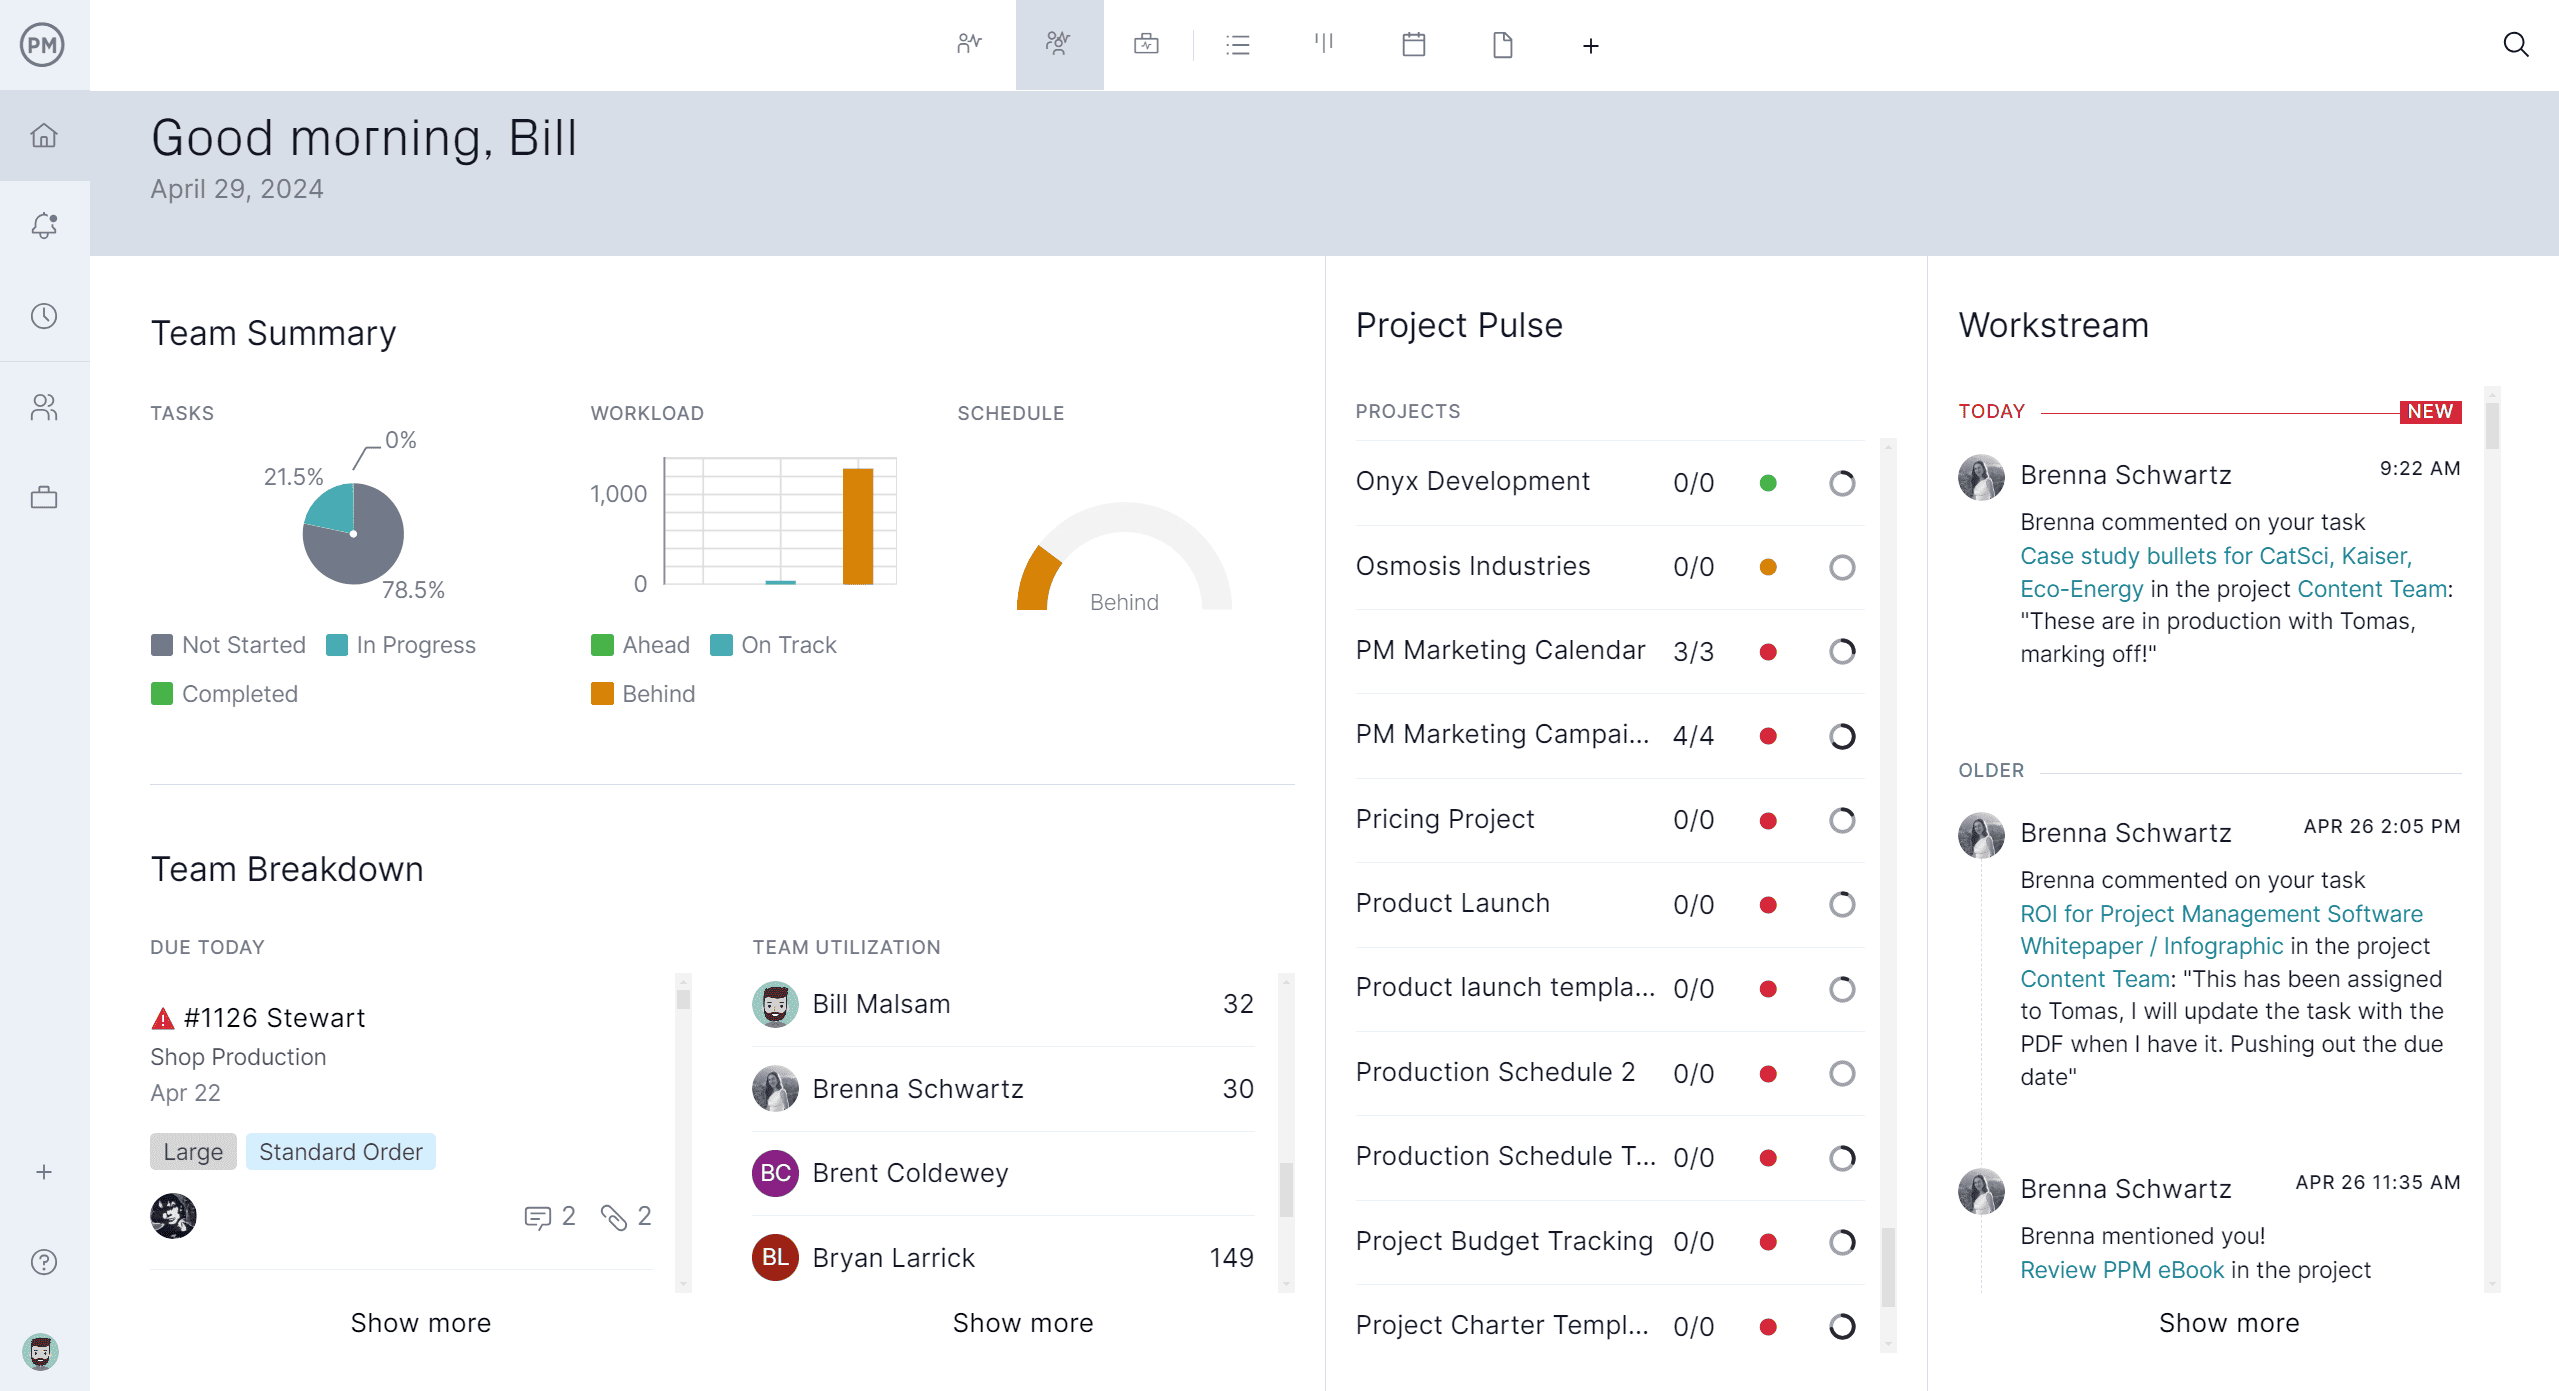
Track Projects With Real-Time Dashboards and Reports
ProjectManager also outperforms basic PERT tools with advanced tracking features that are built into every project. Real-time dashboards show live updates on task progress, budget usage and time logged, allowing managers to catch delays or overruns before they escalate.
Automated reports can be generated and shared with stakeholders at any time, and baseline tracking enables you to compare your original plan to current performance. These monitoring tools are essential for staying in control of your project and are simply not possible with static PERT chart makers.
Related PERT Content
A PERT chart maker can be helpful, but one must first understand what a PERT chart is. Check out the links to the blog posts below, which cover that and also go into how PERT differs from the critical path method and Gantt charts.
- PERT Chart: The Ultimate Guide (with Examples)
- PERT and CPM: Their Differences and How to Use Them Together
- Gantt Chart vs. PERT Chart vs. Network Diagram
ProjectManager is online project and portfolio management software that connects teams whether they’re in the office or out in the field. They can share files, comment at the task level and stay updated with email and in-app notifications. Join teams from Avis, Nestle and Siemens who are using our software to deliver successful projects. Get started with ProjectManager today for free.
