The better team members know their roles and responsibilities, the better a project will run. The last thing you want on a project is confusion, so communicating role distinctions early on in the project is crucial.
A RACI chart allows project managers to do exactly that. It’s an efficient way to ensure everyone is on the same page and understands what they have to do.
What Does RACI Stand For?
RACI stands for responsible, accountable, consulted and informed. Each letter is a category that’s used on the RACI matrix to define team members’ roles in a project.
What Is the RACI Model in Project Management?
The RACI model is a project management tool used to define the roles and responsibilities of key project team members and their level of involvement with project tasks. This is helpful when defining the project scope, making a project plan and managing project workflows. It prevents poor decision-making and reduces confusion about who is working on what.
That doesn’t mean a RACI model in project management is without disadvantages. It must be reviewed and updated regularly or risk becoming obsolete as changes to the project plan are made. These models can also be difficult to decipher when applied to large project teams.
What Is a RACI Chart?
A RACI chart is a visual tool that shows the roles and responsibilities of team members for project tasks and deliverables. This makes it clear who is doing what in the project and avoids any confusion that could slow down production and eat into costs.
Project management software with team management and reporting tools makes it easy to define the roles and responsibilities of your team members while keeping stakeholders informed. ProjectManager, for instance, has online team collaboration tools that allow you to assign work, track and collaborate with your team in real time. Unlike lightweight products, there’s no setup required. Get started for free.

Let’s take a closer look at what RACI stands for and the significance of each category in the responsibility assignment matrix.
Responsible
Each task must have at least one responsible team member who does the work to complete the task. There can be, however, more than one responsible party assigned on the RACI matrix.
Accountable
This team member is in charge of delegating work and approving deliverables before they can be deemed complete. Sometimes the responsible team member is also accountable on the RACI chart. But every task must have one accountable person attached to it, and it’s not always the project manager.
Consulted
This team member will review a deliverable, providing feedback that puts the deliverable in context to the whole project or just within its expectations.
Informed
These are the team members who must know what’s happening with the execution of tasks but don’t have the same level of responsibility as those listed above. They can be given a general report on progress rather than digging into the details.
RACI Chart Example
Now that we’ve learned about the responsible, accountable, consulted and informed roles and their responsibilities, let’s look at a RACI chart example.
The RACI template below shows the project tasks in the left column, while the team members are shown in the top row. We can see that the RACI model allows assigning each person a different role for each task.
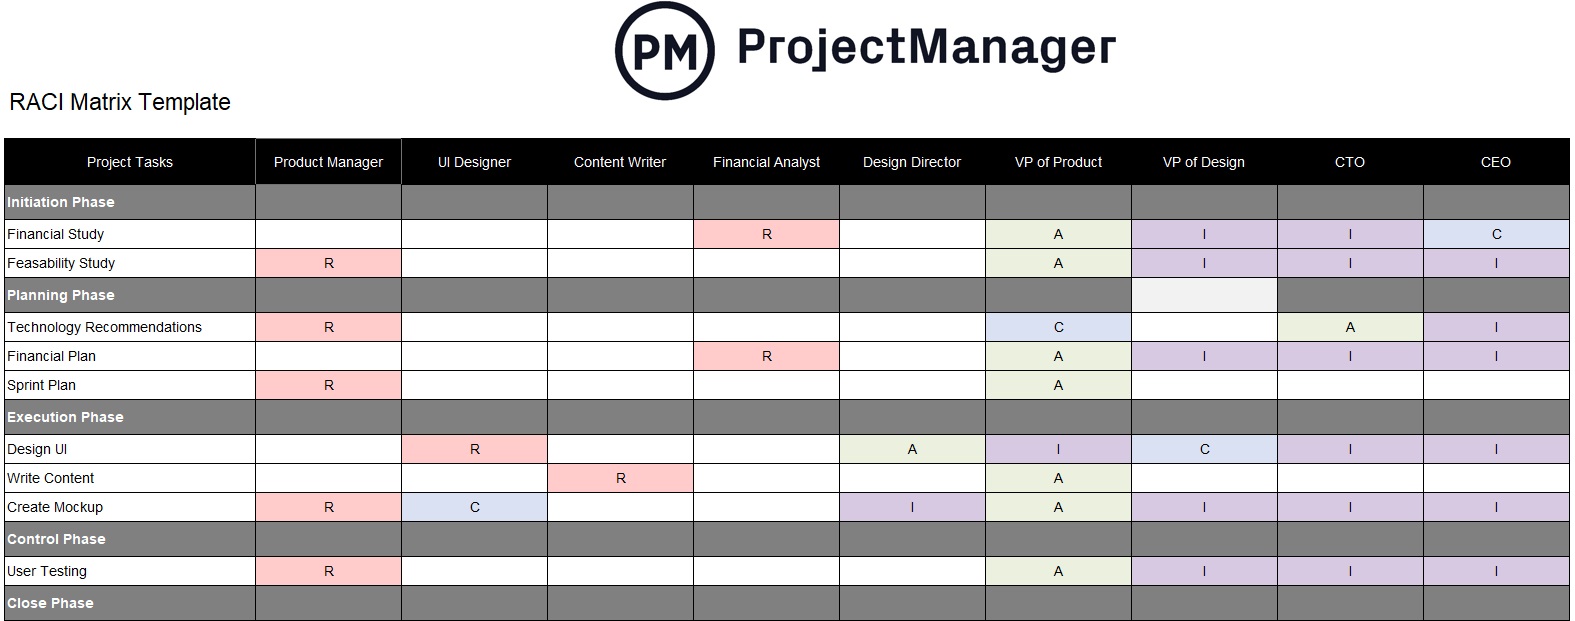
Let’s review this RACI matrix example more closely to better understand the roles and responsibilities of each team member.
- Responsible (R): The product manager, UI designer, financial analyst and design editor are responsible for executing most of the project tasks.
- Accountable (A): The VP of product acts as a liaison between the product team and executives such as the CTO and CEO, therefore he’s accountable for the outcome of project tasks executed by the responsible team members.
- Consulted (C): The VPs and executives are consulted for critical tasks that need their feedback such as the feasibility study, technology recommendations and product UI and design decisions.
- Informed (I): Executives must be informed of the progress of all project tasks. A communication plan should establish the channels of communication and frequency of reporting.
Responsible vs. Accountable Categories in the RACI Model
Responsible and accountable might be confusing to some as they can seem as if they’re defining the same role. However, there’s a difference between these two distinctions in a RACI chart.
The responsible role in a RACI chart focuses on executing a task while the accountable role owns those tasks and is responsible for the outcome. Therefore, the responsible role executes the work such as completing the task, making decisions or achieving an objective. This can be multiple people on the project team, but at least one person per task.
The same person can be responsible and accountable for the task, but it’s better to separate those roles, especially in a larger project team. The accountable role is a stakeholder who owns the task and is responsible for it being done correctly. They sign off on the task when the responsible role has completed the work. This could be the project manager or project sponsor.
How to Create a RACI Chart
All projects can benefit from the clear expectations provided by using a RACI chart, but it’s especially helpful when managing multiple resources or having task dependencies.
To flesh out the process of making a RACI chart, let’s create a project using a RACI matrix example. Let’s say you’re building an addition to your home. These three steps will outline how you create a RACI matrix.
1. Identify Roles & Responsibilities
Across the top of your RACI chart template, list the people involved in the project including the client or homeowner who is having the construction done. Then there’s the architect, who is responsible for drawing the plans. The project manager is overseeing the whole project execution from start to finish. There’s a contractor, who, with their team, is responsible for the actual build. There are likely to be many more subcontractors, such as electricians, roofers, etc., but we’ll keep our RACI model simple.
2. List Tasks, Deliverables and Milestones
Next, you want to have a thorough list of the tasks, including milestones, and any decision-making processes to be listed in the far-left column. This includes tasks like reviewing the plans by the architect, estimating the budget, getting permits, preparing the site and doing any necessary excavation. You might have to lay a foundation, add a plinth beam and slab, masonry, flooring or roofing, doors and windows, electrical and plumbing, fixtures, etc.
3. Assign Tasks, Roles and Responsibilities
Under each person on the project team add the R (Responsible), A (Accountable), C (Consulted) or I (Informed), depending on their relation to the tasks on the left column. For example, the architect would be the responsible team member for delivering the completed project plan, while the project manager would be accountable for making sure that the plan is compliant with any regulatory issues. The client or homeowner would be consulted to ensure the plans meet their specifications, but much of the actual build would only be informed of the progress.
RACI Chart Template for Excel
Now that you understand how RACI charts work, you can use our free RACI chart template to help get started.
Get your free
RACI Matrix Template
Use this free RACI Matrix Template for Excel to manage your projects better.
Download your template and keep reading to learn how to create a RACI matrix. Or if you prefer, you can try our RACI matrix template for Google Sheets.
RACI Matrix Template for Google Sheets
Download a free RACI matrix template for Google Sheets to better organize projects and manage them more effectively. This will not only help everyone in the project understand their roles and responsibilities, but because it’s a Google Sheet, it can be shared and when updated everyone on the team’s RACI chart is updated. This is much better than using a static Excel spreadsheet to make a RACI chart.
When to Use a RACI Chart
RACI charts are an effective project planning chart that facilitates managing teams’ and stakeholders’ expectations. While they’re versatile and simple to use, they might not be the best fit for some projects. Here are some of the best scenarios to use a RACI chart.
- When tasks require collaboration: Some projects involve more cross-functional teamwork than others. RACI charts are useful for project tasks that involve the input of multiple parties.
- When there are many task dependencies: Knowing who’s responsible, accountable, consulted and informed for a task is very useful when managing task dependencies.
- When projects require lots of decision-making: Some projects such as product development projects involve constant customer feedback and decision-making when deciding what product features to launch next. RACI charts are a great way to assign roles and responsibilities for both team members and stakeholders so that the decision-making process is as smooth as possible and only involves the right people.
- When starting projects: Defining roles and responsibilities is a need of any project team. Using a RACI chart at the beginning, during your ideation and planning stages is always advisable.
- When onboarding new team members: RACI charts are simple to understand. Their simplicity makes them a great new team member onboarding tool, as it allows new members to quickly understand how they fit into the team with just one quick look.
Benefits of Using a RACI Chart
The more structure, direction and clear definition you can give your project team, the better suited they will be to get their work done on time and without wasting valuable resources. Here are some of the top benefits of using a RACI chart.
- A RACI chart sets expectations and accountability as everyone is aware of what they and the rest of the team do
- RACI charts are simple to read and use for both team members and stakeholders
- RACI charts are a great way to avoid having too many resources allocated to one task
- By helping team members understand each other’s roles, RACI charts can foster team collaboration
- RACI charts help avoid having “too many cooks” for certain tasks and decisions
As a bonus, these definitions remove many personality issues and office politics that hinder productivity. You’ve given your team a RACI framework, so they know where they stand and where other team members stand. Teams are happier this way, and it streamlines communications. Team members can look back at the RACI chart at any time during the project and know who is responsible for what, instead of having to pull everyone away from what they’re doing.
Disadvantages of Using a RACI Chart
There are pros and cons to using the RACI model to manage your project teams. Here are some of the most common disadvantages of using a RACI matrix.
- RACI charts can become obsolete if changes are made to the project schedule, budget or team roles
- RACI charts can become hard to read for large teams
- The RACI model roles might not exactly reflect what your team members and stakeholders do
- The RACI model might slow down certain tasks and deliverables, as they require the involvement of multiple people
RACI Chart Alternatives
RACI isn’t the only way to map the roles and responsibilities of a project team. Many other project management tools can enable teams to visualize who is responsible for what. Below are three examples of RACI chart alternatives.
RASCI vs. RACI
As the name suggests, this is very similar to a RACI chart. The only difference is that this model adds another letter, which stands for “supportive.” Supportive team members will help “responsible” team members with their tasks.
This visual tool used in project management can improve team efficiency, speed up decision-making, reduce conflict and improve morale, communication and collaboration among the project team. It also helps avoid confusion, which increases team satisfaction and, in so doing, boosts productivity. Finally, a RASCI chart can proactively identify and address potential issues in a project.
DACI vs. RACI
A DACI chart, like a RACI chart, is a responsibility assignment matrix. DACI stands for Driver, Approver, Contributor and Informed. It can be a great alternative to RACI charts, as these roles are the best fit for some teams.
A driver is someone who initiates the decision and is responsible for keeping stakeholders aware. The approver has the final say in approving the decision, which is usually given to a manager. Contributors are the team members who provide input and expertise to aid the project and the informed are the ones who need to be kept updated on major project changes but don’t participate in decision-making or executing tasks.
RAPID vs. RACI
Another responsibility assignment model that’s especially good for projects with intensive decision-making. RAPID stands for Recommend, Agree, Perform, Input and Decide. The RAPID matrix clearly defines authority and accountability, reducing conflicts.
Organizations can use both the RAPID and the RACI charts to ensure accountability and order throughout the team and departments during the execution of a project. RAPID charts can help decide what to do and the RACI chart can delegate the responsibilities and execute that decision.
Related Project Management Templates
We’ve created over 100 project management templates for every phase of the project life cycle, including some that can be used for similar purposes to RACI charts. Here are some of them.
Team Charter Template
A team charter is a project management document that defines the roles and responsibilities of team members as well as the resources that will be available to them.
Task Tracker Template
This free task tracker template for Excel helps project managers and other team leaders assign tasks to employees and track their progress over time.
SIPOC Template
A SIPOC chart is a simple workflow planning tool that helps businesses estimate the input and output of their business processes and identify their suppliers and customers.
ProjectManager Is Better Than RACI Charts
With ProjectManager, you can achieve much more than by only using RACI charts and other static documents. Everyone on the team can keep track of their tasks and can check them off as completed. The project and due date are also listed. Just click on an individual task for even more details. Team members can add their to-do list to the task to manage their work and keep them on track.
Project managers can keep up on the team’s progress with the real-time dashboard, which follows six project metrics that are updated instantly when team members update their work. For more in-depth analysis, ProjectManager has one-click reporting that provides detailed data on task progress, costs and workload, among others.
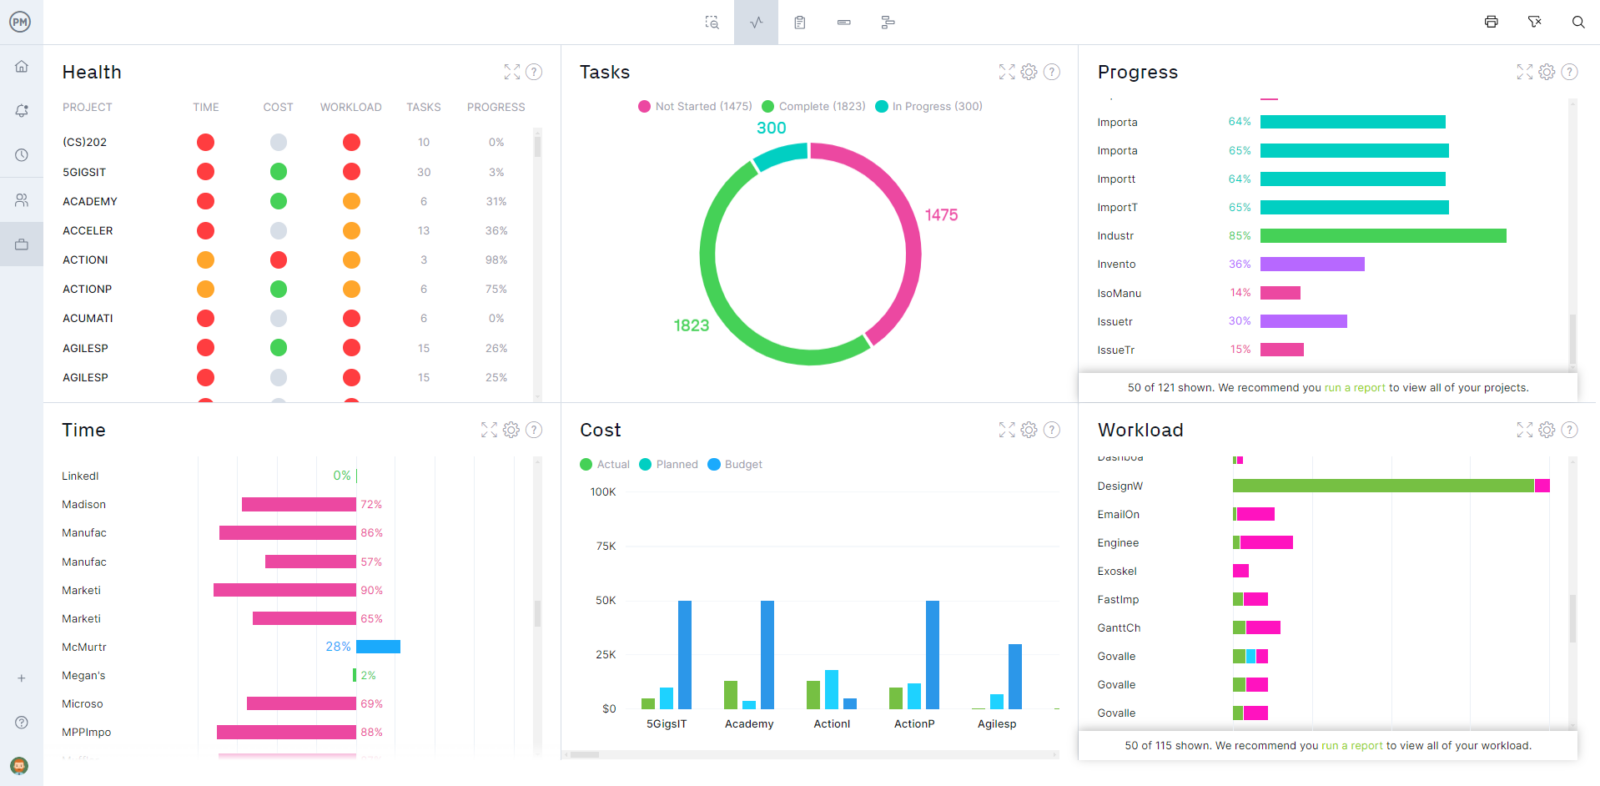
There’s a workload page that allows project managers to make sure that no one team member is under or over-allocated. ProjectManager goes beyond a responsibility assignment matrix and helps you better manage your teams, make data-driven decisions and optimize your project resources in real-time.
Related RACI Chart Content
In addition to our free project management templates, our website is packed full of useful resources. Here are a few other blogs and training videos that can help you manage stakeholders better.
ProjectManager is online project management software that takes the roles and responsibilities defined on your RACI chart and turns them into a dynamic tool to manage teams and workloads. Project managers get transparency into the project to monitor progress and reallocate resources to keep team members from getting blocked. See how ProjectManager can keep your team members accountable and productive by taking this free 30-day trial today.
