Efficient manufacturing and service delivery depend on understanding how well resources are being used. Capacity utilization is a key metric that measures the proportion of a facility’s or system’s production capability that is actually being used. By tracking this metric, businesses can identify underused resources, optimize workflows and improve overall operational efficiency. Companies that consistently monitor their capacity utilization rate can reduce waste, improve output and better align production with market demand, which ultimately boosts profitability.
Understanding how to calculate capacity utilization and apply it in everyday operations is essential for managers, production planners and operations teams. This guide covers what capacity utilization is, the formula for calculating it, how to interpret the capacity utilization rate, and why it matters. It also includes a practical example, a capacity planning template and insights into how project management tools like ProjectManager can help monitor and improve capacity utilization in manufacturing projects.
What Is Capacity Utilization?
Capacity utilization is a measure of how efficiently a company uses its available production resources to generate goods or services. It evaluates the proportion of maximum potential output that is actually produced in a given period. High capacity utilization indicates that resources such as machinery, labor and equipment are being effectively used, while low utilization signals inefficiencies or excess capacity. For businesses, understanding what capacity utilization is helps in strategic planning, resource allocation and identifying operational bottlenecks.
Monitoring capacity utilization is especially important in manufacturing, where equipment costs and labor represent a significant portion of total expenses. By measuring how much of the production potential is being used, managers can make informed decisions about scaling operations, adding shifts, investing in new equipment or improving workflow efficiency. For example, a factory running at only 60% capacity might be wasting energy and labor, while one running near 100% may risk overworking equipment or employees, leading to maintenance issues or quality problems.
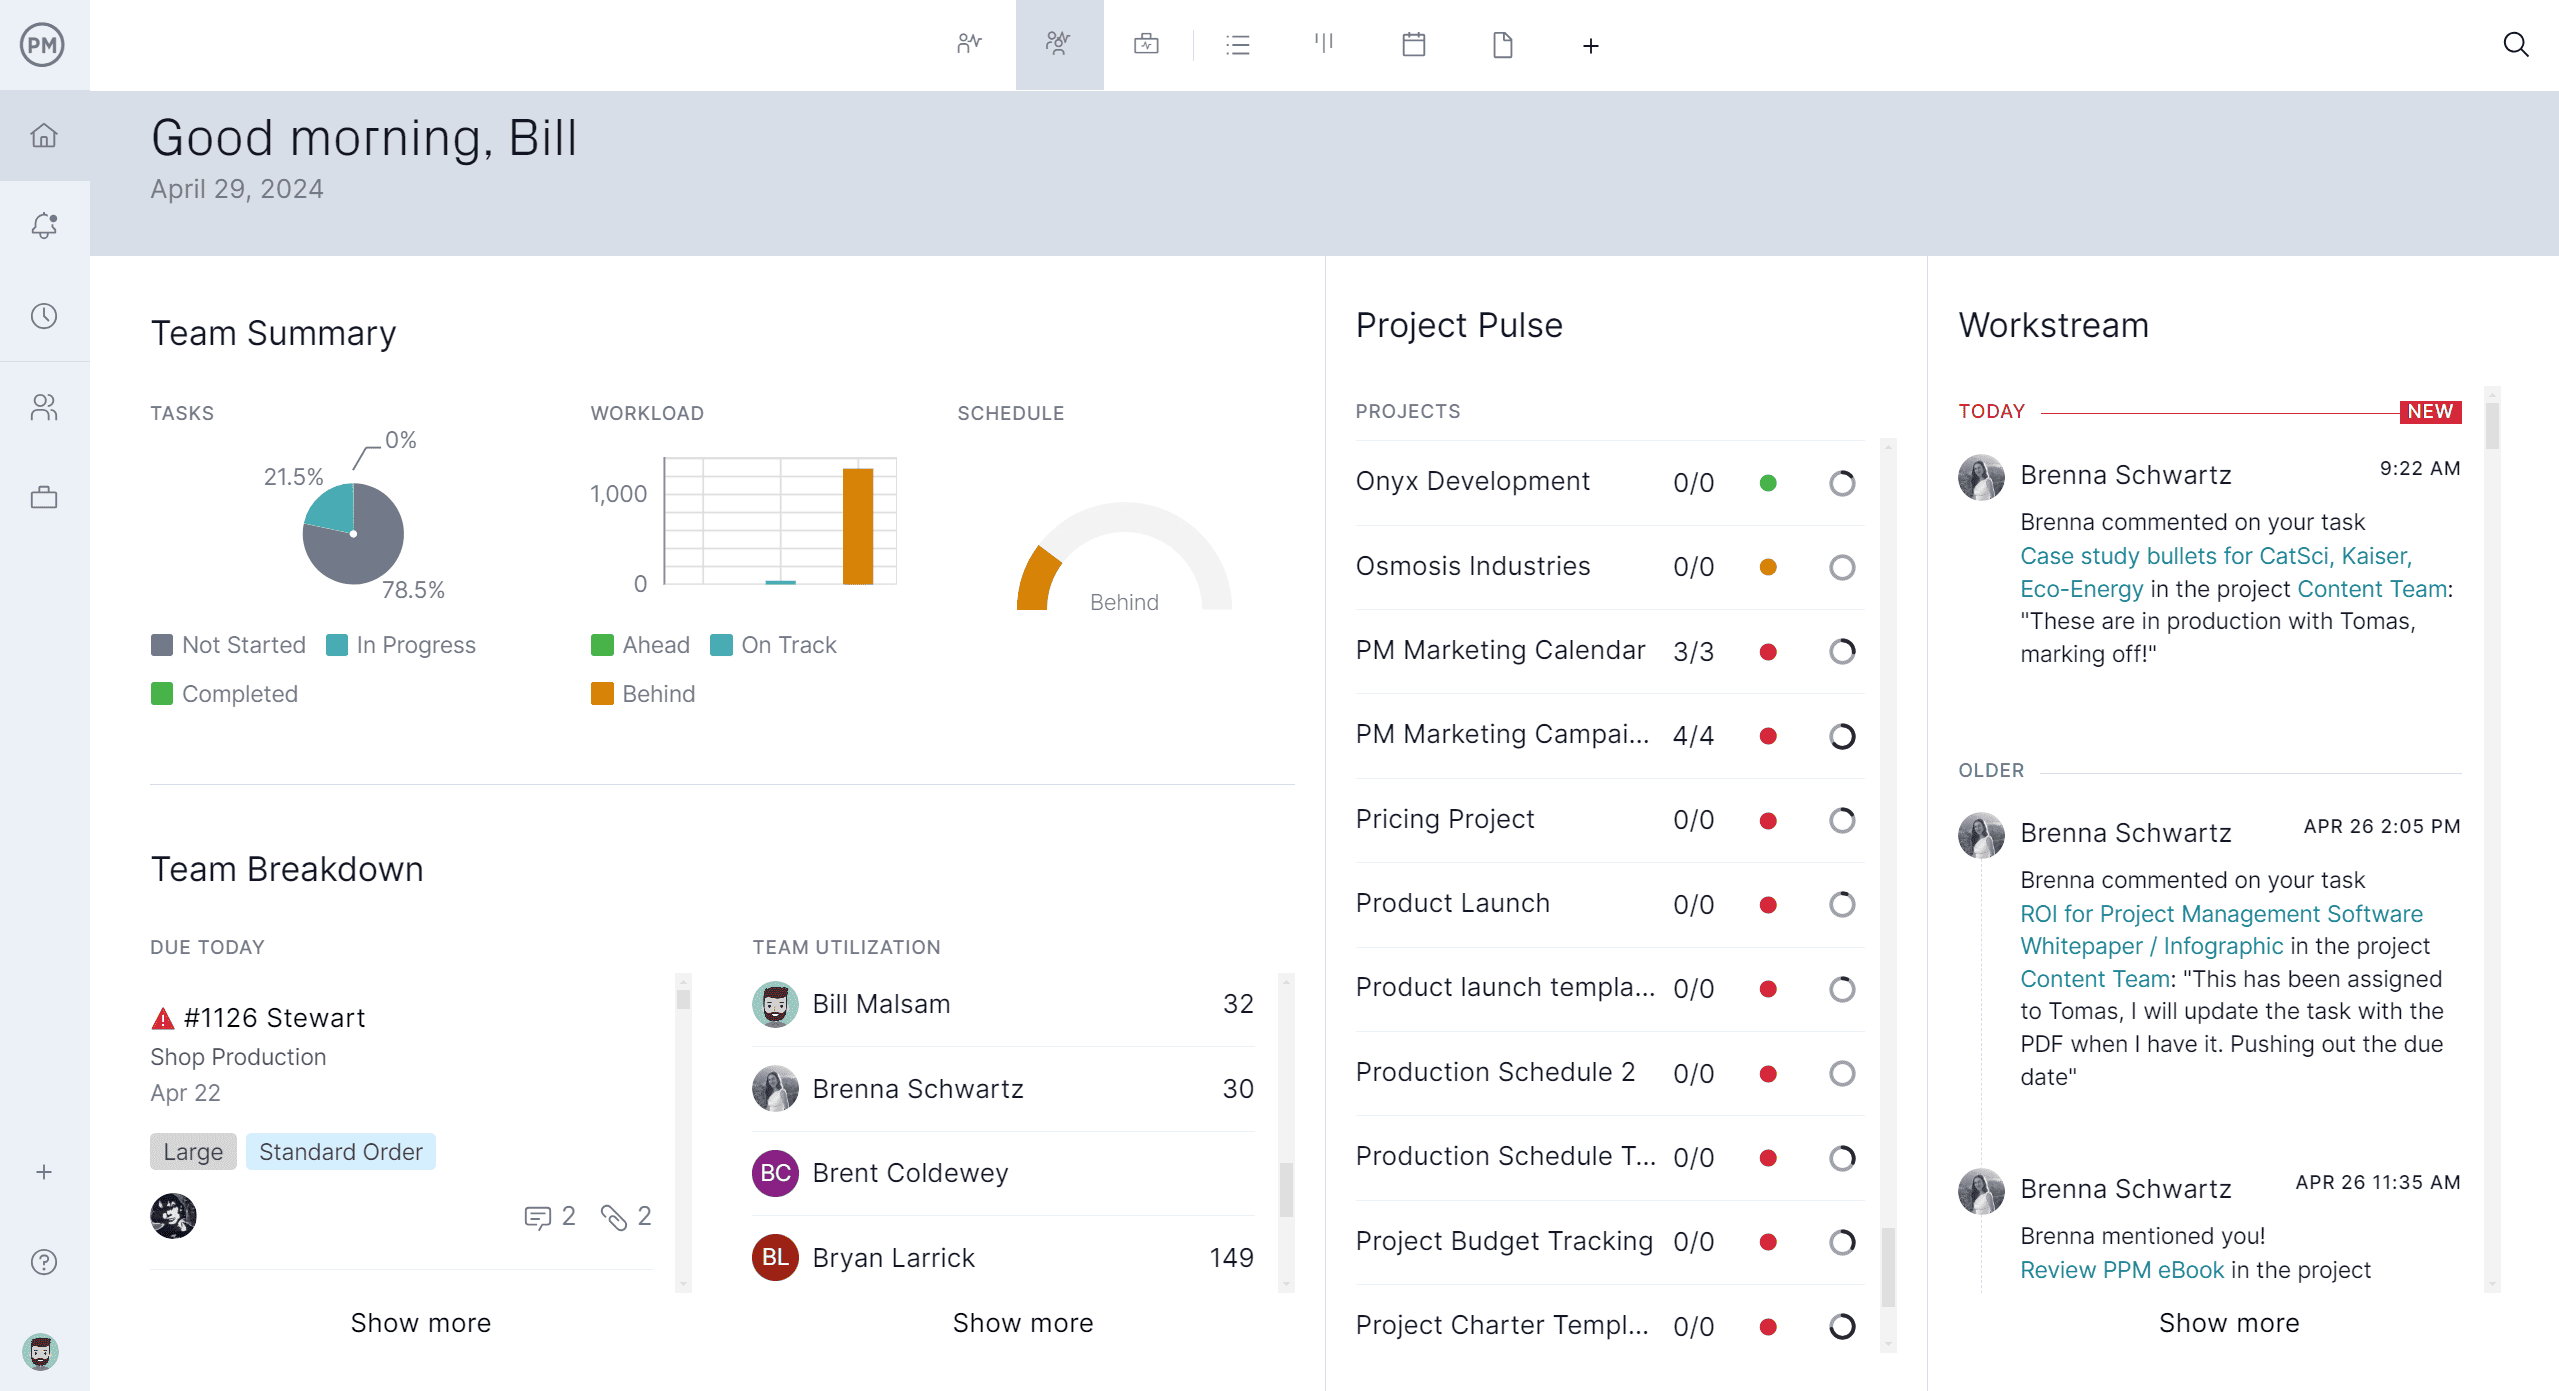
Project management software is essential for capacity utilization because it provides real-time visibility into how resources are being used across production processes. Without it, managers struggle to track labor, equipment and materials efficiently, leading to underutilized capacity or overworked resources. By centralizing data and workflows, project management tools allow teams to monitor output against potential capacity, identify bottlenecks and make informed decisions to optimize efficiency. This level of oversight helps businesses maintain balanced workloads, reduce wasted resources and ensure that production schedules align with demand.
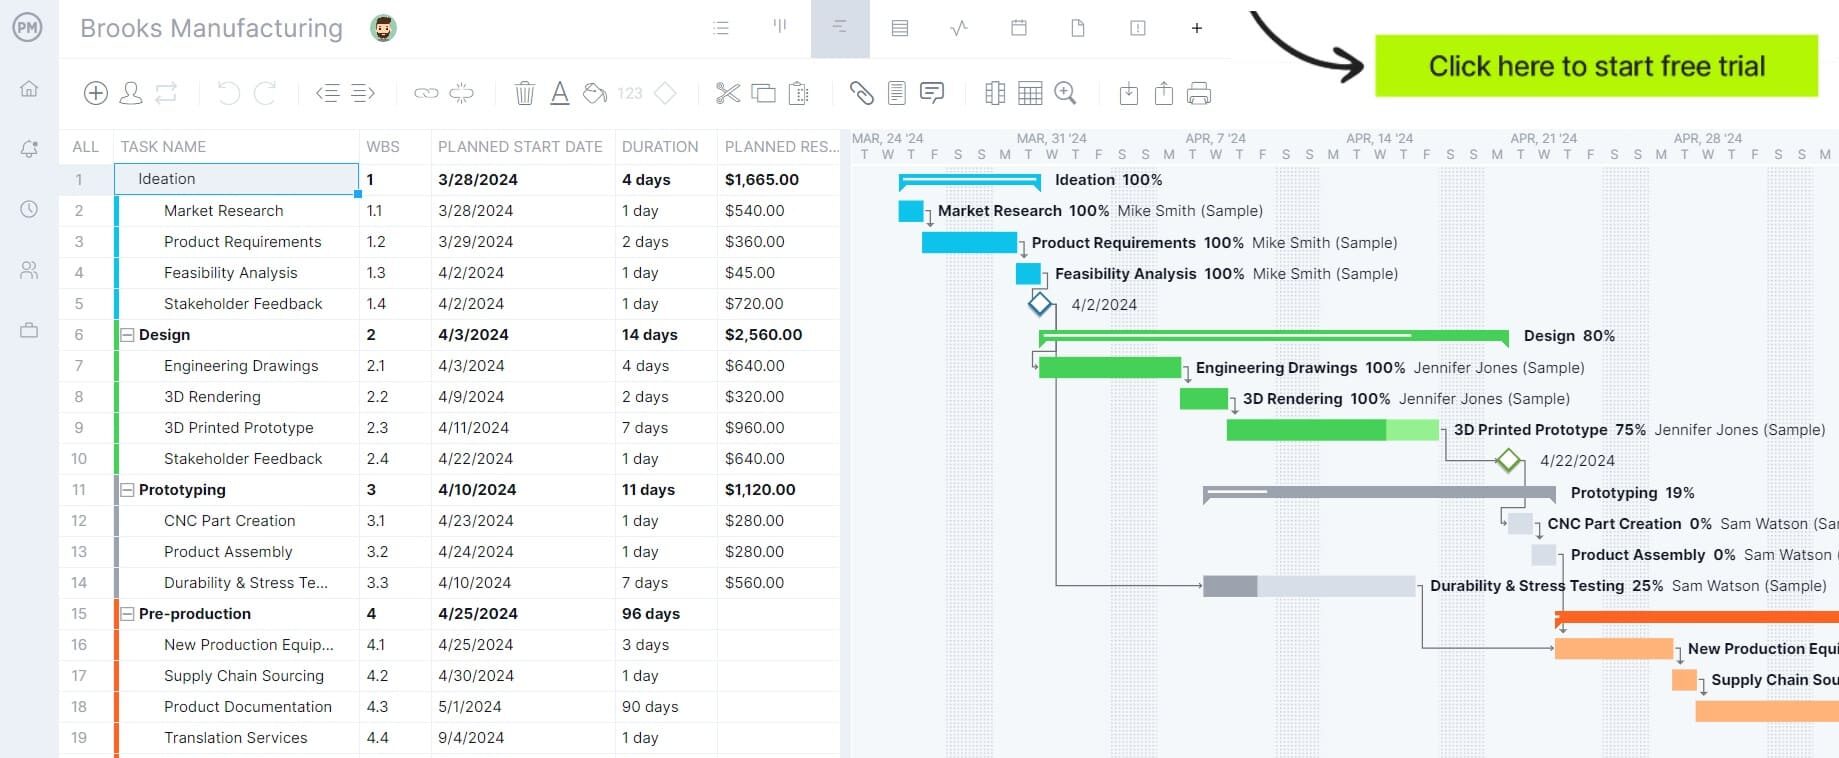
ProjectManager specifically supports capacity utilization with a suite of features designed for manufacturing operations. Its multiple work views, including task lists, kanban boards, calendars and Gantt charts, let teams organize and monitor workloads in real time. Resource management tools provide visibility into team availability, equipment use and material allocation, while cost tracking dashboards monitor labor and material expenses.
Real-time dashboards and customizable reports allow managers to assess production performance, identify inefficiencies and adjust schedules quickly, making ProjectManager an ideal tool for maximizing capacity utilization in complex operations. Get started with ProjectManager today for free.
What Is the Capacity Utilization Formula?
The capacity utilization formula provides a simple yet powerful way to calculate efficiency. It is expressed as:
Capacity Utilization (%) = (Actual Output ÷ Maximum Potential Output) × 100
This formula can be applied to any production process, whether manufacturing a physical product, producing energy, or delivering services. By comparing actual output to the maximum output possible under ideal conditions, companies can quantify how much of their production potential is being realized. The formula also forms the basis for assessing production performance over time and benchmarking against industry standards.
Using the capacity utilization formula consistently enables managers to track trends and identify patterns in production efficiency. For instance, seasonal fluctuations, equipment downtime or staffing issues can be detected by comparing utilization rates month over month. Integrating this calculation into regular performance reviews ensures that decisions about resource allocation, maintenance schedules and workforce planning are grounded in data.
Get your free
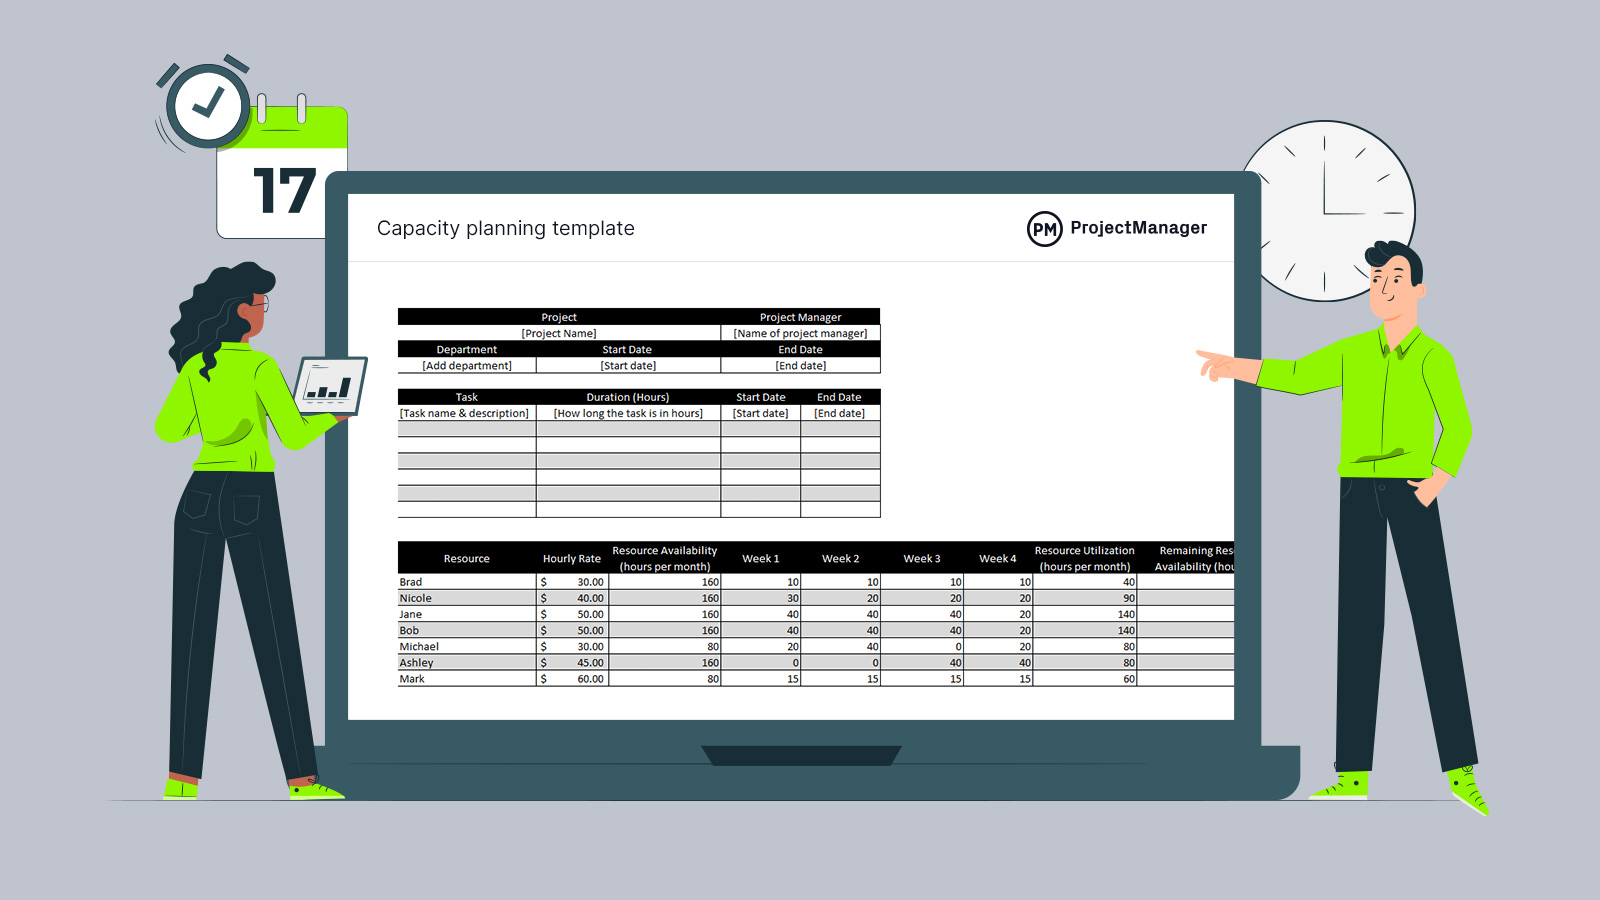
Capacity Planning Template
Use this free Capacity Planning Template to manage your projects better.
Get the Template
What Is the Capacity Utilization Rate?
The capacity utilization rate is the percentage value derived from the formula. It expresses how much of the total available production capacity is being used at a given time. A high capacity utilization rate suggests efficient operations, while a low rate indicates that resources are underused. It’s a vital indicator for production managers, as it provides insight into operational efficiency, cost management and potential for increased output.
Understanding the capacity utilization rate also helps organizations balance efficiency with flexibility. Operating at 100% capacity constantly may seem ideal, but it can increase the risk of equipment failure, worker fatigue and decreased product quality. By monitoring the capacity utilization rate, managers can strike the right balance between maximizing output and maintaining sustainable operations.
Why Is It Important to Monitor Capacity Utilization?
Monitoring capacity utilization is critical for several reasons. It highlights inefficiencies, helps forecast production needs and informs strategic decisions. For example, underutilized equipment or labor may indicate that production processes need streamlining or that demand is lower than expected. Conversely, high utilization may signal the need for additional resources, overtime scheduling or investment in new machinery to prevent bottlenecks.
Additionally, tracking capacity utilization allows businesses to optimize operational costs. Idle resources represent sunk costs, while overworked resources can lead to increased maintenance expenses and higher defect rates. By analyzing utilization data, managers can make informed choices about staffing, production scheduling and capital investments. Monitoring capacity utilization is also a key metric for investors, lenders and stakeholders assessing operational efficiency and profitability.
Related: 12 Best Production Scheduling Software for Manufacturing Projects
How to Calculate Capacity Utilization
Follow the step-by-step instructions below to learn how to calculate capacity utilization in a manufacturing project.
1. Measure Current Actual Output
The first step is to determine the actual output produced during a specific period. This includes counting the number of units manufactured, hours of services delivered or any measurable output relevant to your operation. Accurate measurement is critical, as errors here directly affect the capacity utilization calculation.
2. Estimate the Maximum Potential Output
Next, calculate the maximum potential output your production system could achieve under ideal conditions. Consider equipment capabilities, labor hours and operational constraints. The maximum potential output represents the highest possible production level without compromising quality or safety standards.

3. Use the Capacity Utilization Formula
Apply the capacity utilization formula: (Actual Output ÷ Maximum Potential Output) × 100. This gives the percentage of capacity being used. It’s a standard metric for assessing efficiency and planning resource allocation.
4. Assess the Capacity Utilization Rate
Finally, evaluate the capacity utilization rate to understand operational efficiency. Compare it to industry benchmarks and historical performance to identify trends. Low rates may indicate underused resources, while rates above 90% may suggest the need for expansion or process improvements to avoid overloading equipment or labor.
Capacity Planning Template
Download this free capacity planning template to help your organization visualize production capabilities, track resource use and forecast future needs. The template allows teams to identify underutilized machinery or staff, plan shifts, schedule maintenance and align production with demand. Consistently using such a tool enhances operational efficiency and ensures that resources are fully leveraged without causing burnout or bottlenecks.
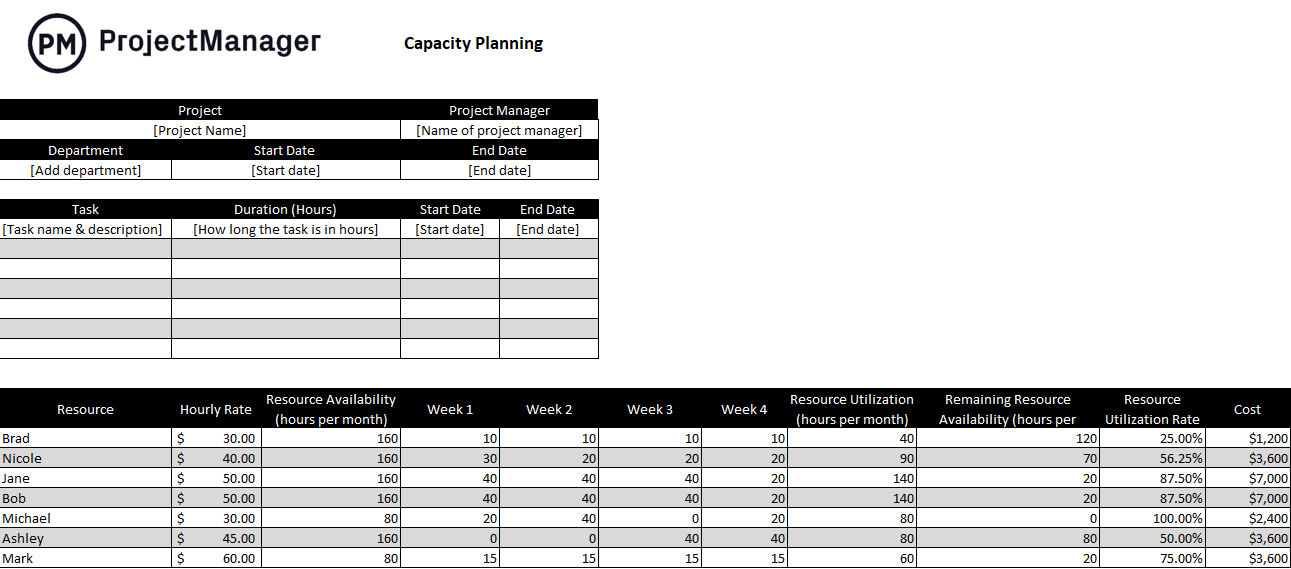
As seen above, our free capacity planning template has fields to name the project, project manager, department and start and end dates. There’s a task list, with a duration for each and, again, the start and end dates for each task. Below that the resources are listed, their rates identified as well as the hours they can work per month. Then there are columns to map out those work days in hourly durations over the course of the month. There’s even a utilization rate percentage and total cost column.
Capacity Utilization Example
Consider a factory that can produce 12,000 units per month at full capacity. If it produces 9,000 units in a given month, the capacity utilization rate is calculated as:
Capacity Utilization = (9,000 ÷ 12,000) × 100 = 75%
This example shows that the factory is operating at 75% of its production potential. Management can use this insight to adjust schedules, invest in new equipment or explore strategies to increase sales and production efficiency.
How ProjectManager Helps Monitor Resource Utilization In Manufacturing Projects
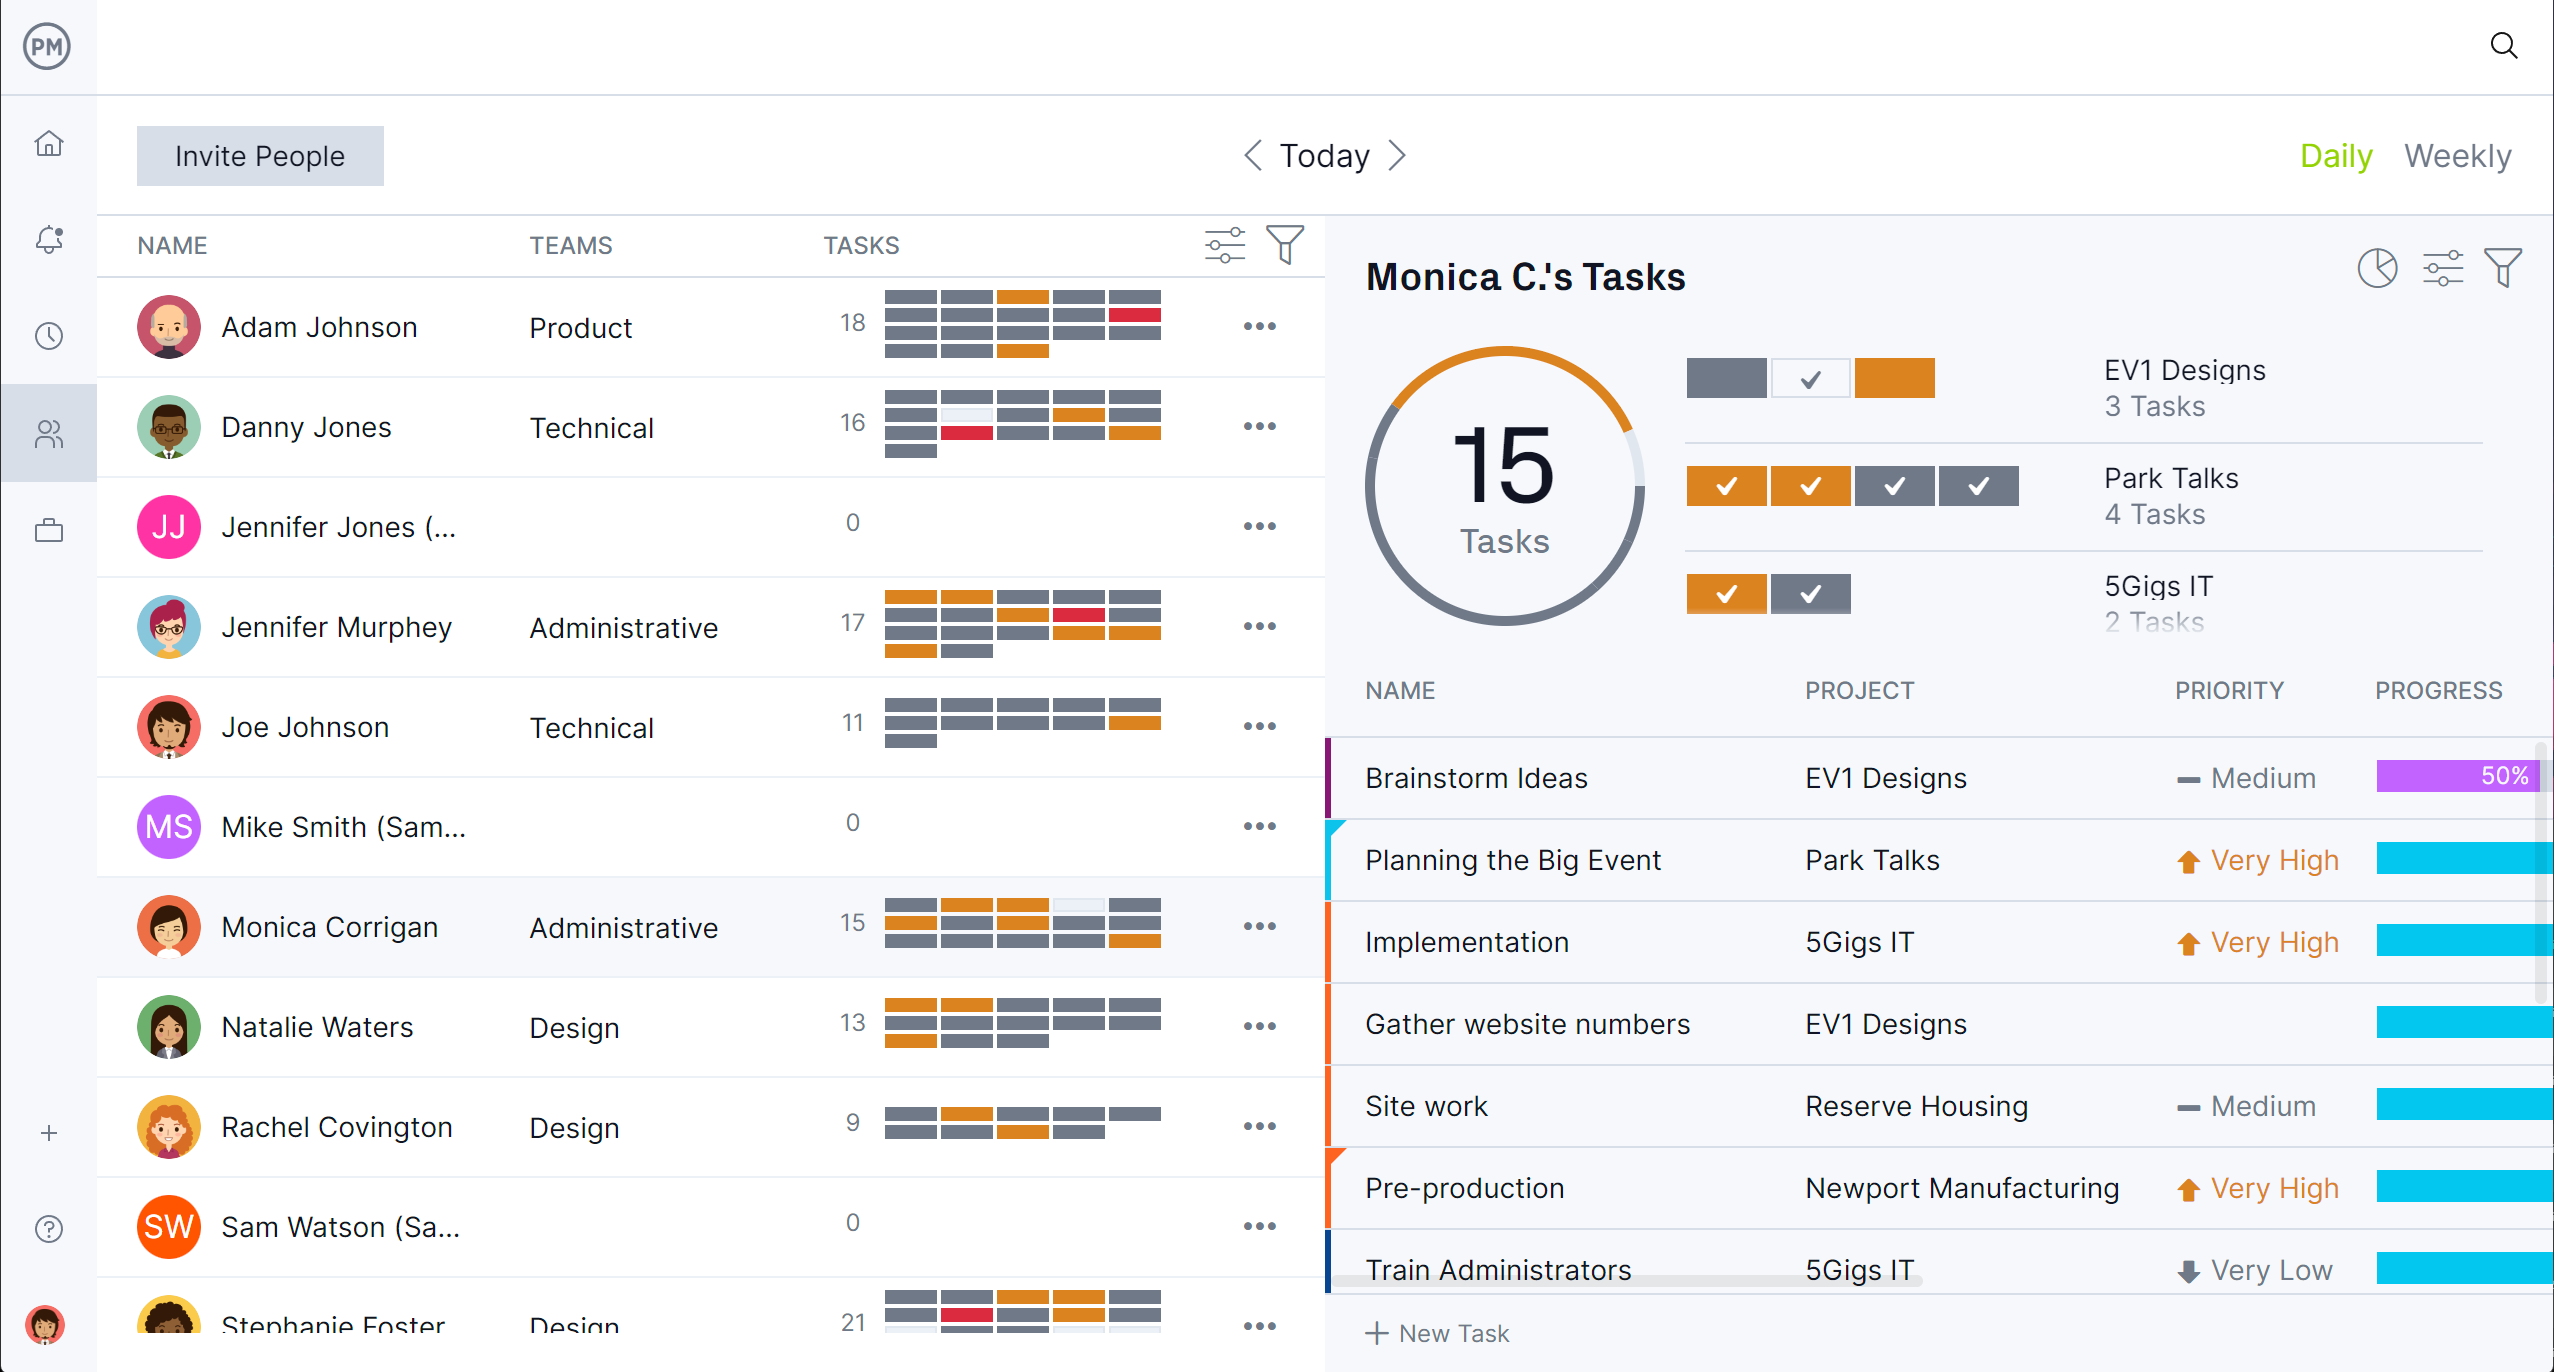
ProjectManager provides multiple work management views, including task lists, kanban boards, calendars and Gantt charts, to track workloads, schedules and production progress across the entire manufacturing process. These views update in real time, so every team member and manager has immediate visibility into any changes, completed tasks or delays.
By seeing exactly who is working on what and when, teams can better coordinate assignments, avoid overlaps or conflicts and reduce miscommunication. This transparency ensures production operations remain on track and resources are allocated where they are most needed. Additionally, managers can filter tasks by team, department or production line to pinpoint bottlenecks or underutilized capacity quickly.
Watch this short video to learn more about our resource management tools.

Robust Resource Planning and Cost Tracking
ProjectManager’s resource management tools allow managers to plan and allocate staff, equipment and materials efficiently, preventing overwork or idle resources. Workload charts visualize how labor and machinery are distributed across projects, making it easier to balance responsibilities and avoid bottlenecks. The software also integrates cost tracking, enabling managers to monitor labor hours, material usage and overall project expenses in real time.
Budget dashboards highlight variances between planned and actual costs, allowing managers to take corrective action promptly. By combining resource allocation with cost insights, ProjectManager ensures that production operations remain profitable while maintaining optimal capacity utilization.
Real-time Dashboards and Reports
Dashboards in ProjectManager provide an at-a-glance overview of production health, resource usage and project progress. Customizable charts and graphs let managers track key metrics, such as task completion rates, machine utilization and labor efficiency, all in one place. Detailed, real-time reports can be generated to analyze trends, highlight recurring issues or identify areas where adjustments are needed.
These insights support informed decision-making, enabling managers to redistribute resources, adjust schedules or refine workflows to maximize output. By leveraging both dashboards and reports, ProjectManager empowers manufacturing teams to continuously monitor and optimize resource utilization while maintaining high-quality production standards.
Related Content
For those interested in learning more about capacity planning, management and more, check out the links below. They go to recent articles that explore important aspects of managing manufacturing projects.
- Capacity Planning: Strategies, Benefits and Best Practices
- Capacity Management in Business Operations
- Workload Management: Planning Workload Distribution
- Workload Analysis: Steps, Examples & Tools
- Workload Analysis Template
ProjectManager is online project and portfolio management software that connects teams, whether they’re in the office or out in the field. They can share files, comment at the task level and stay up to date with email and in-app notifications. Join teams at Avis, Nestle and Siemens who are using our software to deliver successful projects. Get started with ProjectManager today for free.
