The ability to measure progress is how project managers keep projects on track. Waterfall methodology rests heavily on Gantt charts. But if you’re working in an agile environment, the Gantt chart isn’t the right tool for your iterative approach to project management. What you need is a burn up chart.
Not familiar with a burn up chart? Let’s define it, explain when it’s used and explore how to make one. Even if you know the term, there’s probably unfamiliar parts to it. We’ll walk you through who uses a burn up chart and how it differs from a burndown chart while throwing in some free templates.
What Is a Burn Up Chart?
A burn up chart is a tool used in agile project management to measure progress. It’s a visual tool that makes it easy for project managers and their teams to see how much work has been done and how much work is left. It’s used for tracking work in a project schedule or during a sprint in a scrum.
To show progress over time, the chart is divided into two lines; one tracks the work planned or total work and the other tracks the work that’s been completed by that point in the project. These two data points allow project managers to determine how efficiently their team is working by comparing the work they’ve done to the total amount of work planned. This also allows them to estimate the time left in the sprint or project.
That’s a simple but effective way to measure progress and estimate how much time is left in the sprint or project. But a burn up chart needs to be manually updated and never reflects what’s actually happening in the project at the current time. For that, you need online project management software.
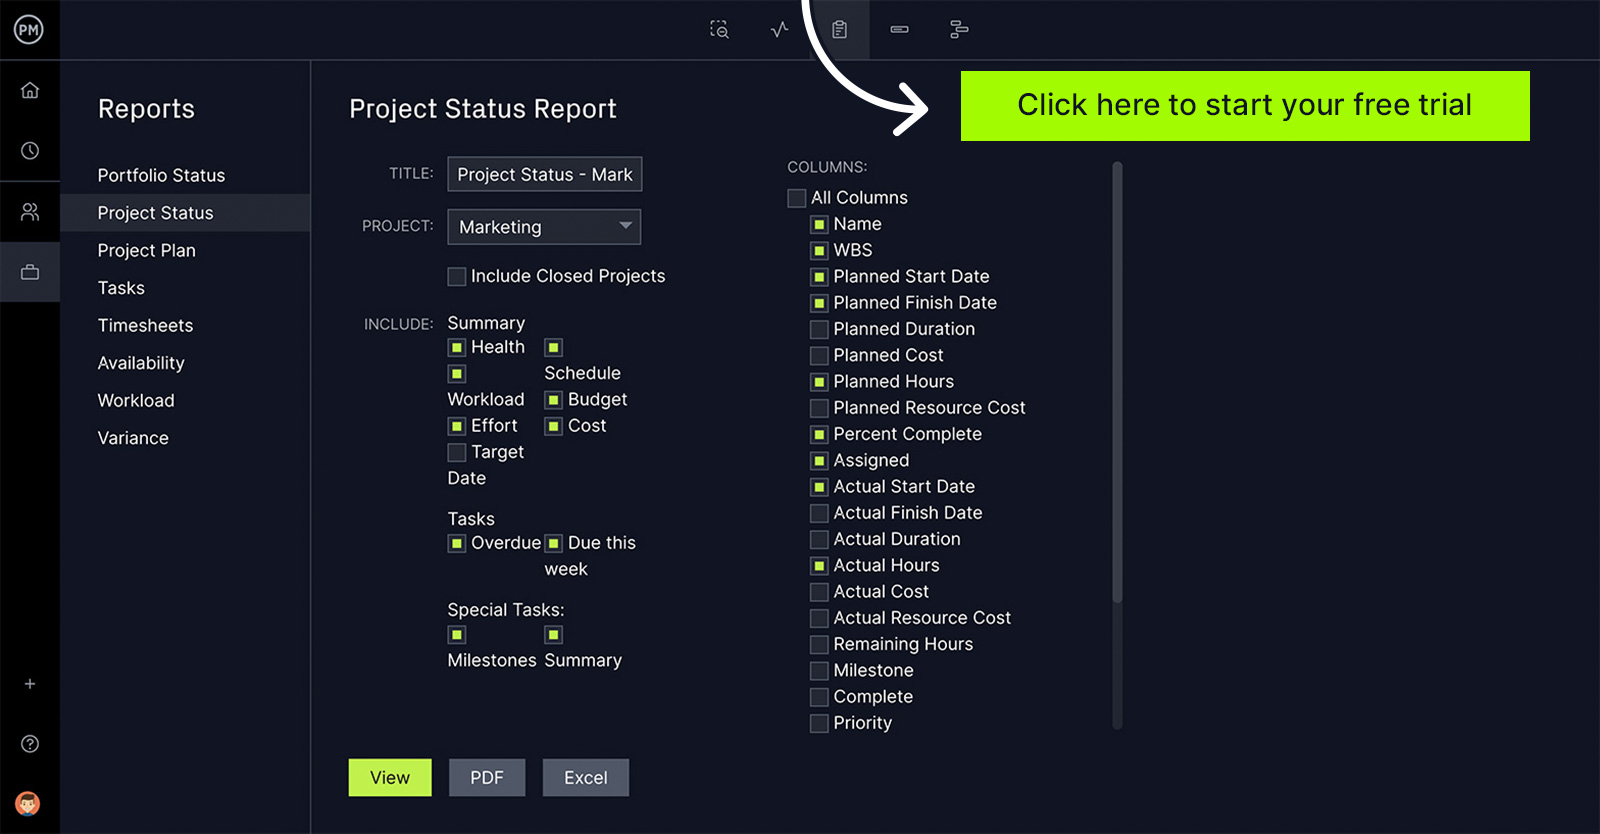
ProjectManager is online project management software that can generate customizable reports that show real-time data to help you see your progress and make more insightful decisions. You can create reports on project status, tasks, workload, variance and more. All reports can be filtered to show just the data you want to see and shared with stakeholders to keep them updated. Get started with ProjectManager today for free.
When Should You Use a Burn Up Chart?
Scrum teams working in an agile environment use a burn up chart to help them measure progress. As stated, burn up charts are popular tools in agile project management where project managers can quickly see if they’ll be able to complete their work on schedule.
Software development and product development teams use a burn out chart as these fields tend to work in a more iterative, agile fashion. They use the burn up chart to see problems in the project and then determine solutions to solve them. Of course, it’s also helpful to estimate when the project will be completed, as noted above.
But it’s also a tool to help software developers and product developers improve their communication and create transparency in the project. The scrum team can make better decisions on the delivery scope by having a chart that has up-to-date data that is communicated.
Get your free
Agile Sprint Plan Template
Use this free Agile Sprint Plan Template to manage your projects better.
Get the Template
Example of a Burn Up Chart
Since a burn up chart is a visual tool, it helps to understand it by seeing an example of one. The following is a simple burn up chart that shows a sprint’s completed work and compares that to the total scope of the project.
The burn up chart is measured by the vertical line that charts the number of tasks, hours or story points, which measure the effort required to implement a user story (a product requirement from the point of view of the user). There’s also a horizontal line that represents time, usually measured in days.
How to Make a Burn Up Chart
You know what it is, what it does and when to use it, but all that is moot until you know how to make a burn up chart. Whether you’re in software development, product development or prefer working in an agile environment, being able to create a burn up chart helps you stay on schedule if you follow these five steps.
1. Define the Scope
Knowing the scope of your project means being able to list the necessary tasks to deliver it. These tasks are your product backlog. The product backlog is managed and prioritized by the product owner during the product as the scrum team prepares for its sprints. By defining the project’s scope, you can help avoid scope creep, which is when unnecessary features are added to the release.
2. Estimate the Duration
Now that you’ve listed the tasks, the product team or scrum team will look at the work ahead and forecast how many sprints or iterations it’ll take to complete everything in the product backlog. Each sprint should be roughly the same duration. That tends to be no more than 2-4 weeks long. Once you’ve estimated the total amount of sprints or iterations, then you have the length of the project.
3. Divide the Workload
You have the tasks and the duration of the project, now you need to figure out how much effort and time you’ll need to complete the tasks. Scrum teams will estimate the story point for each task to figure out the workload. This is then translated into working hours, which can then be divided between the scrum team.
4. Make the Burn Up Chart
You have the information you need to build your burn up chart. This can be done in a spreadsheet, such as Excel. Two columns will be for time and work units. The horizontal axis is time and the vertical axis is work units. As you work on the project and fill in the burn up chart, you’ll be able to see how fast the scrum team is working.
5. Review and Revise
You’re not done yet. You want to continue to update the burn up chart. Projects change and your burn up chart should reflect those evolutions or it’s not going to be accurate. Ideally, you’ll update the burn up chart as part of your daily routine as a product owner or project manager.
When you’re done, it should look like the burn up chart example that we shared above. You’ll probably want to make the line for time a different color than the one for the work unit.
Who Should Use a Burn Up Chart?
Many people in agile project management use a burn up chart. Almost anyone on the scrum team is going to use it to see if their actual effort aligns with the planned effort. If it’s not, they need to catch up to keep the project on schedule, meaning the development team should have a close eye on the burn up chart.
A scrum master is there to advise the scrum team in an agile project that might use the burn up chart to monitor how efficiently the team is working from one sprint to the next. If there are ways that the scrum master can help to boost their efficiency, they will. That should then be reflected on the burn up chart when it’s looked at later in the project.
There’s also a product owner on the scrum team, who is usually the key stakeholder in the project. They have an understanding of the users, marketplace, competitors and trends that the product will impact or will impact the product. They have a vested interest in the project and will want to chart its progress using a burn up chart.
What Is the Difference Between a Burn Up Chart and a Burndown Chart?
You might be thinking, if there’s a burn up chart then there must be a burn down chart. Correct, there is. They’re both used in agile project management by project managers to track and communicate the progress of their projects. As we’ve defined, a burn up chart shows how much work has been completed and defines the total amount of work left in the project.
So what’s a burndown chart? It shows how much work is remaining to be done in the project. These charts work together to give you a big overview of the project and both are important when managing agile projects, but there are advantages to using the burn up chart.
Many who work in an agile environment prefer to use a burn up chart over a burndown chart because the latter requires accurate project planning. If you’ve made an underestimation, the burndown chart will put your team behind schedule while overestimating will put you ahead of schedule. Not only that, the burndown chart isn’t tracking your product backlog. Still, both are needed when working within an agile methodology.
Free Project Management Templates
ProjectManager is flexible software that can work in an agile environment or a more traditional one. It can also be used to bridge the two if your organization has teams that work agile and others that manage their projects with waterfall. Even if you don’t use our software, we have free project management templates that can help you with your sprint, agile projects and budget.
Agile Sprint Plan Template
A burn up chart is used when planning a sprint in agile project management. Our free agile sprint plan template helps you get the work done by defining the deliverables and determining how you’ll get the work done.
Roadmap Template
A roadmap gives you an overview of the whole project. It’s a high-level view that helps you make strategic decisions and communicate the broad strokes of the project to the team and stakeholders. Use our free roadmap template for Excel to help you capture the project phases and milestones.
Project Budget Template
However you schedule your project, you’re going to have to figure out what it costs to deliver. With our free project budget template for Excel, you can more accurately forecast those costs. You can estimate everything from labor costs to raw materials, both direct and indirect costs.
How ProjectManager Helps You Manage Agile Projects
A burn up chart is no different from a project management template for Excel. It’s a great tool for major issues, but it must be manually inputted and can’t be shared without multiple, different copies floating around. Project management software solves those problems. ProjectManager is online software with agile tools that help you plan your sprints and track them in real time.
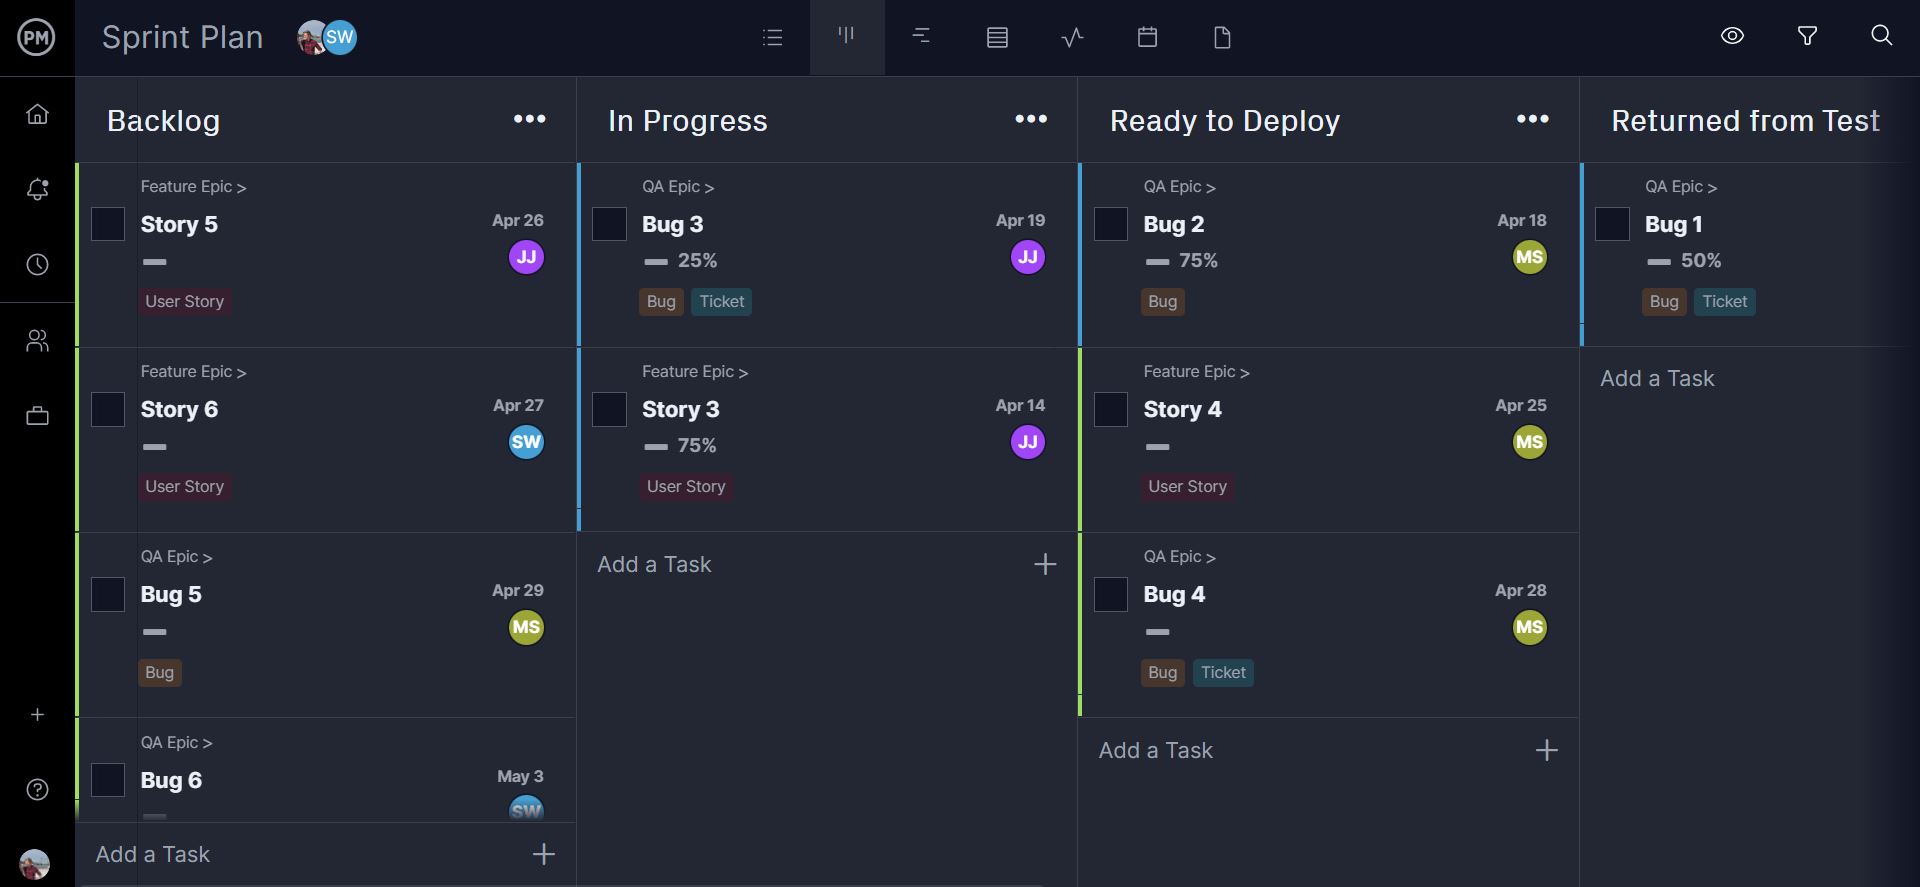
Plan Sprints on Kanban Boards
Our software understands that different teams need different tools. Other departments working in more traditional methodologies will use Gantt charts or roadmaps to plan and track progress in real time. Developers like task lists. But agile teams are going to prefer the visual workflow of kanban boards. They can manage their backlog and collaborate when planning sprints. Product owners get transparency into their process so they can reallocate resources as needed to avoid roadblocks.

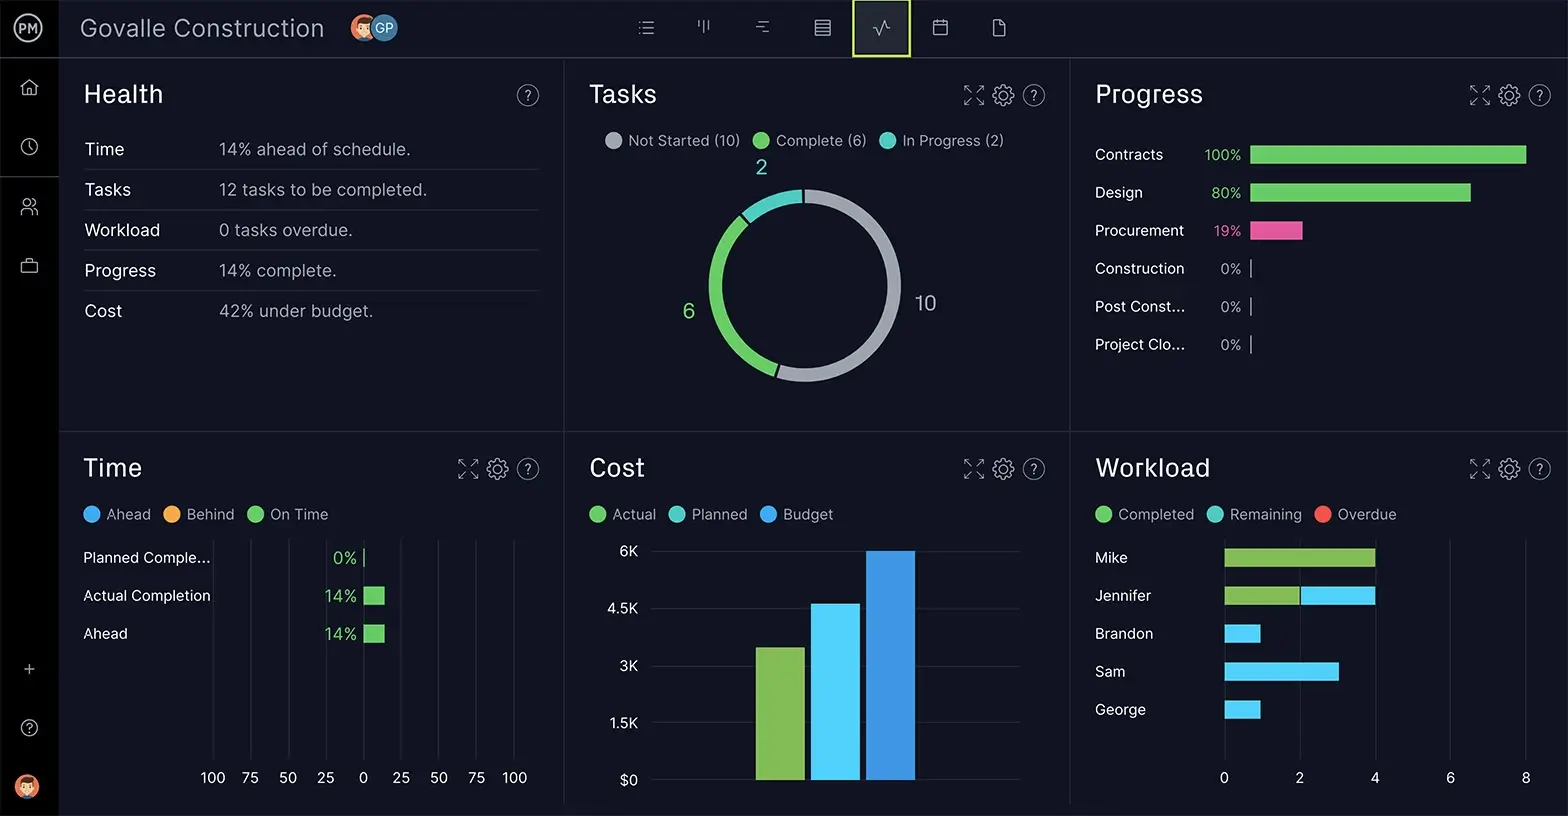
Track Progress on Real-Time Dashboards
Burn up charts can’t give you real-time data. After you manually update one, it’s already out of date. You can use reports to dig down into the details, but if you want a high-level view of the project’s health, our live dashboard is perfect. It captures and displays real-time data on progress, workload, time, cost and more, all in easy-to-read graphs and charts. You’re looking at the project as it actually is, not as it was. Unlike lightweight software, there’s no time-consuming configuration required. It’s plug-and-play.
There are other features to our software that can further assist in running agile projects. We can customize and automate workflows to keep agile teams focused on more important work. Task approval settings ensure that simple tasks are delivered within quality expectations. Then you can use risk management, task management and resource management tools to stay productive. You need more than a burn up chart to deliver, you need agile project management software.
Related Agile Content
A burn up chart is only one small aspect of working in an agile environment. There are a lot of other agile principles to explore if you’re interested. Our website is a library of project management information, from weekly blogs to guides and, of course, templates. Here is some of the agile content for you to peruse.
- Agile Project Management Software
- What Is Agile Project Planning? An Introduction for Beginners
- Sprint Planning 101: How to Plan Great Sprints
- 5 Tips for Better Agile Release Planning
- Backlog Refinement: A Quick Guide With Examples
- Sprint Retrospective: Agenda, Examples & Best Practices
ProjectManager is award-winning software that empowers agile teams to better plan, manage and track their sprints in real time. Our collaborative software connects everyone on the project, whether they’re working side-by-side on at a different timezone. Join teams from Avis, Nestle and Siemens who use our software to deliver success. Get started with ProjectManager today for free.
