Sales performance is influenced by many factors, including customer demand, product mix, sales team productivity and regional market conditions. Keeping all of that information organized can be challenging without a centralized reporting system. This sales dashboard template for Excel brings together revenue data, sales KPIs and visual reports that help managers and executives evaluate performance, compare results against targets and identify trends that require attention.
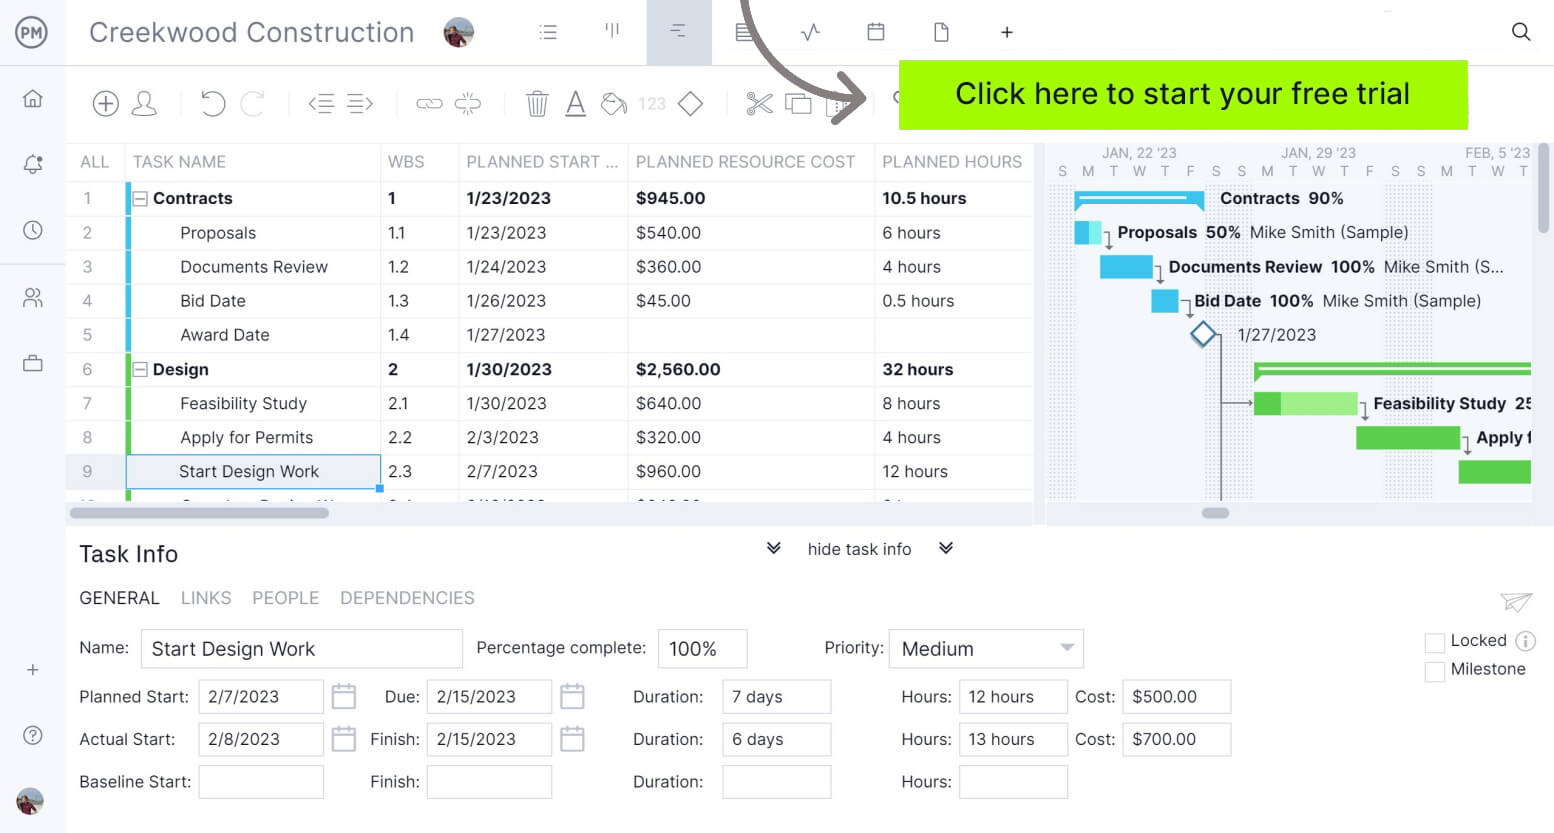
If you’re looking for a software that allows you and your team to plan, schedule and track projects from start to finish, try ProjectManager. ProjectManager is award-winning project management software that gives businesses across industries the tools they need to ensure projects are completed on time, within budget and within scope. It allows project managers to make detailed project schedules, estimate costs, allocate resources, set budgets, track progress and compare planned versus actual project outcomes using real-time dashboards and reports to identify delays or cost overruns quickly. Get started with ProjectManager for free today.
Why You Need a Sales Dashboard Template
Strong sales results depend on having visibility into the metrics that drive revenue growth. This free sales dashboard template for Excel consolidates key sales data into a single reporting view, allowing businesses to monitor revenue, units sold, new customers, total orders and average sales value.
The dashboard also analyzes performance by product, region, salesperson, customer and sales channel while comparing actual results against monthly targets. Since it is built in Excel, all tables, charts and KPIs can be customized to reflect the reporting requirements of virtually any organization.
When To Use a Sales Dashboard Template
A sales dashboard template can be introduced at any point in a company’s lifecycle, from a startup creating its first reporting process to an established business seeking deeper sales analysis. It becomes especially valuable during periods of growth, market expansion, product launches or sales team restructuring. To accurately track trends, evaluate performance against targets and support business decisions, the dashboard should be updated and reviewed on a monthly basis.
Who Should Use this Free Sales Dashboard Template?
Multiple stakeholders rely on sales information to make operational and strategic decisions. Because this sales dashboard template includes executive KPIs, trend analysis and detailed sales breakdowns, it can support the needs of leadership teams, sales managers, analysts and other professionals throughout an organization.
- Sales Manager: Uses the dashboard to monitor salesperson performance, compare revenue against targets, evaluate monthly sales trends and identify opportunities to improve team productivity and close rates.
- Sales Director: Reviews regional performance, customer acquisition metrics, product sales data and revenue growth trends to guide forecasting, territory planning and strategic sales initiatives.
- Chief Executive Officer (CEO): Relies on high-level KPIs such as revenue, new customers, total orders and sales growth to assess business performance and support strategic decision-making.
- Business Analyst: Examines dashboard data to identify sales patterns, compare actual results to targets, evaluate product performance and provide recommendations based on measurable outcomes.
- Revenue Operations Manager: Analyzes performance across sales channels, customer segments, products and regions to improve reporting accuracy, forecasting processes and revenue generation strategies.
How to Use ProjectManager’s Sales Dashboard Template for Excel
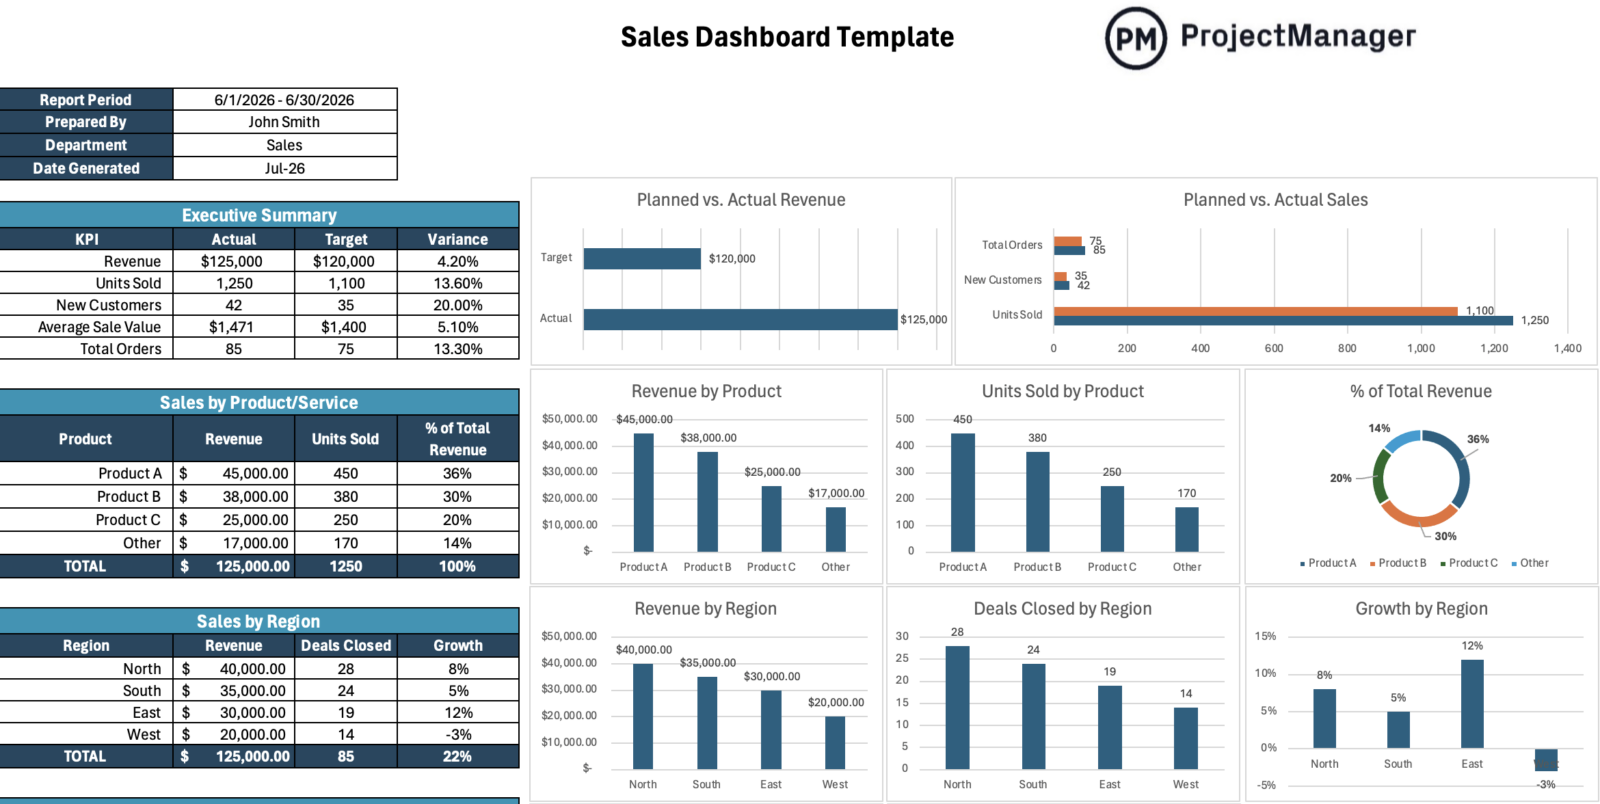
Start by entering the report period, preparer name, department and date generated at the top of the template. Then update each sales table with monthly data so the connected charts can show actual performance, target comparisons, revenue breakdowns and sales trends across the business.
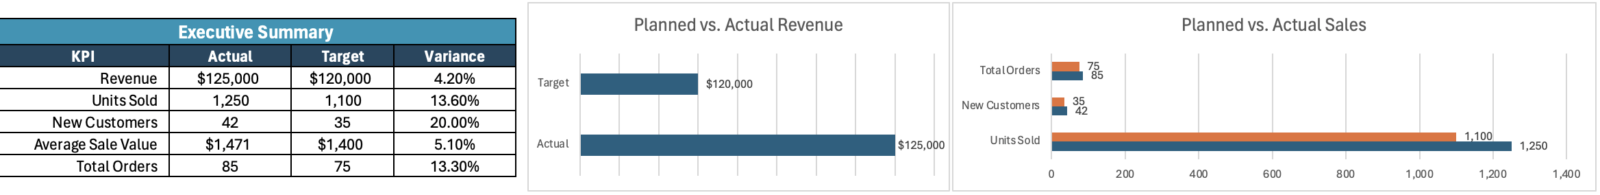
Executive Summary
Begin with the executive summary to review the month’s core sales KPIs, including revenue, units sold, new customers, average sale value and total orders. Compare actual results against targets and use the variance column to spot performance gaps quickly.
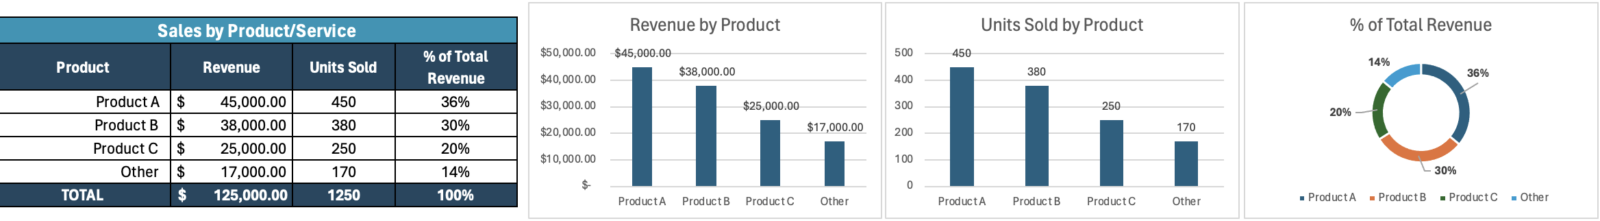
Sales by Product or Service
Next, complete the sales by product or service table with revenue, units sold and percentage of total revenue. Use this section to identify which offerings drive the most sales and which products may need pricing, promotion or positioning adjustments.
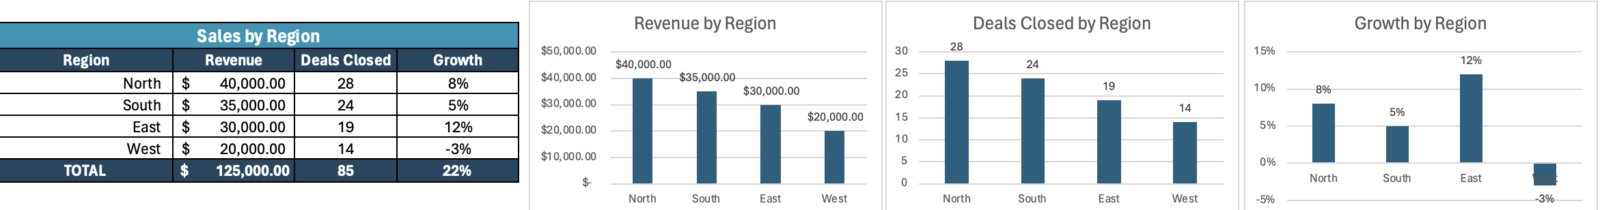
Sales by Region
Then update the sales by region section with revenue, deals closed and growth percentage for each territory. Review the charts to compare regional performance, find strong markets and flag locations where sales activity or growth is falling behind.
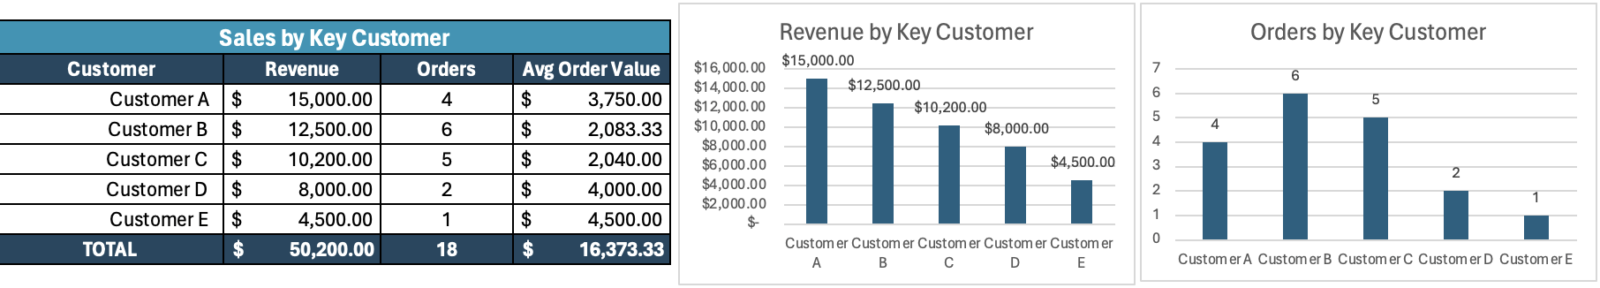
Sales by Key Customer
After reviewing overall performance, populate the sales by key customer table with revenue, orders and average order value for your most important accounts. Use this section to identify top revenue contributors, monitor purchasing behavior and evaluate customer concentration risk.
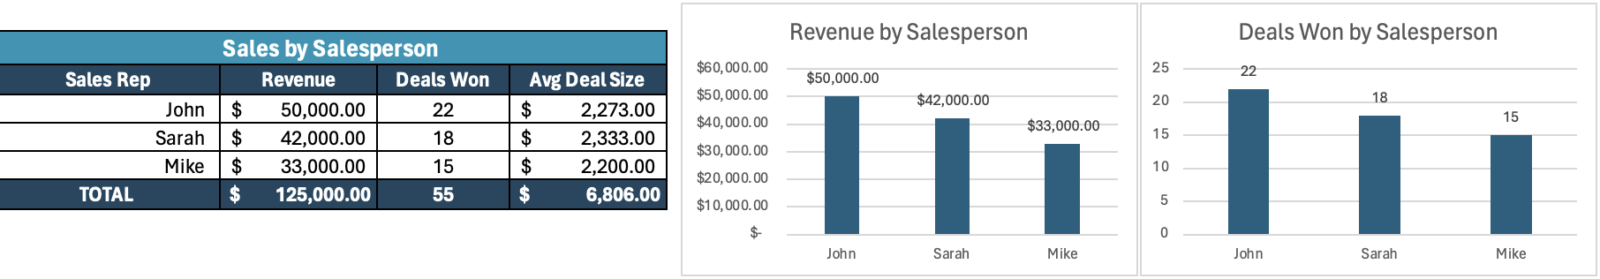
Sales by Salesperson
Once customer data has been entered, record each salesperson’s revenue, deals won and average deal size. The accompanying charts make it easy to compare individual performance, recognize top performers and identify coaching opportunities for underperforming team members.
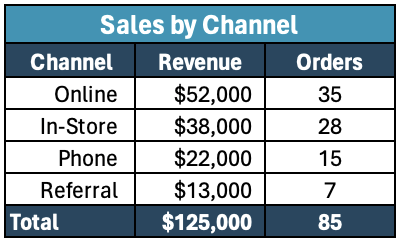
Sales by Channel
Next, enter revenue and order totals for each sales channel, including online, in-store, phone and referral sales. Reviewing channel performance helps determine where customers are buying, which channels generate the most revenue and where future investments should be focused.
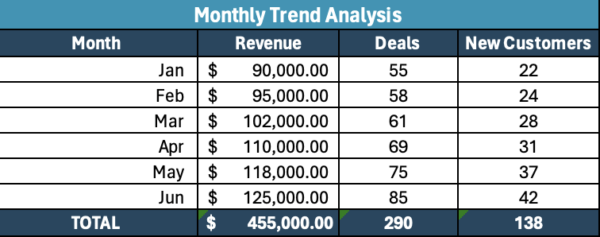
Monthly Sales Trend Analysis
Finish by updating the monthly trend analysis table with revenue, deals and new customer data for each reporting period. This section highlights long-term performance patterns, making it easier to measure growth, evaluate sales momentum and support future forecasting efforts.
What Other Project Management Templates Can Keep My Project on Budget?
ProjectManager offers more than 100 free templates for Excel, Word and Google Sheets that help businesses plan, track and control costs across projects, departments and operations. From sales forecasting and marketing reporting to budgeting and resource planning, these templates provide practical tools for better financial oversight.
Sales Forecast Template
This sales forecast template helps businesses estimate future revenue based on expected sales volume, pricing, market segments and sales channels. It also captures assumptions, risks and opportunities, providing a structured framework for planning growth and supporting more accurate budgeting decisions.
Marketing Report Template
This marketing report template helps teams evaluate campaign performance by documenting goals, target audiences, competitors, budgets and marketing activities. By organizing key performance data in one place, it supports analysis, reporting and continuous improvement across future marketing initiatives.
ProjectManager Is a Robust Project Management Software
ProjectManager is an online project management software that provides a robust feature set of project planning, scheduling and tracking tools, including Gantt charts, kanban boards, task lists and real-time dashboards and reports. With these tools, teams across industries can build detailed schedules, assign resources and monitor progress, costs and timelines.
ProjectManager also delivers AI-powered project insights to support better decision-making and connects with over 100 tools like Microsoft Project, Acumatica and Jira. With its open API and wide range of integrations, organizations can seamlessly link ProjectManager to their existing systems.
Watch the video below to learn more!
If you need a tool to help you manage projects, then sign up for our software now at ProjectManager. Our online software helps teams across industries plan, track and oversee projects as they unfold. Sign up for a free 30-day trial today!