The Gantt chart has been around for a century, but it wasn’t until it was digitized in the 1980s that it became a tool that project leaders flocked to. Now, with online gantt charts a core feature of many project and collaboration tools, most of us have some familiarity with these bar charts. No surprise in that. Gantt charts are a highly visible way of showing planned and actual progress on your many tasks across a horizontal time scale. Indeed, as the technology advanced, so does the appreciation of the usefulness of Gantt charts.
If you’ve never used a Gantt chart (or have given it a wide berth as you’ve heard rumors that they can be hard to use) it might be time to give them a second look. In fact, we recently wrote a definitive guide to Gantt charts, if you want to take a deeper dive. But really, it’s now more simple than ever to get the benefits of a Gantt chart, such as:
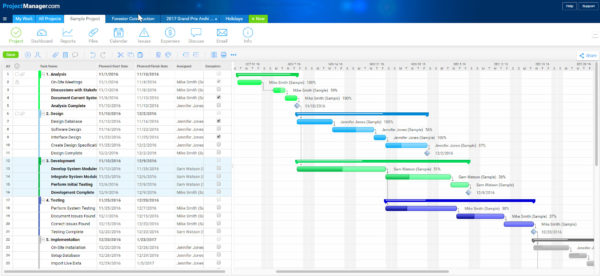
- Visual timelines of tasks or projects. By seeing your project tasks on a horizontal timeline it’s easier to get an overall picture of the project’s progression. This is especially true if you’re managing a program with a bunch of related projects, which can be hard to keep track in your head.
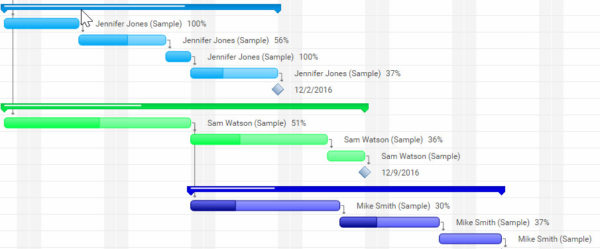
- Color-coding tasks by person, team or function. To further help give you an at-a-glance view of the project, you can assign specific colors to indicate a team member or any other aspect of the task, so you know quickly and easily where the project is at that moment.
- Tracking dependent tasks easily. Task dependencies are potential roadblocks on the road to a successful project, an online Gantt chart allows you to track these special tasks and make sure that they’re being done in a timely manner that doesn’t block a team member.
- Seeing planned vs. actual progress on a project. The best way to track the progress of your project is with the online Gantt chart, as it can put the actual time it took to complete a task and compare it to the time you scheduled for it to take. This is due to updates being recorded in real-time.
- Viewing project baselines and critical paths. The critical path is a sequence of project activities to determine the shortest time to complete the project, and an online Gantt chart spreads out all the information you need to figure that out. While the baseline can refer to the schedule, cost and scope of a project. Obviously, much of this information can be gleaned from an online Gantt chart to help with making your project more productive.
- Defining core project milestones. The milestone is a way to mark the end of a phase of the project. On a Gantt chart, the milestone is symbolized by a diamond-shaped icon. You can easily add these with a simply click and further define your project schedule on the Gantt chart.
And when you use online Gantt chart software you can get these additional features:
- Cloud project & task management
- Task-level collaboration & file sharing
- Drag-and-drop scheduling
- Automated task dependency scheduling
- Email alerts when tasks are updated
- Integrated reporting
An Online Gantt Chart = Less Hassle
If you’re already familiar with Gantt charts because you use them on in Excel or MS Project or other software platforms, then you might think, what more do I need? Well, it depends on what you’re getting! There are major differences in quality and features sets with the Gantt chart tools. And certainly, if you’re using Excel to create Gantt charts, you can save a lot of time, but moving your scheduling online.
For starters, when you’re using a program like MS Project, you have to install the software to your desktop or server, and usually are required to set up Sharepoint servers in order to share or collaborate with your team. And, of course, Excel can be shared, but there’s the problem of data lost when a colleague overwrites on a shared file.
When you’re working online you can share, print, and work together on the same project in the cloud, concurrently. The Gantt chart becomes a living schedule where as your team members are working on their tasks, they can add files, comments, notes and other task updates and all the data is extended throughout the program. All the data is up-to-date, and the interactivity and collaboration reduces the time lost searching for documents in email or having to save and share files manually.
Related: The Best Gantt Chart Software of 2020
There are many reasons to use online project management software, aside from just getting interactive Gantt charts, from resource management, task management, reporting and workflow management, to name a few. But it’s even more effective if your online PM tool includes an interactive Gantt chart.
Task-level File Sharing
Your online Gantt chart provides a great way to keep project and task files together. Look for a program where you can add files at the task level, a great tool for tracking task documentation, or even for maintaining vital project data like invoices or images or bills of lading or code documentation.
You probably have a lot of different file programs and you already use, whether Dropbox or some other file storage system. But when you can track documentation at the task-level, you save time for your team, so they don’t need to search in a file repo to find that doc a team member referenced that’s essential for the completion of a task.
In short, Gantt charts aren’t just for the project manager to use for planning. They can be a source of project collaboration, and when you integrate file sharing, you begin to streamline your workflow.
Link Dependencies
One task is often dependent on another, and it’s important you’re aware of these dependencies to avoid either blocking a team member or disrupting your schedule. With your online Gantt chart you can create those dependencies and link tasks within and even across all the projects in your portfolio.
There are four types of task dependencies you have to manage — start-to-start, finish-to-finish, finish-to-start and start-to-finish — and all of them are set in the functionality of the online Gantt chart software to make scheduling a breeze. Once you’ve linked the tasks, when it’s updated all the upstream tasks deadlines are also updated automatically, saving you time and effort to focus on other work.
Another benefit of a Gantt chart online when you’re linking task dependencies is that you can automate notifications. That way you’ll get an alert when the status has been updated. You can now track if it’s progressing as per your schedule or if it’s falling behind and allocated the necessary resources to address the issue before it becomes a problem.
Interactive is Just… Easier
The biggest problem with desktop Gantt chart tools or Excel charts or even the old fashioned Lego Gantt is the difficulty and time required in putting the darn things together, only to be limited in your ability to share them. Sure, the project manager may have assembled their Gantt in all manner of creative ways, but what’s the point of spending precious hours of your work day on a schedule that no one else can access?
Online Gantt charts are interactive and automated. They populate at a click of your cursor as you add tasks. You can move a start or end time by merely dropping and dragging a bar chart to the new date. Scheduling tasks or reassigning those tasks makes task management less of a headache.
By using the Gantt chart as an interactive collaboration tool, you’re able view real-time task progress from your team, see the overall progress of your project and easily drill down to see task-level comments about why a task isn’t on track.
Your team, in turn, get email alerts when tasks change, see when team members have commented on their tasks, and can also share in the overall project progress so they can help keep the project manager on track. It bear repeating: interactive Gantt charts are just… easier.
Using an online Gantt chart is easy and adds value to your project leadership. It’s not hard to figure out and it doesn’t cost an arm and a leg. It’s a long- and short-term solution to project management that offers the greatest return on the least investment on your part.
ProjectManager.com is award-winning Gantt chart and project management software that has all the functionality listed above and more. See for yourself by trying out the software with this free 30-day trial.
