A critical path diagram offers a detailed, visual representation of the sequence of project tasks that directly affect a project’s finish date. By highlighting the longest chain of dependent activities with no scheduling flexibility, this tool helps project managers identify which tasks must be closely monitored to avoid delays. When used correctly, a critical path diagram supports better resource allocation, deadline management and proactive planning. It’s a foundational component of project scheduling that provides clarity on what matters most for on-time delivery.
In this in-depth analysis, we’ll walk through a critical path diagram example to show how tasks are sequenced, durations are calculated and dependencies are mapped. While a critical path method diagram focuses on the logic and timing of tasks, the visual format of the critical path diagram template helps teams understand the structure at a glance. By applying these concepts, you can strengthen your project planning process and stay ahead of potential delays.
What Is a Critical Path Diagram?
A critical path diagram is a visual project management tool used to identify the sequence of dependent tasks that directly determine a project’s total duration. It highlights the longest path of activities from start to finish, known as the critical path, which has zero float—meaning any delay in these tasks will delay the entire project. This diagram helps project managers focus on tasks that require close monitoring to stay on schedule.
A critical path diagram—also referred to as a critical path method diagram—organizes tasks as nodes connected by arrows that show dependencies. Each node includes task duration and scheduling details, making it easier to calculate early and late start and finish times. By analyzing a critical path diagram example, teams can spot scheduling risks early and plan accordingly. Using a critical path diagram template provides consistency in structure, saving time and reducing errors during project planning.
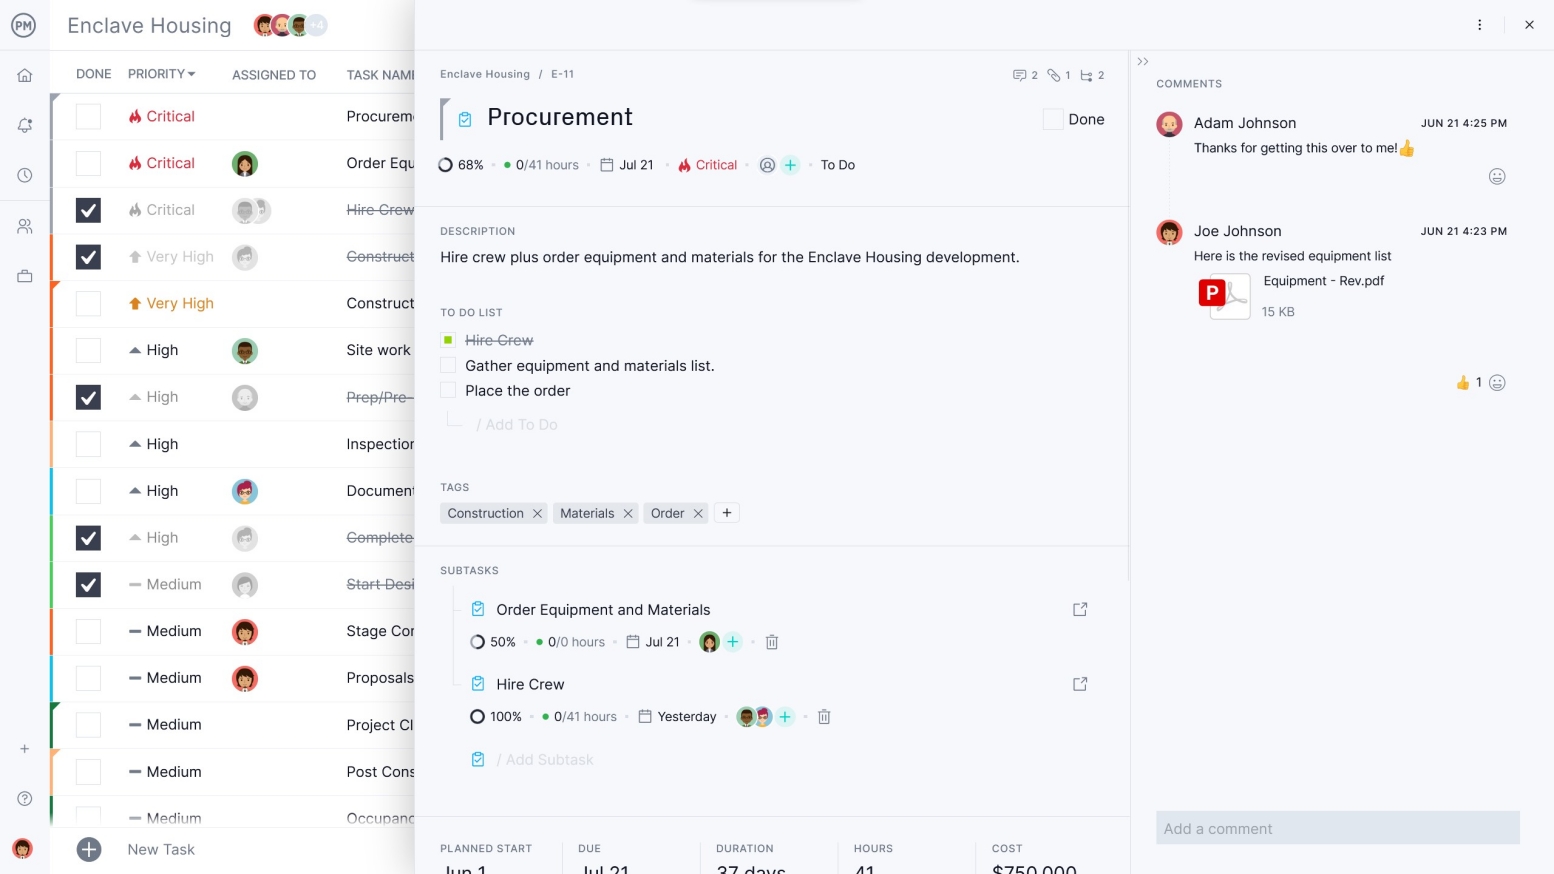
Project management software enhances the value of a critical path diagram by automating calculations and dynamically updating timelines as changes occur. It allows teams to define dependencies, assign resources and track task progress in real time. Unlike manual diagrams, software solutions support collaboration and provide visibility across departments so everyone works from the same up-to-date plan.
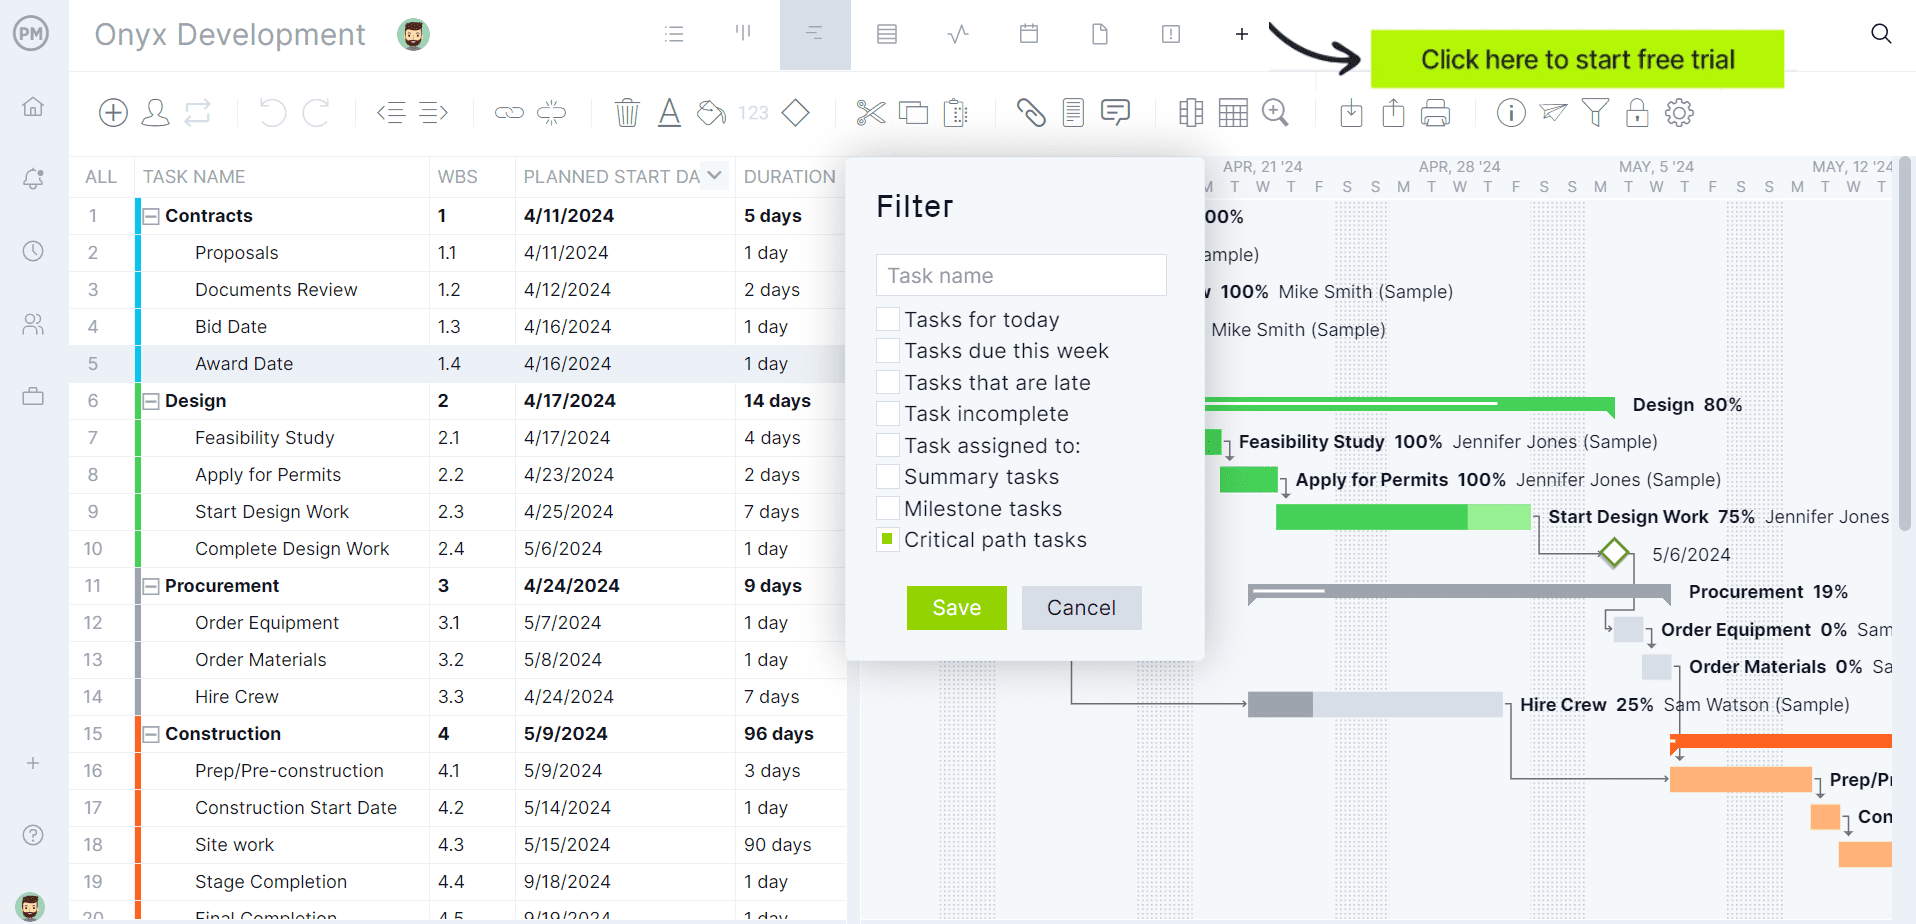
ProjectManager’s Gantt chart is the ideal tool for building and managing a critical path diagram. It not only allows you to link all four types of task dependencies and visually map your critical path network, but it also filters for the critical path and lets you set baselines to track planned versus actual progress in real time. With multiple project views, robust resource management and automated tracking tools, our software transforms a static critical path diagram template into a live, interactive project planning solution. Get started with ProjectManager today for free.
When to Make a Critical Path Diagram
A critical path diagram should be created during the project planning phase—after the work breakdown structure is completed and before scheduling and resource allocation begin. At this point, all tasks are clearly defined and it’s possible to identify dependencies and estimate durations. Building the diagram early allows project managers to determine the critical path, which highlights the sequence of tasks that directly impact the project’s finish date.
You should also make or update a critical path method diagram whenever there are major changes to project scope, timelines or task dependencies. It’s particularly valuable for complex or high-stakes projects where delays in key activities could cause significant setbacks. By creating a critical path diagram at the right time, teams can make better scheduling decisions, focus on priority tasks and reduce the risk of unexpected delays.
Get your free
Critical Path Template
Use this free Critical Path Template to manage your projects better.
Get the Template
Critical Path Diagram Example
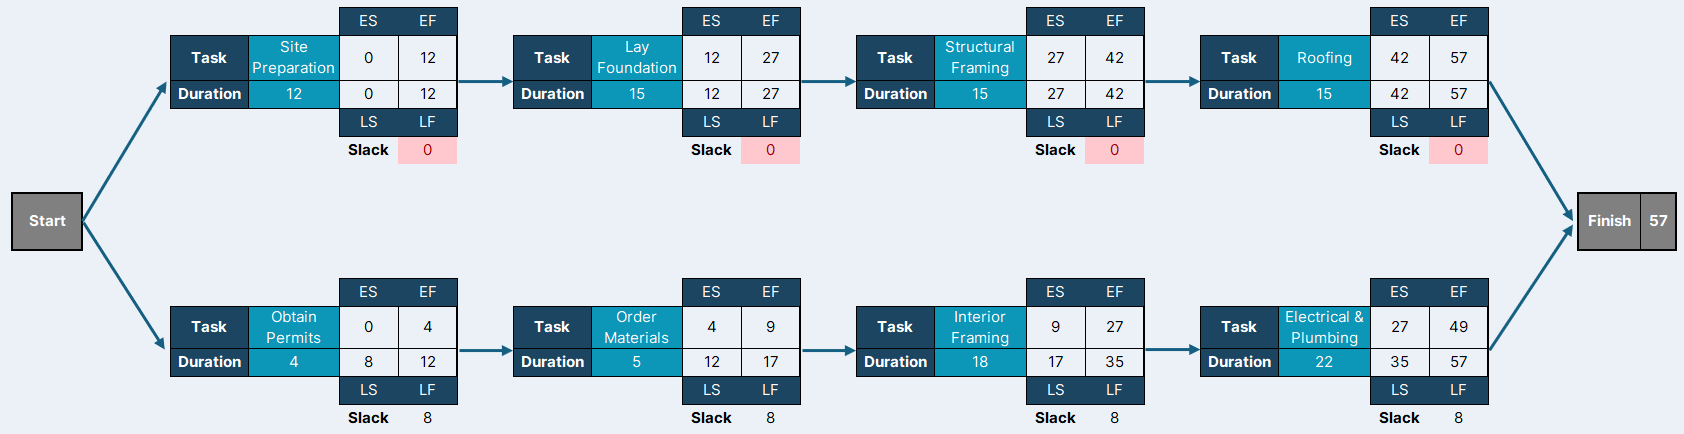
To better understand how a critical path diagram works, let’s look at a real-life scenario. Imagine a construction company is building a house. Like any project, it involves multiple tasks with specific dependencies and durations. Below is the project task list that outlines the sequence of activities.

The project begins with site preparation, which takes 12 days, and obtaining permits, which happens in parallel and takes 4 days. Once the site is ready, the team can lay the foundation, a task that depends on completing site preparation and lasts 15 days. Meanwhile, after the permits are secured, materials are ordered — a finish-to-start relationship — which takes 5 days.
After the foundation is laid, the team moves on to structural framing, a crucial 20-day task. On the parallel track, once materials are ready, interior framing begins and takes 18 days. When the structural framing is complete, the roof can be installed, a 10-day task. Finally, after interior framing is done, the team completes the electrical and plumbing work, which takes 22 days.
This task list represents two parallel sequences of activities—one focusing on the exterior and structural components of the house, the other focusing on the interior systems. By plotting these tasks in a critical path diagram, we can identify which sequence of tasks determines the shortest possible duration of the entire project and which tasks have some flexibility. The critical path diagram for this project should look like this.
What Are the Components of a Critical Path Diagram?
Now, let’s break down this critical path diagram example into each of its components.
Project Task List
A project task list, in the context of a critical path diagram, is a structured table that outlines all the activities needed to complete a project. It includes each task’s name, its dependencies (which tasks must be completed before it starts), and its estimated duration. The task list defines the sequence of activities, showing how tasks are connected and in what order they occur. This information is essential for building the critical path diagram, identifying the project’s critical path, and calculating the earliest and latest start and finish times.
Nodes and Arrows
In a critical path diagram, nodes and arrows are the building blocks of the network. Nodes represent the project’s tasks or milestones, usually shown as circles or boxes. Arrows illustrate the dependencies between tasks, pointing from a predecessor to its successor. Together, nodes and arrows define the sequence, timing, and relationships of all activities.
- Earliest Start (ES): The earliest start is the first possible moment a task can begin, assuming all its preceding tasks are completed as soon as possible. It defines the earliest point in the schedule when a task becomes available to work on, helping planners understand the minimum time frame for the project.
- Earliest Finish (EF): The earliest finish is the soonest a task can be completed, based on its earliest start and expected duration. It shows how quickly each task can be accomplished and helps visualize the shortest possible timeline for completing all tasks.
- Latest Start (LS): The latest start is the latest point in time a task can begin without causing any delays to the overall project deadline. It shows the limit of flexibility for when a task can commence while still keeping the project on track.
- Latest Finish (LF): The latest finish is the last possible moment a task can end without extending the project’s completion date. It defines the deadline for finishing a task to ensure subsequent tasks and the entire project remain on schedule.
- Slack (or Float): Slack, also called float, is the amount of time a task can be delayed without affecting the project’s completion date. It represents the flexibility available in the schedule for non-critical tasks. Tasks with slack can start or finish later than their earliest times without disrupting the overall timeline. Understanding slack helps identify which tasks are critical to stay on schedule and which have some leeway.

Critical Path Diagram Algorithm
The values explained above are obtained from mathematical calculations known as the critical path diagram algorithm, which is made up of two parts or two main steps: the forward pass, which allows for calculating the ES and EF, and the backward pass, which allows project managers to calculate the LS and LF values. Here’s a brief explanation of how to calculate these values.
Forward Pass
Begin the forward pass at the start of the project and move through the tasks toward the finish.
- Look at the tasks that come right after the start node — their earliest start (ES) is zero, because nothing comes before them.
- For each task, figure out when it can start by looking at its predecessors. A task can’t start until all its predecessors are done, so you take the largest EF of its predecessors.
- Then, calculate its earliest finish (EF) by adding its duration: EF = ES + duration.
You keep going this way, step by step through the diagram, until you reach the end. The biggest EF you get at the end tells you how long the project will take at the fastest possible pace.
Backward Pass
Now for the backward pass — this one starts at the end of the project and works backward toward the start.
- Look at the tasks that come just before the finish node — their latest finish (LF) is equal to the project duration (the biggest EF you calculated earlier).
- For each task, figure out the latest it can finish by looking at its successors. A task must finish in time for the next task to start, so you take the smallest LS of its successors.
- Then, calculate its latest start (LS) by subtracting its duration: LS = LF − duration.
You keep going backward through the diagram this way until you get back to the start.
Calculating Slack (or Float)
Once you’ve determined the earliest and latest start and finish times for all tasks, you can calculate the slack, or float, for each task. Slack tells you how much a task can be delayed without delaying the project’s overall completion and reveals the project’s critical path.
To calculate slack for a task, you subtract its earliest start (ES) from its latest start (LS), or its earliest finish (EF) from its latest finish (LF). Both approaches give you the same result.
- Slack = LS − ES
- or Slack = LF − EF
If slack equals zero, the task is critical — meaning it’s on the critical path and cannot be delayed without affecting the project deadline. If slack is greater than zero, the task has flexibility and can be delayed up to the slack time without impacting the project. Understanding slack helps project managers identify which tasks must be prioritized and which have some scheduling leeway, making it a key part of effective project planning.
Critical Path Diagram Template
Download this free critical path diagram template to visually map out task sequences, durations and dependencies to identify the critical path in a project. It includes space for listing activities, connecting them with arrows to show dependencies and calculating early and late start and finish times. Using a template saves time and ensures a consistent layout, making it easier to analyze the project’s timeline and highlight the tasks that must stay on schedule to avoid delays.
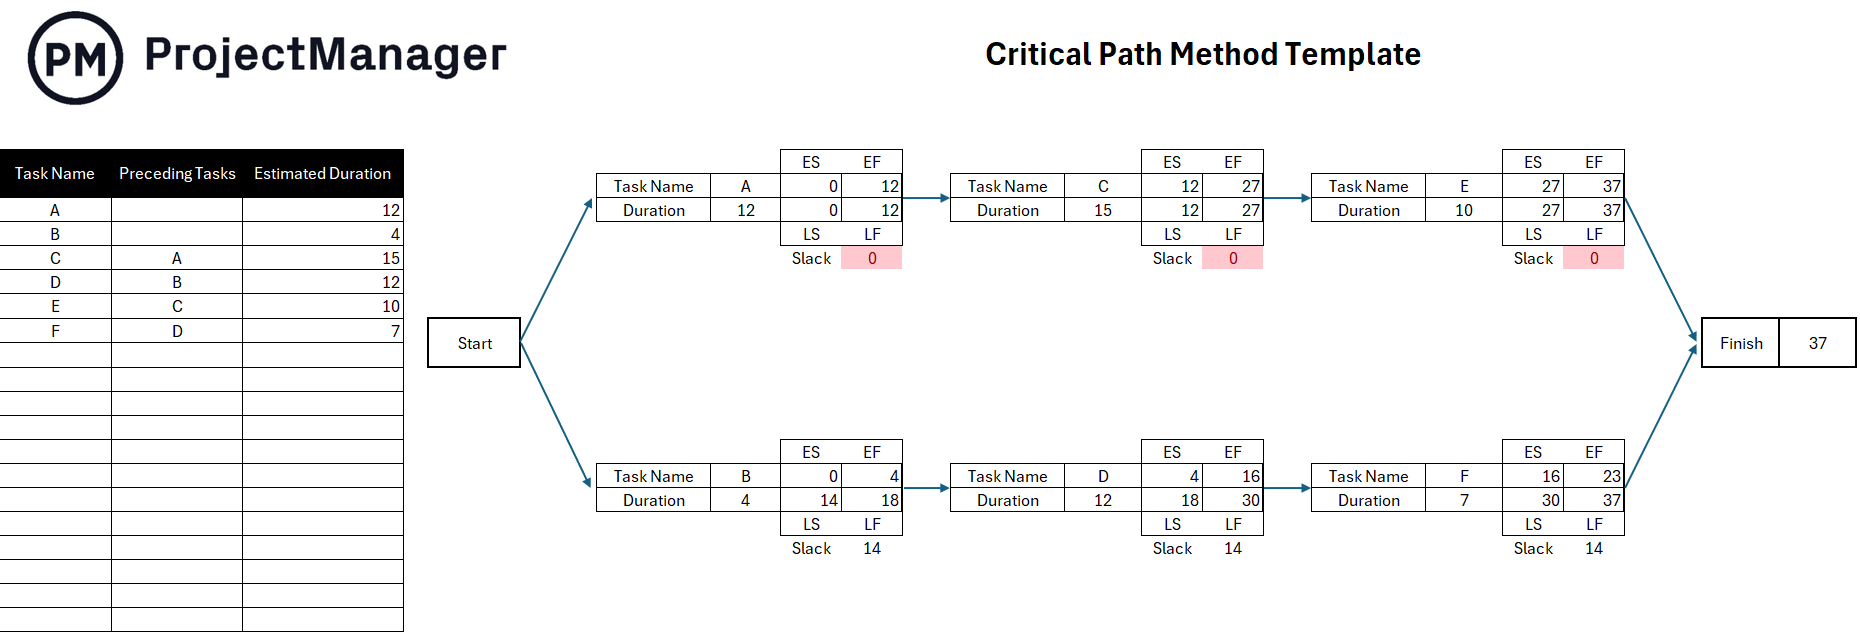
While not as useful as project management software, this template helps with complex projects where tracking multiple interdependent tasks is essential. By using a critical path diagram template, teams can quickly build a clear and accurate critical path method diagram, identify scheduling risks and adjust plans accordingly. It serves as both a planning and communication tool that improves visibility and coordination across teams.
Benefits of a Critical Path Diagram for Project Scheduling
A critical path diagram is a powerful tool for planning and managing projects. It helps you visualize the sequence of tasks, understand dependencies and identify which activities are critical to meeting deadlines. By using a critical path diagram, project managers can make better decisions, optimize resources and keep projects on track.
- Clarifies task sequences and dependencies
- Highlights the project’s critical path
- Identifies tasks with scheduling flexibility
- Helps avoid project delays
- Improves time management
- Optimizes resource allocation
- Enhances communication among stakeholders
- Supports better risk management
- Tracks project progress effectively
- Increases overall project efficiency
Critical Path Diagram Explained by a PMP
Watch Jennifer Bridges, PMP, as she walks you through how to construct a critical path diagram and how it drives your project schedule. She shows how to calculate the earliest and latest start and finish times for tasks. This creates a dynamic timeline that highlights the critical sequence of interdependent activities—letting you instantly spot which tasks will delay the project if they don’t stay on track.
It also emphasizes the need for ongoing monitoring of the critical path throughout your project. As tasks progress or change, the critical path can shift. Therefore, it should be regularly reviewed to catch potential delays. This makes the critical path network not just a planning tool but a real‑time dashboard for proactive project control and deadline management.
Why ProjectManager Is Better than a Critical Path Diagram
ProjectManager is better than a traditional critical path diagram because it adds depth and functionality that static diagrams simply can’t match—starting with resource management. While a critical path diagram identifies which tasks are critical, it doesn’t help assign or balance the workload of the people doing the work. Our software allows teams to view real-time availability, use color-coded workload charts to avoid overallocation and manage assignments across departments with the centralized team page. This ensures that critical tasks aren’t just scheduled but properly staffed, reducing risk and improving project execution.
Use Multiple Project Views to Execute Plans
Multiple project views—Gantt, kanban, task list, calendar and sheet—allow teams to manage and interact with the schedule in a way that works best for them. While a critical path diagram is a useful planning tool, it’s often static and limited to a single format. Our flexible platform means the critical path is still visible in the Gantt chart, but work can be tracked and executed in a kanban board or list view without losing visibility or consistency. This makes collaboration and day-to-day management much more effective across diverse teams.
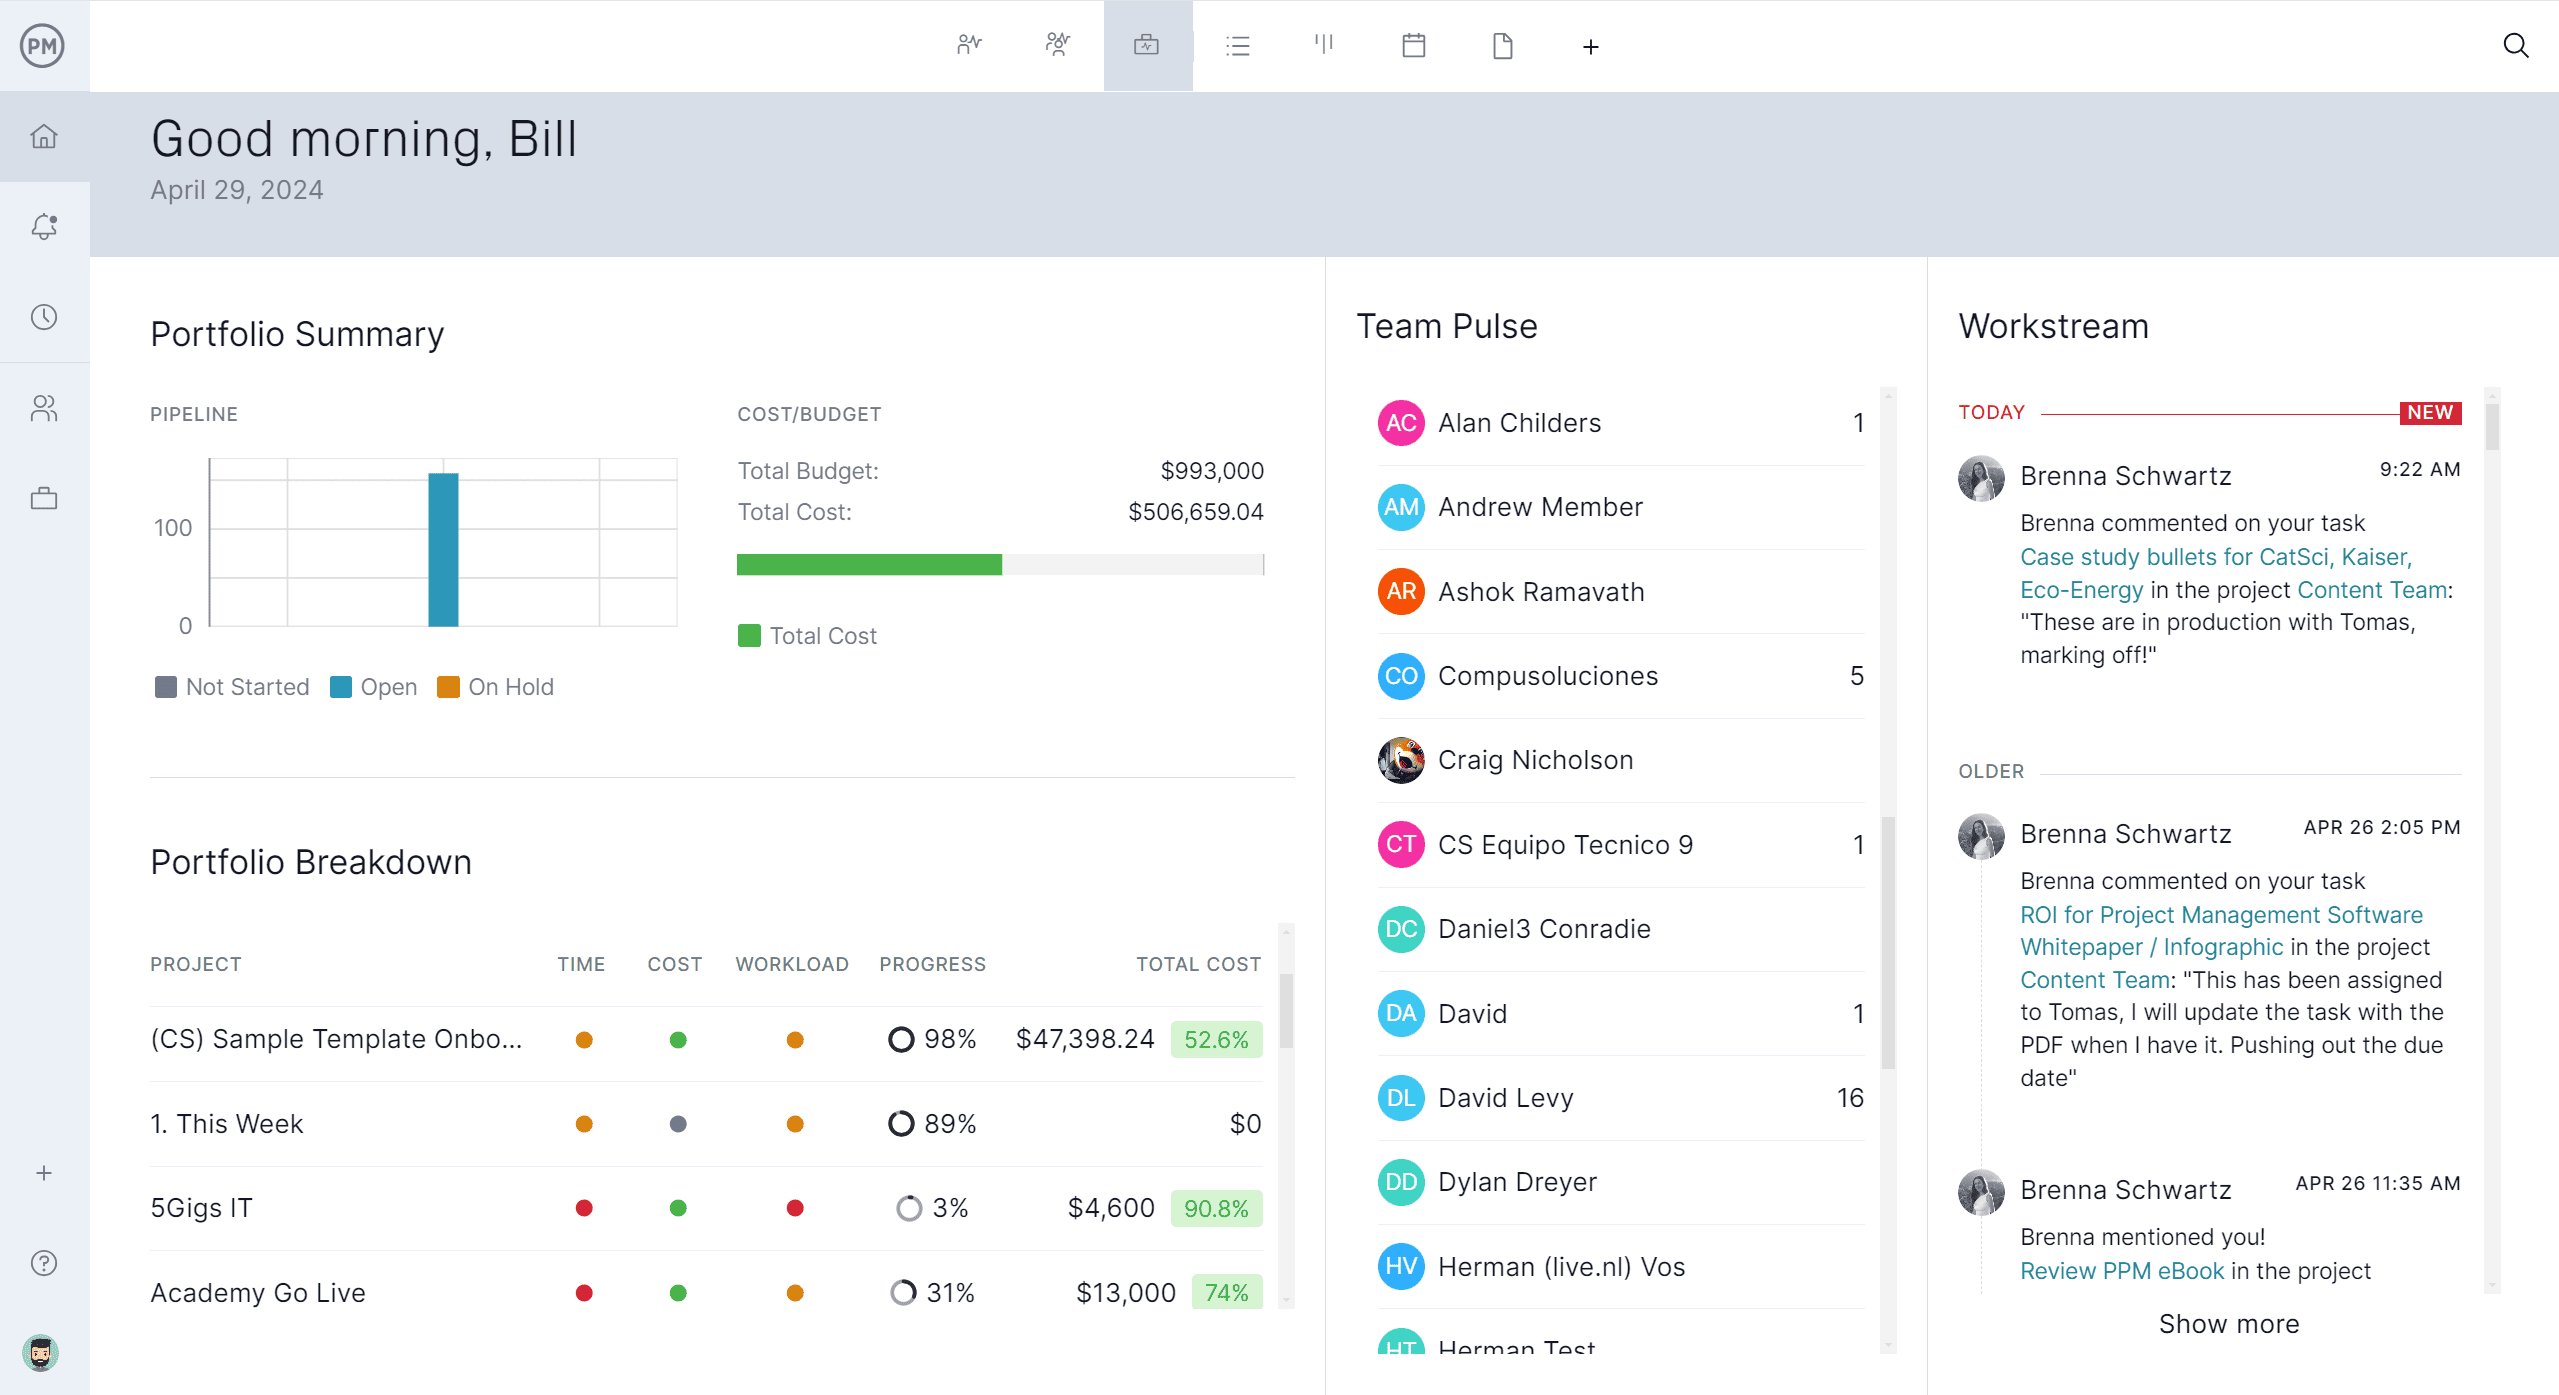
Track Baseline in Real Time to Stay on Schedule
With real-time dashboards, customizable reports and secure timesheets, teams can monitor progress against the baseline, quickly identify issues and make data-driven adjustments. Unlike a manual critical path diagram, which requires time-consuming updates, our software dynamically reflects changes as they happen. This constant visibility keeps projects on schedule, stakeholders informed and critical path activities under control from start to finish.
Related CPM Diagram Content
To learn more about a critical path diagram, follow the links below. We’ve written about the subject repeatedly. Here are some of the more recent blogs we’ve published on critical path software, using a CPM diagram in construction and more.
- Critical Path Software
- Critical Path Method (CPM) in Project Management
- Displaying the Critical Path on a Gantt Chart
- Critical Path Method (CPM) in Construction: A Quick Guide
ProjectManager is online project and portfolio management software that connects teams whether they’re in the office or out in the field. They can share files, comment at the task level and stay up to date with email and in-app notifications. Join teams at Avis, Nestle and Siemens who are using our software to deliver successful projects. Get started with ProjectManager today for free.
