All projects are embedded with the potential for problems or opportunities. This is called risk, and project management has created risk management tools to address these uncertainties. One technique is bowtie analysis.
We’ll break down the bowtie model and explain when to do a bowtie risk assessment, including a bowtie diagram in an example to make the concept fully understandable. We’ll also include a free template to download so you can try it on your own.
What Is a Bowtie Analysis?
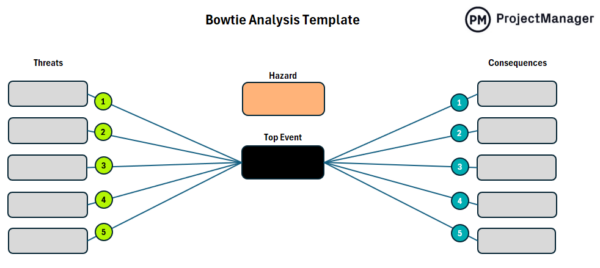
The bowtie method is a risk management technique used to visualize and analyze the potential risks and their controls within a system or process. It’s called “bowtie” because the resulting diagram resembles a bowtie shape, with a central event (often referred to as a “top event”) at the center, risks and causes on the left side and consequences and controls on the right.
The bowtie diagram is made up of several key elements, listed below.
- Top Event: The central event or risk that could have significant consequences. It’s the “failure” or undesired event that the analysis aims to prevent.
- Causes (Left Side): The factors, conditions, or failures that might trigger the top event. These are typically risk factors that can lead to the central failure.
- Consequences (Right Side): The outcomes or impacts if the top event occurs. These could be financial losses, damage to reputation, legal issues, etc.
- Barriers/Controls: Measures to prevent the top event (on the left) or mitigate the consequences (on the right). These can be physical barriers, procedural controls, safety measures or training programs.
Bowtie analysis helps identify and prioritize potential risks, enabling organizations to implement appropriate mitigation strategies. It also serves as a communication tool that clearly shows both the pathways to risk and the systems in place to manage them, ensuring stakeholders understand the organization’s risk profile.
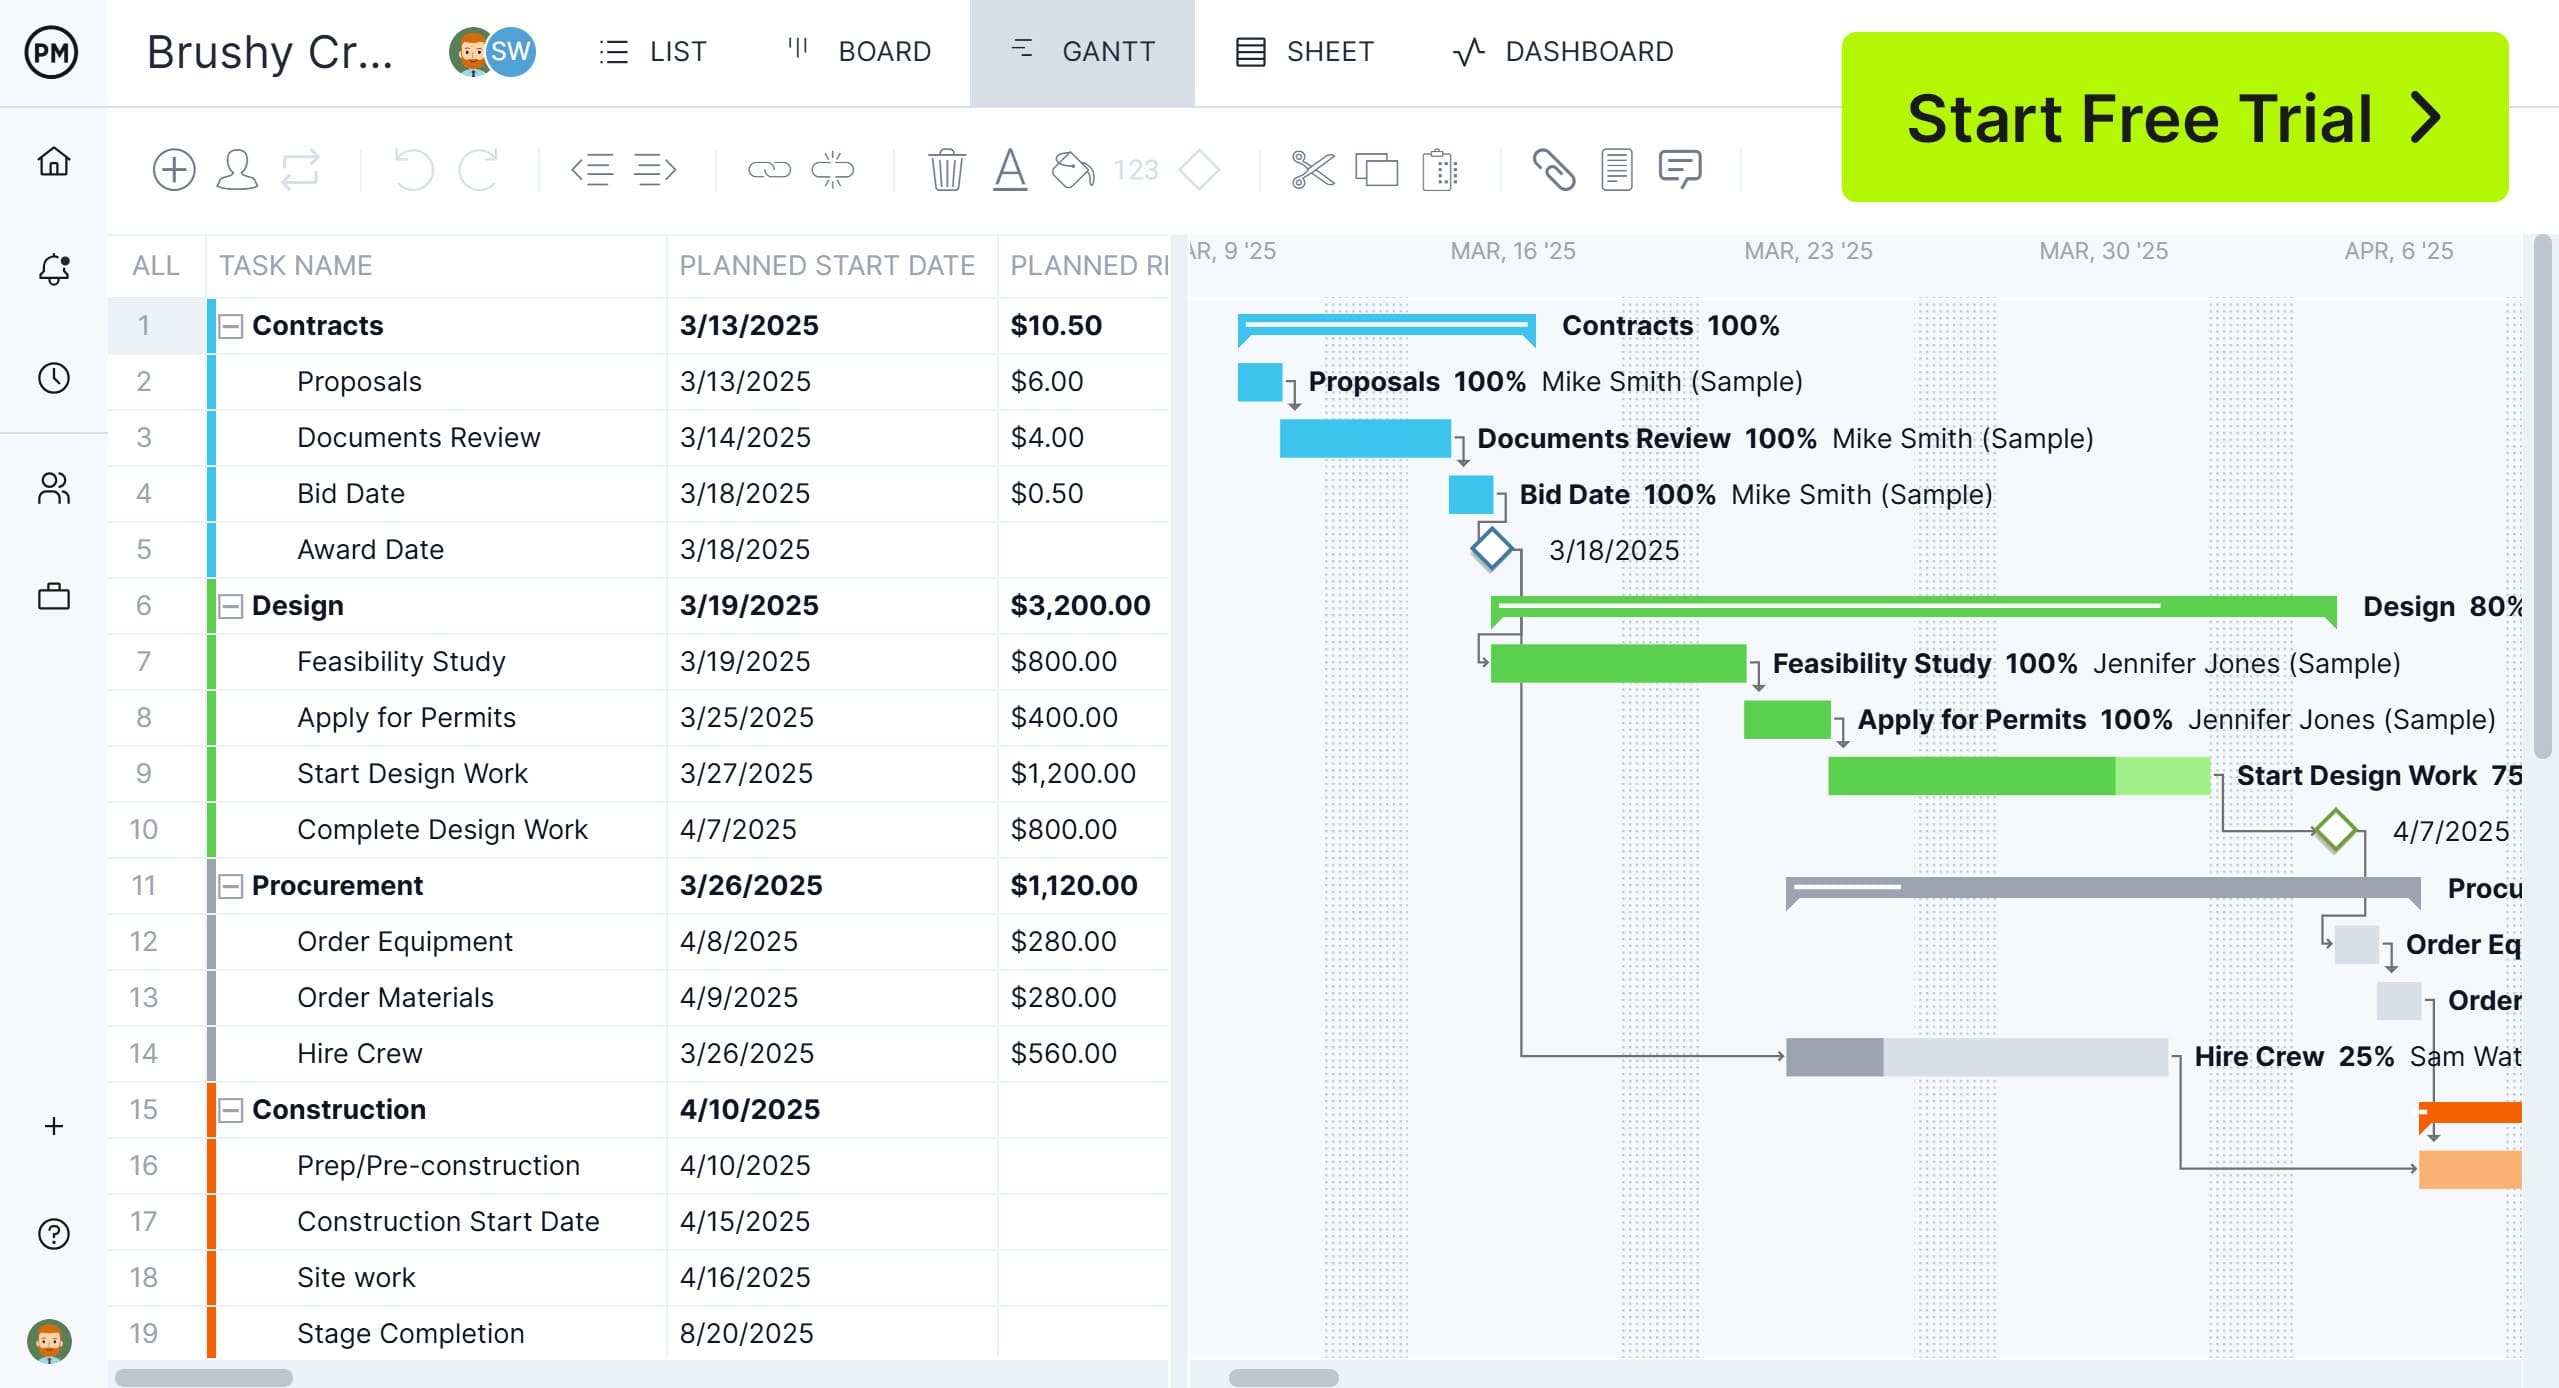
This method is commonly used in industries where safety is critical, such as aviation, oil and gas, healthcare and manufacturing. Bowtie analysis and Gantt charts serve different purposes in project management, but they can complement each other when planning and managing risks within a project. Bowtie analysis helps with risk identification, which informs the planning of tasks to address these risks. Gantt charts also assign roles and deadlines to ensure the right people are handling risk mitigation strategies. Project management software facilitates this relationship.
ProjectManager is award-winning project and portfolio management software with Gantt charts and risk management features that help plan mitigation strategies. Risk cards can identify potential problems. They have a risk matrix to gauge the impact and likelihood of risks occurring. Then Gantt charts can schedule the tasks, resources and costs, including dependencies, filtering for the critical path and setting a baseline to track progress in real time. Get started with ProjectManager today for free.
When to Conduct a Bowtie Analysis
A bowtie analysis should be conducted in specific situations where risk management and safety are critical to the success of a project or operation. Here are some key scenarios when a bowtie analysis is most useful.
- When identifying and managing high-risk scenarios
- Before major projects or initiatives
- When introducing new processes or systems
- During safety audits or hazard assessments
- When you have complex or multi-stage processes
- In highly regulated industries
- When responding to near misses or past failures
- When developing emergency response plans
Get your free
Bowtie Analysis Template
Use this free Bowtie Analysis Template for Excel to manage your projects better.
How to Conduct a Bowtie Analysis
The bowtie model is a structured method used to visualize and manage risks by identifying the causes and consequences of an event and then defining controls to prevent or mitigate these risks. The method helps in understanding both proactive and reactive measures to control risks. Here are the key steps to effectively conduct a bowtie analysis
1. Define the Hazard or Root Cause for Risks
The first step in bowtie analysis is identifying the hazard or root cause that could lead to a risk event. This might be a specific condition, activity or external factor that has the potential to cause harm. Clearly defining the hazard is crucial because it sets the foundation for the analysis and ensures that subsequent steps focus on managing the most relevant risks. This step often involves brainstorming sessions with stakeholders and subject matter experts to pinpoint the primary risk factors.
2. Identify the Top Risk Event
Once the hazard is identified, the next step is to determine the “top risk event”—the central event that could occur as a result of the hazard. This event is typically the main concern in your risk management process and is the focal point in the bowtie diagram. It’s the event you want to avoid through proactive measures and understanding this event is crucial to managing the overall risk.
3. List Threats or Contributing Factors for the Top Risk Event
After identifying the top risk event, list the threats or contributing factors that could lead to it. These are the causes or triggers that can increase the likelihood of the top risk event happening. These threats are often conditions, actions or behaviors that contribute directly to the risk event. This step helps in understanding the root causes and prioritizing areas for intervention.
4. Plan Preventive Controls to Avoid Threats
In this step, focus on planning and implementing preventive controls to avoid the threats that could lead to the top risk event. Preventive controls are designed to reduce the likelihood of a threat occurring in the first place. These may include process changes, safety measures, training programs or technological solutions. The goal is to stop the threats before they escalate into a risk event, thereby reducing the overall risk exposure.
5. List Potential Consequences for the Top Risk Event
Once you have a clear picture of the threat and preventive controls, it’s time to consider the consequences of the top risk event if it were to occur. Consequences refer to the potential outcomes or damage that could result from the risk event, such as financial loss, injury, environmental harm or reputational damage. Identifying the consequences allows you to understand the severity of the risk and helps prioritize mitigation efforts based on the potential impact.
6. Plan Mitigative Controls to Mitigate the Consequences of the Risk Event
Finally, after understanding the potential consequences, the bowtie analysis requires you to plan and implement mitigative controls. These are strategies and measures that reduce the impact or severity of the consequences if the risk event were to occur. Mitigative controls might include emergency response plans, containment procedures, insurance or additional safeguards that can help limit damage and ensure a swift recovery.
Bowtie Analysis Template
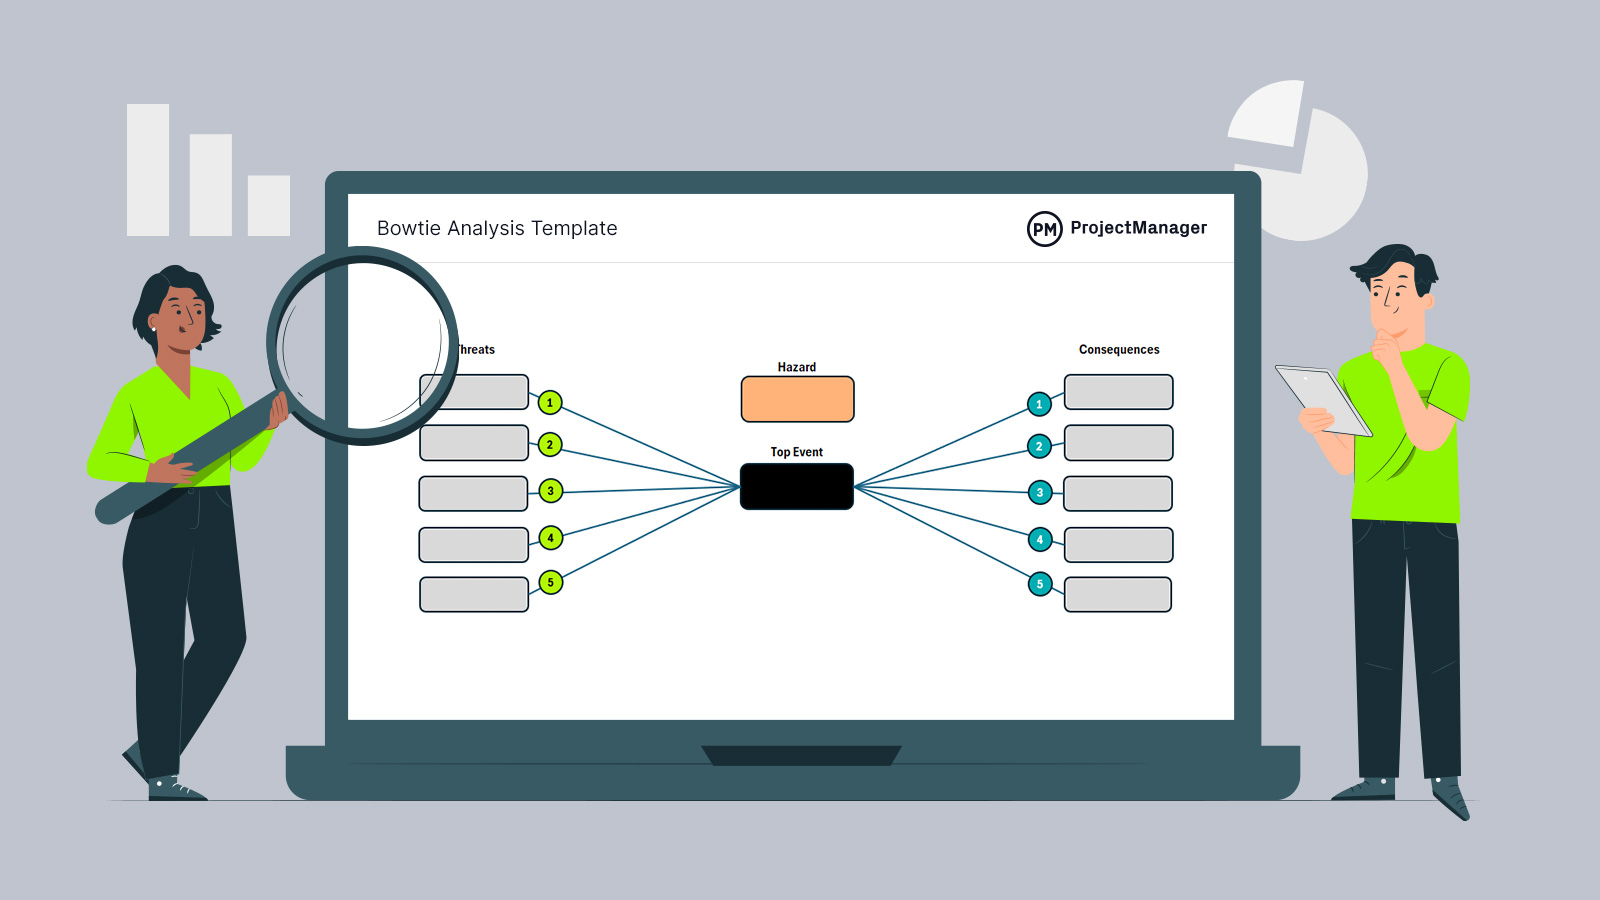
Now that we understand what the bowtie method is and how to execute it, the next step would be to try it ourselves. That requires either building a bowtie diagram from scratch or downloading this free bowtie analysis template for Excel.

The template has all the elements that one needs in place. All the user has to do is fill them out. Our free template is fully customizable and can be reused over and over again. For those who want to see how it works, we’ve shared an example below.
Bowtie Analysis Example
The best way to understand bowtie risk analysis is to look at a real-life scenario. Let’s use bowtie analysis to visualize a potential risk in a construction site.
In a job site, a common hazard might be working at height. The top event in this scenario is a worker falling from an elevated surface. Several threats could lead to this event, such as the absence of guardrails, a slippery or unstable working surface or inadequate worker training on fall protection. To prevent the fall from occurring, various control measures can be implemented.
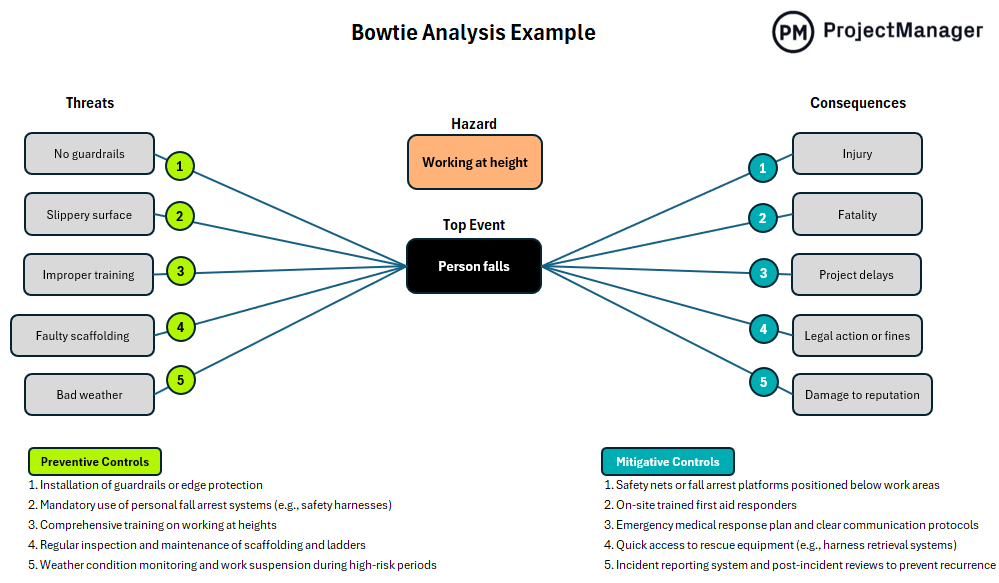
These include installing guardrails or edge protection, requiring personal fall arrest systems like safety harnesses and ensuring workers receive proper training on working safely at heights.
Despite these efforts, if a fall still occurs, there are mitigative controls designed to reduce the severity of the consequences. These may involve placing airbags or safety nets below work areas, having trained first aid responders on site and maintaining a clear and practiced emergency response plan. Together, these measures help manage the risk effectively.
Benefits of Bowtie Analysis
Bowtie analysis offers several key benefits for risk management, particularly in industries that involve complex processes and high levels of risk. By providing a clear, visual representation of risks, their causes and consequences, bowtie risk assessment enhances understanding and decision-making. Below are some of its key advantages.
- Clear visualization of risk scenarios
- Improved risk mitigation strategies
- Facilitates compliance and safety
- Promotes a structured risk management process
- Enhanced decision making and prioritization
- Supports continuous improvement
- Improved communication and collaboration
Disadvantages of Bowtie Analysis
While the bowtie method offers many benefits for risk management, it also has some limitations and challenges that should be considered before its implementation. Here are some of the key disadvantages.
- Complexity in large-scale projects
- Time-consuming to create and maintain
- Limited scope of analysis
- Requires expertise and experience
- Over-simplification of risks
- Limited focus on interdependencies
- Subjective interpretation of controls
Related Risk Management Templates
The bowtie risk assessment is one of many techniques used to identify, assess and mitigate project risks. Just as there is a bowtie diagram, there are other templates that can help in risk assessment. We have over 100 free project management templates for Excel and Word that address all aspects of managing a project. Below are some that can be used in risk management.
Risk Assessment Template
Download this free risk assessment template for Excel to systematically identify, evaluate and manage potential risks within a project, process or organization. It provides a structured format for recording key information about hazards, their likelihood and impact and the controls in place to mitigate them.
Risk Register Template
Use this free risk register template for Excel to log and track potential risks throughout the life of a project or business operation. It serves as a centralized repository where all identified risks are documented, evaluated and monitored. The purpose of a risk register is to provide visibility into possible threats, assess their impact and likelihood, assign ownership and record mitigation or contingency plans.
Risk Matrix Template for Excel
A risk matrix is a visual tool used to assess and prioritize risks based on their likelihood of occurring and their potential impact. This free risk matrix template for Excel takes the form of a grid where one axis represents the probability (from rare to almost certain) and the other axis represents the severity (from insignificant to catastrophic). By plotting risks on this matrix, teams can easily determine which issues need immediate attention and which are less critical.
How ProjectManager Helps With Project Risk Management
Templates are risk management tools, but only to a point. They are static documents that must be manually updated and are poor for collaboration. To identify, assess and mitigate risk more efficiently, use project management software. We’ve already shown how our software has risk management features to help strategize and multiple project management views that allow for the planning and execution of that strategy. There are also resource management features and project monitoring tools to keep those plans on track.
Keep Teams Productive With Resource Management Tools
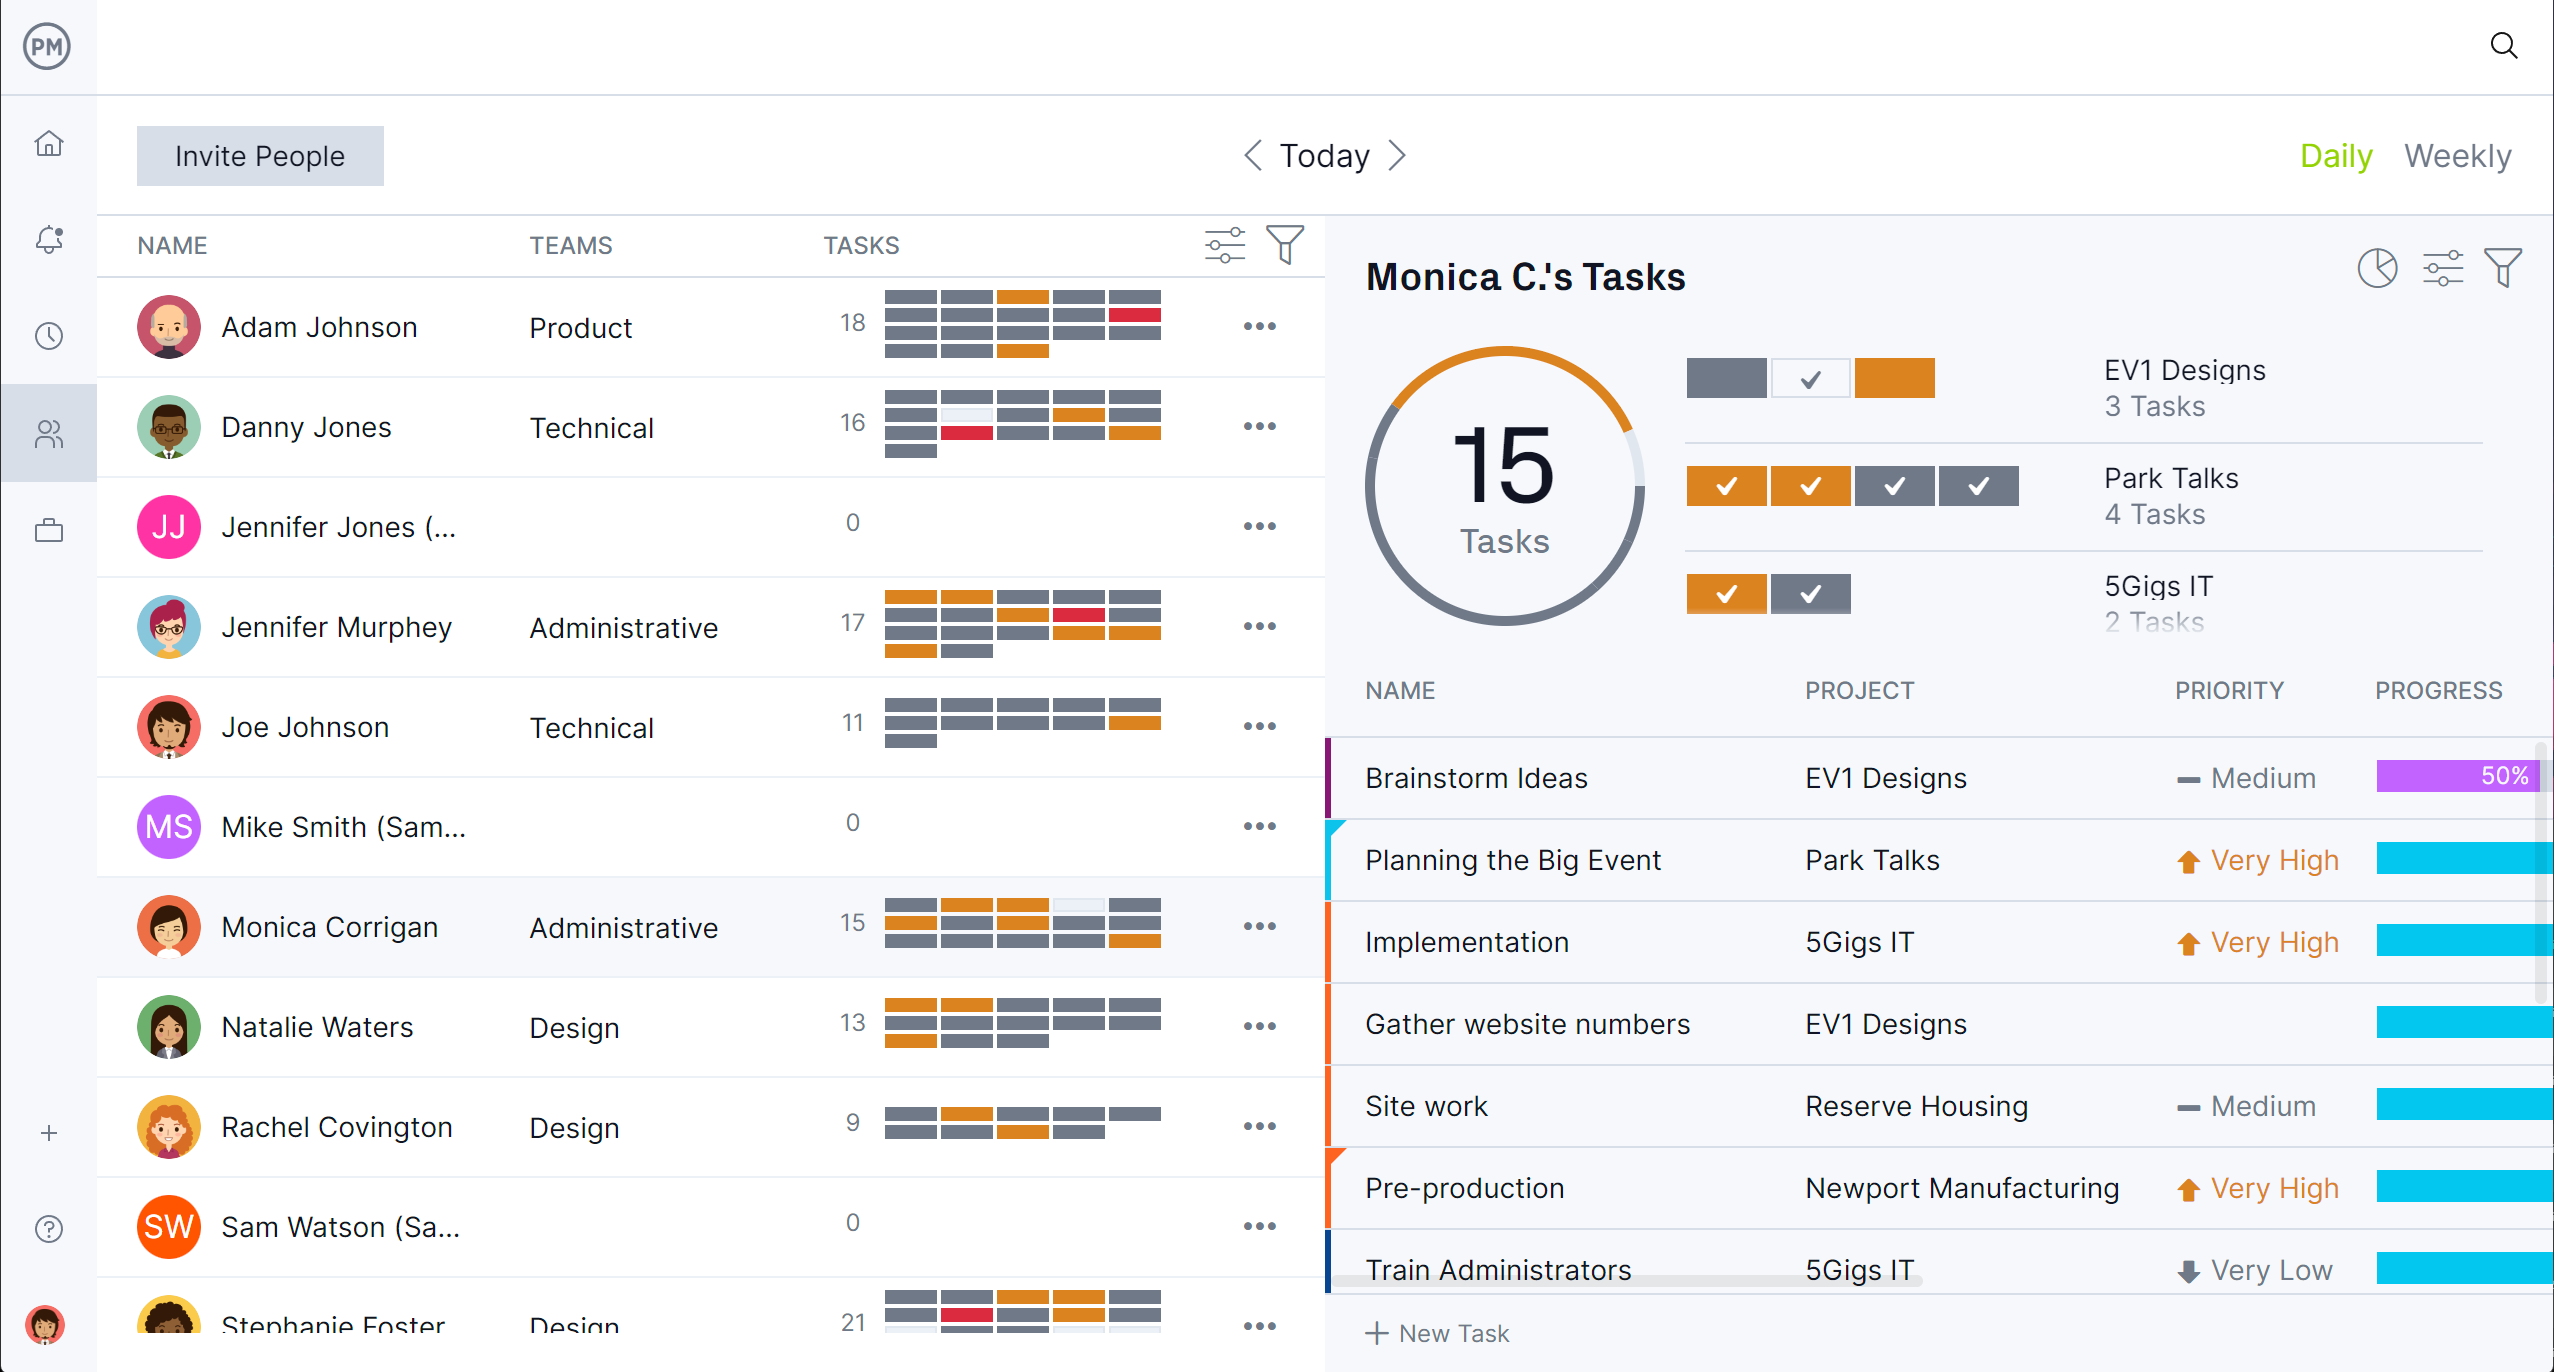
Once plans are enacted to mitigate risks, project managers need to ensure that the right resources are available and scheduled. This starts on the Gantt chart and moves to onboarding, where team availability, skills and pay rate are set. Once assignments are made, use the color-coded workload page to view resource allocation across one or multiple projects.
It makes it easy to see who is overallocated or underutilized, and the team workload can be balanced right from that chart to keep everyone working at capacity without worrying about burnout. A team page provides a daily or weekly overview of team activity, which can be filtered by priority or progress. Tasks can also be updated from that page.

Track Progress and More With Real-Time Dashboards and Reports
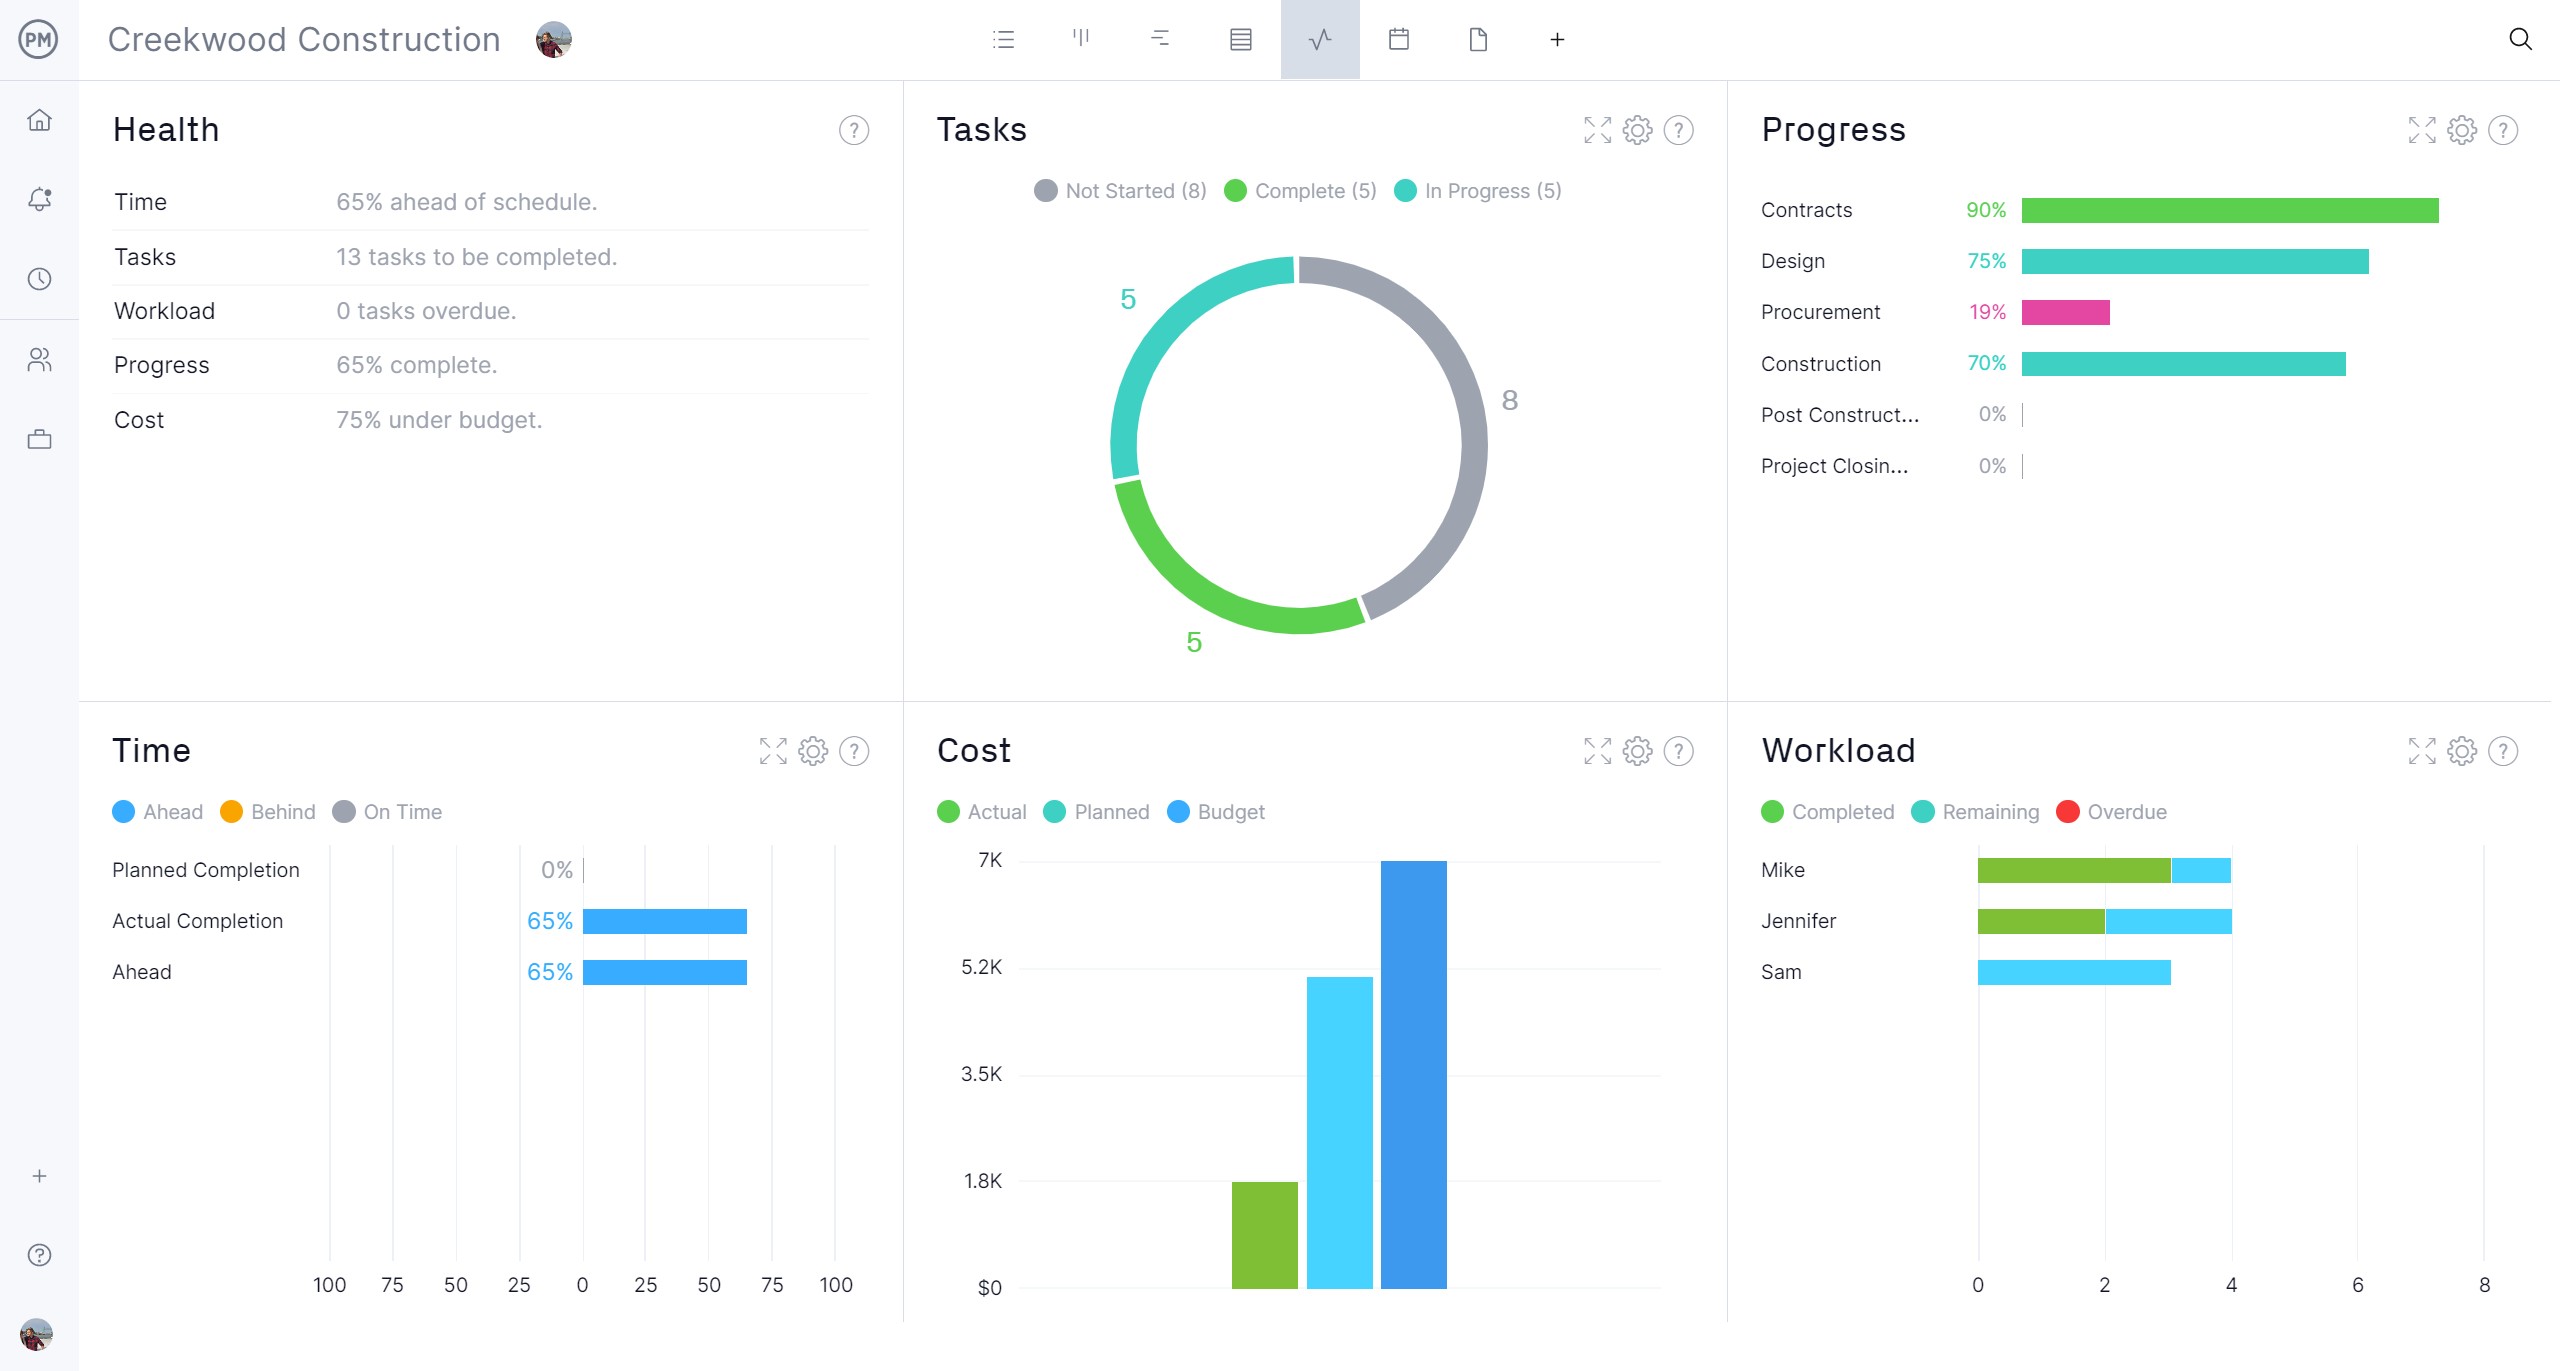
More than just resources, all project metrics must be monitored to control the project. For a high-level overview, toggle to the real-time project or portfolio dashboards. They display easy-to-read graphs and charts on time, cost, workload and more, all without having to do a time-consuming setup.
Customizable reports on status, variance, workload, timesheets and more go deeper into the data and can be filtered to focus on specific data points or more general information to share with stakeholders. Secure timesheets streamline payroll, but also track labor costs to keep projects on budget.
Related Risk Management Content
There’s more to risk management than bowtie analysis. For those looking to learn about the subject, below are some links to recently published articles on our blog about making a risk management plan, a risk breakdown structure and more.
- The Best Risk Management Tools & Techniques for PM Pros
- Risk Mitigation in Project Management
- How to Make a Risk Management Plan (Template Included)
- Project Risk Analysis: Quantitative & Qualitative Techniques
- What Is Project Risk? 7 Project Risks to Track
- Risk Breakdown Structure for Projects
- What Is Positive Risk on Projects?
ProjectManager is online project and portfolio management software that connects teams whether they’re in the office or out in the field. They can share files, comment at the task level and stay updated with email and in-app notifications. Join teams at Avis, Nestle and Siemens who use our software to deliver successful projects. Get started with ProjectManager today for free.
