Staying on top of sprint progress shouldn’t require building a chart from scratch every time. This burndown chart template is designed to give teams a fast, reliable way to visualize remaining work during a sprint. Instead of wrestling with formulas and formatting, you can focus on execution and decision-making.
Or better yet, manage software development projects with ProjectManager. ProjectManager is an award-winning project portfolio management software that offers advanced planning, scheduling and tracking tools for software development, digital product management and IT teams, allowing them to create visual roadmaps for their delivery plans, allocate resources, track costs and manage waterfall and agile workflows. Additionally, ProjectManager integrates with Jira, Azure Devops and features an open API that facilitates integration with other software development tools. Get started for free today.
Why You Need an Excel Burndown Chart Template
Building a burndown chart manually every sprint wastes time and increases the risk of errors. This burndown chart template for Excel automates the entire process. All you need to do is enter sprint days, ideal burndown values and actual remaining work. The template instantly generates a visual burndown chart and automatically updates when those numbers change, helping busy software development teams monitor progress without extra setup.
When To Use an Excel Burndown Chart Template
Software development teams typically create or use a burndown chart template at the start of a sprint, once scope and time are fixed. It becomes a daily tracking tool throughout the iteration, especially when teams need quick visibility into whether work is burning down at the expected pace.
- At the beginning of a two-week sprint to track committed story points daily.
- During daily stand-ups to quickly review progress against the ideal burn rate.
- When stakeholders request a simple visual update on sprint execution status.
- If actual progress begins drifting above the planned burndown line.
- When teams want a lightweight alternative to complex agile dashboards.
Who Should Use this Free Burndown Chart Template for Excel?
Within a software development team, the scrum master is typically responsible for maintaining and reviewing the burndown chart template. This role owns sprint transparency and ensures progress is visible daily. By keeping the chart accurate, the scrum master helps the team identify pacing issues early and adjust before the sprint ends.
- Product Owner: Reviews sprint progress and clarifies scope changes.
- Development Team: Updates remaining work estimates during daily stand-ups.
- Project Manager: Uses chart to communicate sprint status externally.
How to Use ProjectManager’s Burndown Chart Template for Excel
Using ProjectManager’s burndown chart template for Excel is straightforward. Enter your sprint timeline, define your planned burn rate and update remaining work daily. The template handles the calculations and visual updates automatically, giving you a clean sprint burndown chart without additional setup.
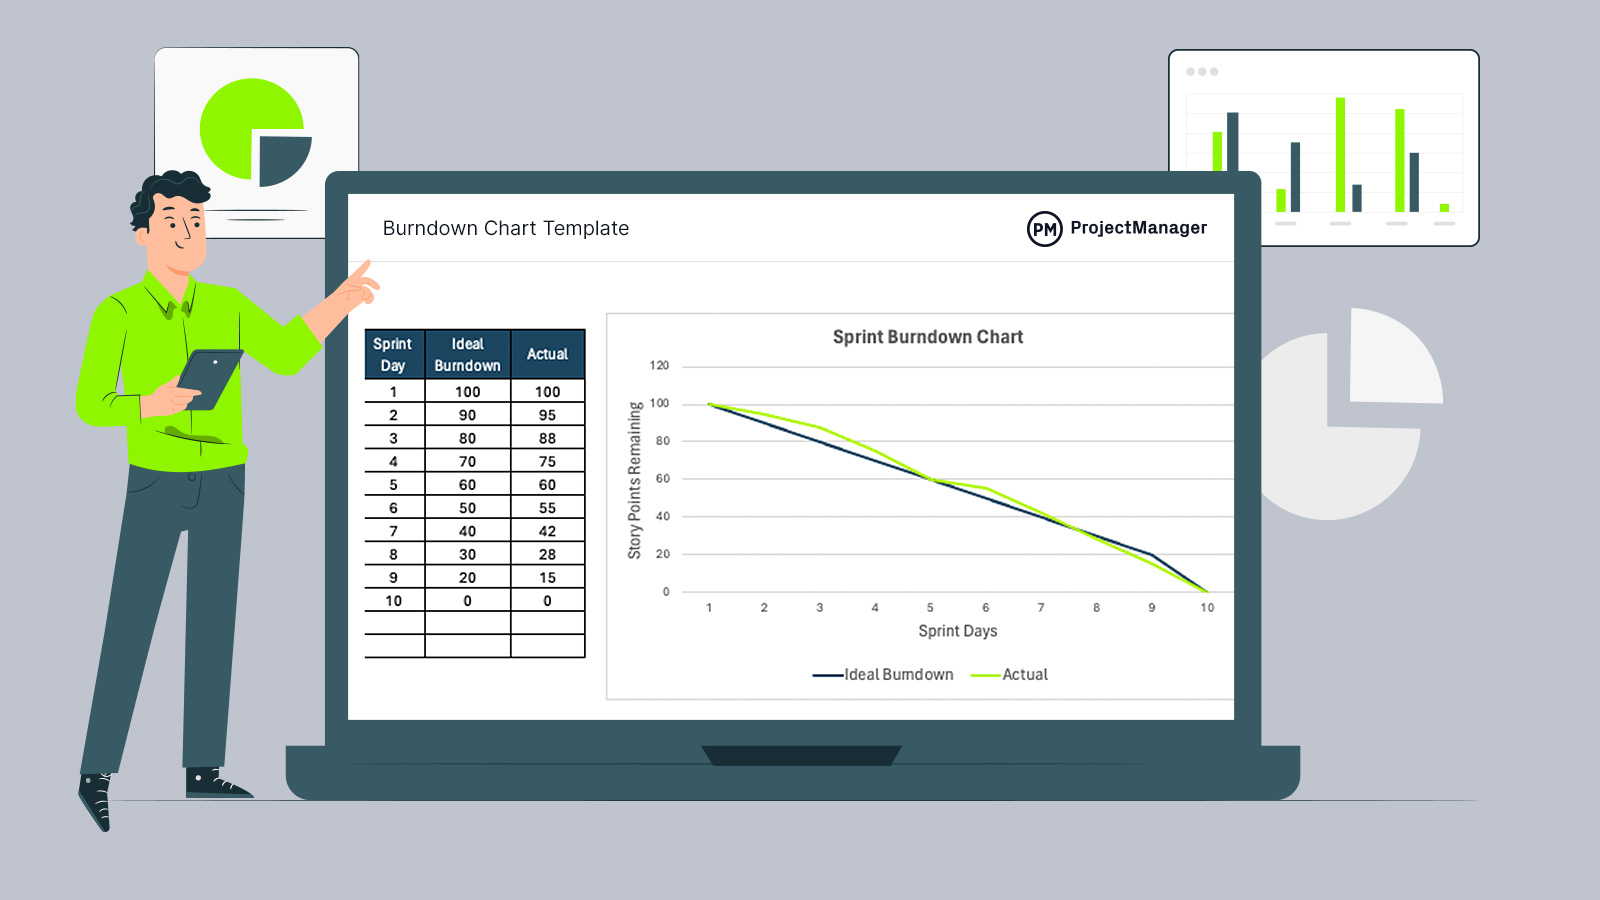
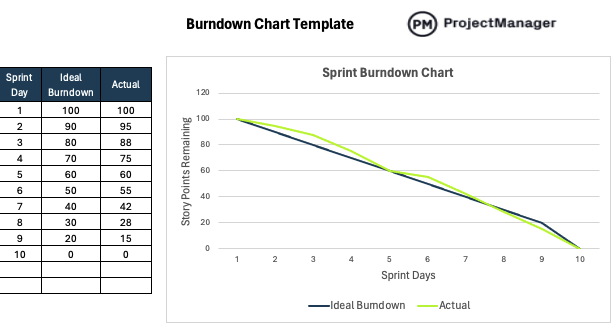
Sprint Day
In a burndown chart, sprint day represents each working day within the fixed sprint timebox. It forms the horizontal axis of the chart and tracks progress from the first day of the sprint to the final day. Each sprint day corresponds to a snapshot of remaining work.
When using this template, list each sprint day sequentially from start to finish. Enter one row per working day, even if no progress is made. Keeping the sprint day column complete ensures the chart accurately reflects pacing and highlights gaps or delays in execution.
Ideal Burndown
Ideal burndown reflects the planned rate at which work selected from the sprint backlog should decrease over the sprint. It appears as a straight line descending from the total committed scope to zero by the final sprint day. This line represents the expected pace required to complete all sprint backlog items on time.
To use this column in the burndown chart Excel template, calculate a steady daily reduction from the total story points committed from your sprint backlog down to zero. Enter those values before the sprint begins. The template uses them to draw the ideal line, giving you a baseline for comparing actual remaining work.
Actual Remaining Work
Actual remaining work represents the amount of effort still unfinished from the sprint backlog at the end of each sprint day. In a burndown chart, this value is plotted against time to show how quickly the team is reducing committed scope. Unlike completed work, it focuses only on what is left to deliver.
To use this column in the template, update the remaining story points or hours for the sprint backlog at the end of each day. Do not subtract manually from previous rows. Instead, reassess what is still open and enter that number. The chart will automatically adjust to reflect real sprint performance.
Visualize the Chart
Once sprint days, ideal burndown and actual remaining work are entered into this burndown chart template for Excel, the visual burndown chart is generated automatically. The horizontal axis shows sprint days, while the vertical axis displays remaining effort from the sprint backlog. The straight ideal line represents planned progress, and the actual line reflects daily performance, making it easy to spot pacing issues instantly.
ProjectManager Can Help with IT & Software Development Projects
ProjectManager is an award-winning project portfolio management software built for IT and software development teams that need visibility and control across multiple initiatives. Teams can create Gantt chart roadmaps to manage delivery plans and entire project portfolios, while real-time dashboards track resource utilization, project costs and progress. Kanban boards support agile sprints and iterative planning, helping teams organize work without slowing down development.
In addition to planning and tracking tools, ProjectManager includes strong resource management capabilities. Workload charts help balance assignments across team members, and integrated timesheets provide accurate time tracking. The platform integrates with Jira and Azure DevOps and offers an open API, enabling organizations to connect its full project portfolio management functionality with their existing tools. Watch the video below to learn more.
Free Related Software Development Templates
We’ve created over 100 free project management templates for teams across industries. Here are some ProjectManager templates that can help with roadmap planning in software development.
Agile Sprint Plan Template
This agile sprint plan template is built to structure and manage iteration work by moving prioritized user stories from the product backlog into active sprint tasks. Organized in a kanban-style format, it supports assigning owners, setting due dates, defining priorities, breaking stories into subtasks and tracking sprint progress in real time while keeping effort aligned with sprint goals.
Product Roadmap Template
This product roadmap template provides a timeline view of planned features, releases and strategic initiatives. It helps clarify dependencies, establish milestones, evaluate sequencing risks and present high-level progress. By connecting product direction with engineering execution, it makes delivery windows and long-term priorities easier to understand.
Managers must keep their eye on the progress of a project. If they don’t, then they’re risking the successful completion of the project. A burndown chart is just one of the many tools that lead to project success. ProjectManager is a cloud-based project management software that any manager will want to have in their toolbox. It has features such as a real-time dashboard to monitor and report on progress, and an online Gantt chart to streamline scheduling and help with collaboration. Try it today for free with this 30-day trial.