Watch Devin Deen, project management expert, chart the critical path of a project using the “Activity on the Arrow” diagramming technique. This will help you measure the planned versus actual project schedule and identify any risks associated with getting your project delivered on time.
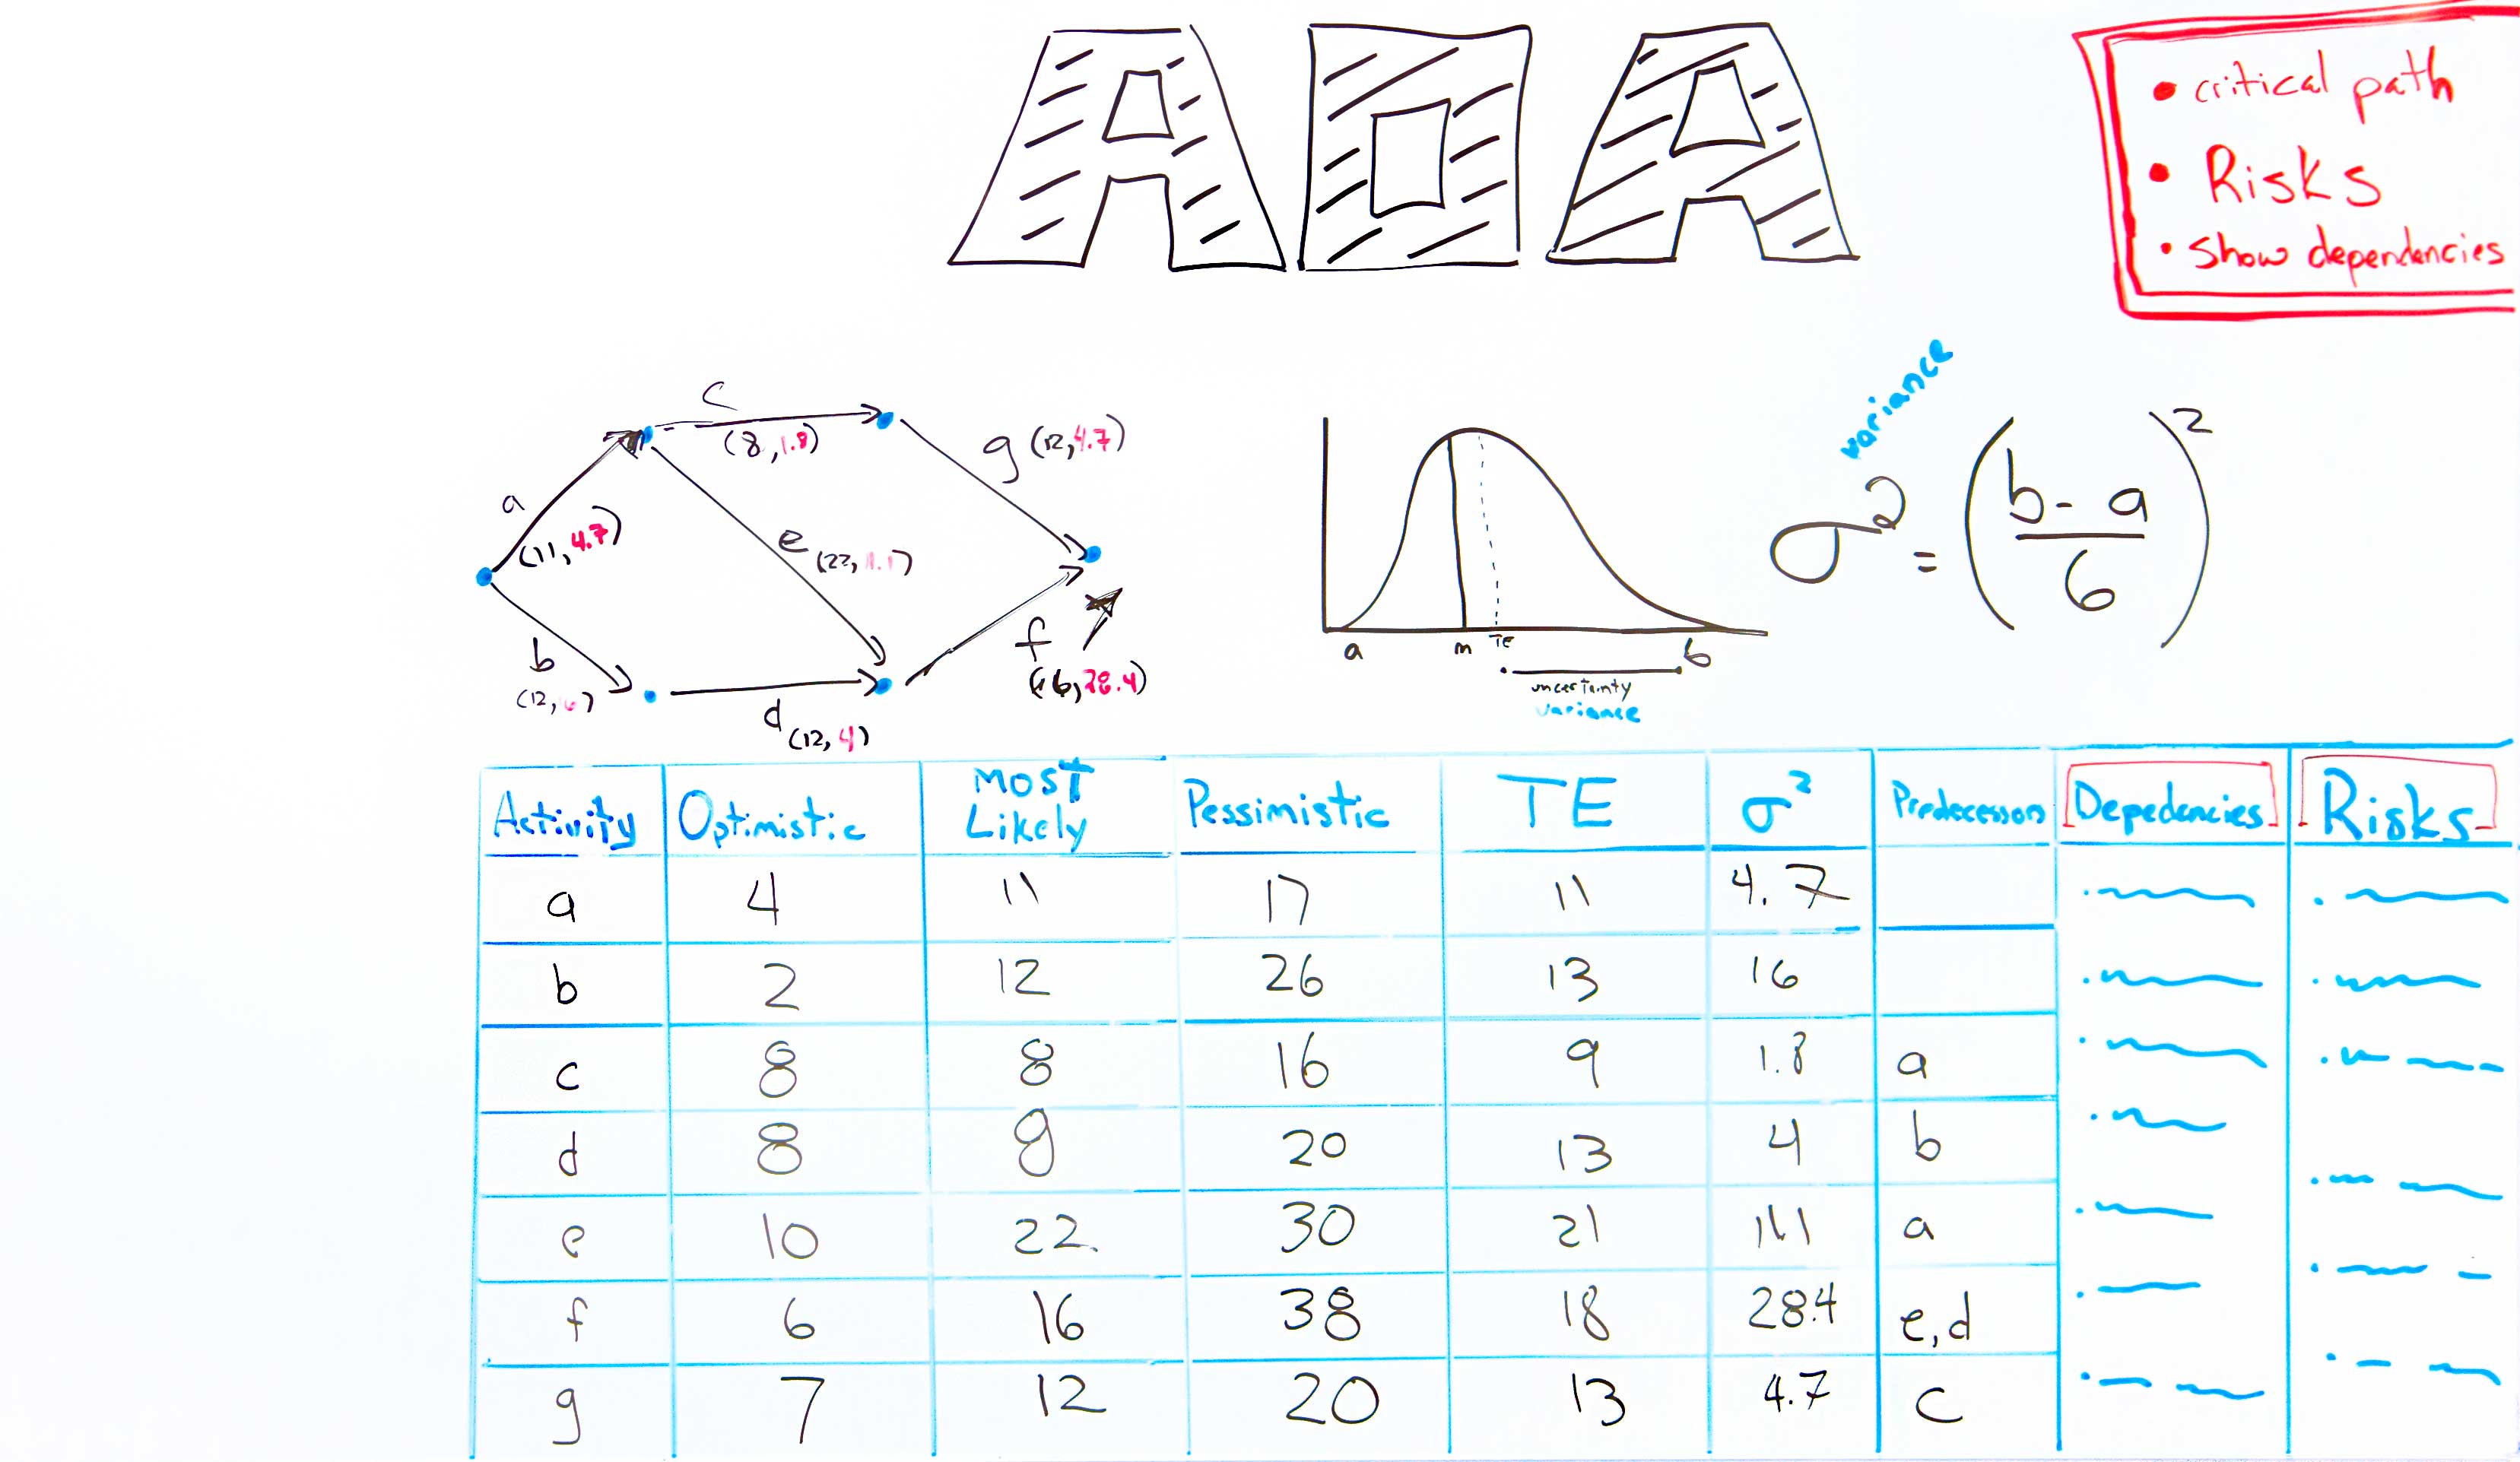
Here’s a screengrab of the whiteboard:
In Review: How to Chart Your Project’s Critical Path
In this video, Devin talked about the importance of activity on the arrow diagramming as a method to show your projects the critical path, including identifying the risks and dependencies along the critical path.
Using the beta statistical distribution method, you can work with your team to determine the most optimistic, most pessimistic and most likely estimates to calculate the time necessary for completing a specific task.
Then you can calculate the variance between the time you estimate it will take to complete a task and the time require to do that same work. This is also called six sigma.
Through the activity on the arrow diagramming method Devin demonstrates, you can determine the critical path when scheduling and planning your project, as well as the risks and dependencies associated with that path.
Pro-Tip: Remember, not all risk is negative.
Take it further: ProjectManager founder Jason Westland explores risks that can help you in his article, What Is Positive Risk on Projects?
Thanks for watching!
Transcript
Hi, welcome. I’m Devin Deen, Content Director here at ProjectManager. Today’s whiteboard topic is archery. With the Hunger Games movies and books, archery is gaining in popularity again. So therefore, I think there’s renewed hope and interest gaining in the activity on the arrow diagramming method as well.
This diagramming method is really good in showing the critical path, helping you identify the risks associated in achieving the critical path on time and teasing out the various dependencies that you need to achieve that critical path as well, which is really useful when you’re talking to stakeholders.
Let’s do one together.
So when you get your project team together and you get them to provide estimates around the optimistic, pessimistic, and most likely time required to achieve an activity, you can then go out and calculate your estimated time for achieving that activity using the beta statistical distribution method.
Once you calculate out your estimated time, you then want to understand the variance between that estimated time and the likelihood it is to actually achieve that estimated time. That’s also called six sigma and in a beta statistical distribution, we calculate it like this. B, which is the pessimistic time, minus A, which is your optimistic time, divided by six and then squared. Using a spreadsheet program like Excel helps out on this heaps.
Let me just do it in the head. Let me see here, A, optimistic, pessimistic, most likely, estimated time, I think that might be 4.7. You probably caught me, yeah, I’m cheating off a cheat sheet. Let’s fill these out together quickly. Once you calculate the variance, then you can look at the variance levels and determine what your riskiest path is. In this case, it’s activity F because it has a variance of 28.4. Your next riskiest activity is activity B, because it’s got a variance of 16.
Let’s plot out the different activities on our network diagram. Starting with the dummy mode at the start point, I start plotting my arrows. So activity A leads into that node, activity B isn’t parallel and goes the other way. Let’s have a look, what comes next? C? Yup, okay, so that goes that way and then let’s see for D I’ve got a precedence of B so that’s my D. Where is E? Ah, yes, activity A so that’s definitely going to be that way. Activity A precedes E and then getting to the finish point, I’ve got activity G and then F. So that’s G and that’s F. Now I’ve plotted out my different arrows to show the activities to getting from start to finish. I’m going to go ahead and plot in my most likely time in the variance just like this. So for A, it’s most likely time is 11 my variant is 4.7.
Once you’ve plotted the various arrows through the network and you’ve listed their estimated expected time to be completed and the variance level, you can start identifying the critical path and the most risky path. In this case, my critical path is A, E, F because that’s the longest path through my schedule and, coincidentally, it’s my riskiest path. As you can see, variances at each of these activities are quite high, with F having a variance of 28.5, E having a variance of 11, and A having a variance of 4.7. So that would start sending out alarm bells to me about that particular pathway through the network, and perhaps I need to look at ways on how to mitigate some of the risks associated with that critical path.
Activity on the arrow diagramming technique is especially useful, as I mentioned before, in showing the critical path through the network, helping you identify the risk associated with the various paths through the network, and very good at showing dependencies of that critical path to your stakeholders.
I’m Devin Deen. For more tips and techniques on project management, come see us at ProjectManager.
