


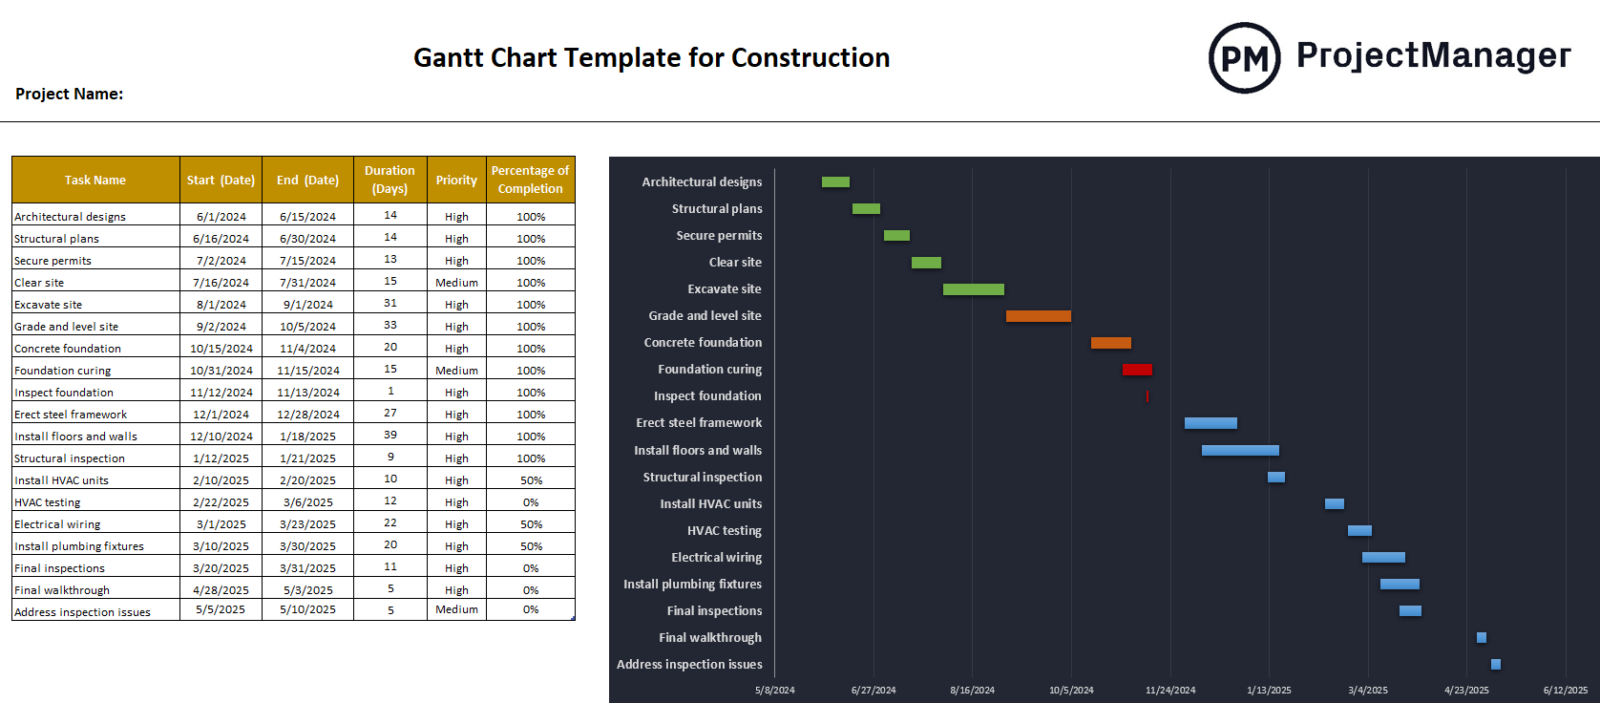
Construction project managers rely on a Gantt chart to visualize every phase of a build, from site clearing and foundation work through to final inspections and walkthrough. A construction Gantt chart template for Excel gives teams a ready-made framework to schedule tasks, assign durations and track progress without building a timeline from scratch on every new job.
The downloadable construction Gantt chart template for Excel shows a construction schedule for a 5-story office building, covering 20 tasks across site preparation, structural work, MEP rough-in and closeout. Tasks are organized with start and end dates, durations, priorities and completion percentages so the project team always knows where the job stands.
If you build your construction Gantt chart in ProjectManager instead, you can assign tasks to crew members, set task dependencies, flag the critical path and track actual vs. planned progress in real time, all without leaving the browser. Get started for free and make a better construction Gantt chart.
Why You Need a Construction Gantt Chart Template
Construction projects involve dozens of overlapping trades, strict permitting timelines and hard deadlines set by owners and lenders. A construction schedule template built as a Gantt chart gives project managers a single document that shows every task, its duration and how it relates to the tasks around it. That visibility is critical when a concrete pour slips and everything downstream needs to shift.
The template saves time at the start of every project. Rather than rebuilding a timeline from scratch, a construction project manager can load the template, swap in the actual tasks for the current job and set realistic start and end dates based on the scope. The standardized format also makes it easier to hand off between superintendents or share progress updates with owners and general contractors.
Tracking progress is built into the template too. Each task row includes a percentage-of-completion column so teams can see at a glance what’s done, what’s in progress and what hasn’t started. Priority flags help superintendents focus attention on the tasks that will hold up the next phase if they slip.
Related: Free Construction Schedule Template
The limitation of any Excel-based template is that it’s static. When a subcontractor falls behind or a material delivery is delayed, the project manager has to manually update every affected task. There’s no automatic rescheduling, no notifications to the team and no way to see how one delay cascades through the rest of the schedule. That’s where ProjectManager changes the equation.

How to Use This Construction Gantt Chart Template for Excel
Once you’ve downloaded the construction Gantt chart template for Excel, it’s ready to customize for your project. The template is organized into two sections: a task grid on the left and an auto-generated timeline on the right.
Add Construction Tasks, Dates and Priorities
Start by replacing the example tasks with the actual work items for your project. The task grid includes columns for the task name, start date, end date and calculated duration in days. Add a priority level – high, medium or low – to each task so the team knows which items are on the critical path. Use the percentage-of-completion column to track progress as the job moves forward. The example schedule covers standard commercial construction phases: site prep, foundation, structural, MEP, inspections and closeout. Adjust the phases and tasks to match the specific scope of your project.
Read the Construction Timeline
When the task grid is filled in, the Gantt chart timeline on the right side of the template automatically reflects the schedule. Each task appears as a horizontal bar spanning its start and end dates. Construction phases can be color-coded – site work in one color, structural in another, MEP in a third – so it’s easy to see which trades are active during any given week. Use the timeline to spot scheduling conflicts before they happen: if two subcontractors are scheduled in the same area at the same time, the overlap will be visible in the chart before it becomes a problem on the job site.
How to Build a Construction Schedule With ProjectManager
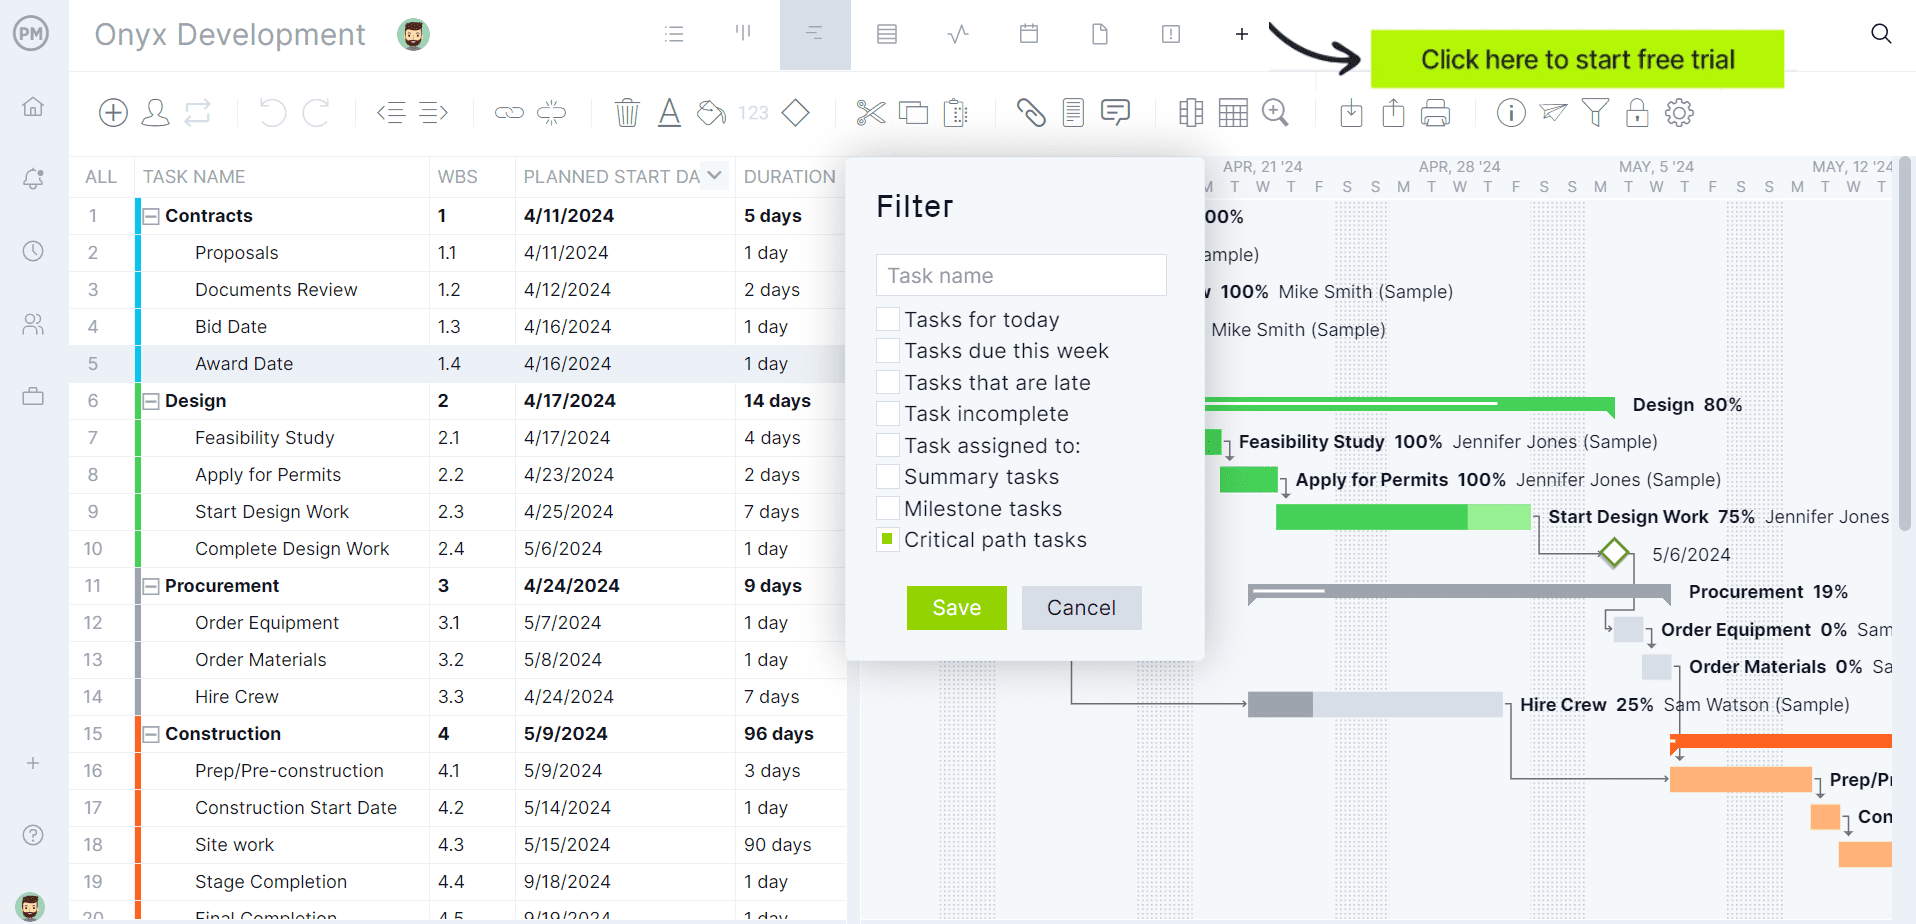
The Excel construction Gantt chart template is a solid starting point, but it can only do a fraction of what a purpose-built Gantt chart tool can do. ProjectManager is award-winning project and portfolio management software built for construction teams in the office and in the field. Gantt charts automatically reschedule dependent tasks when dates change, the critical path updates in real time and the whole team can see the latest schedule from any device.
Schedule Construction Tasks With Dependencies
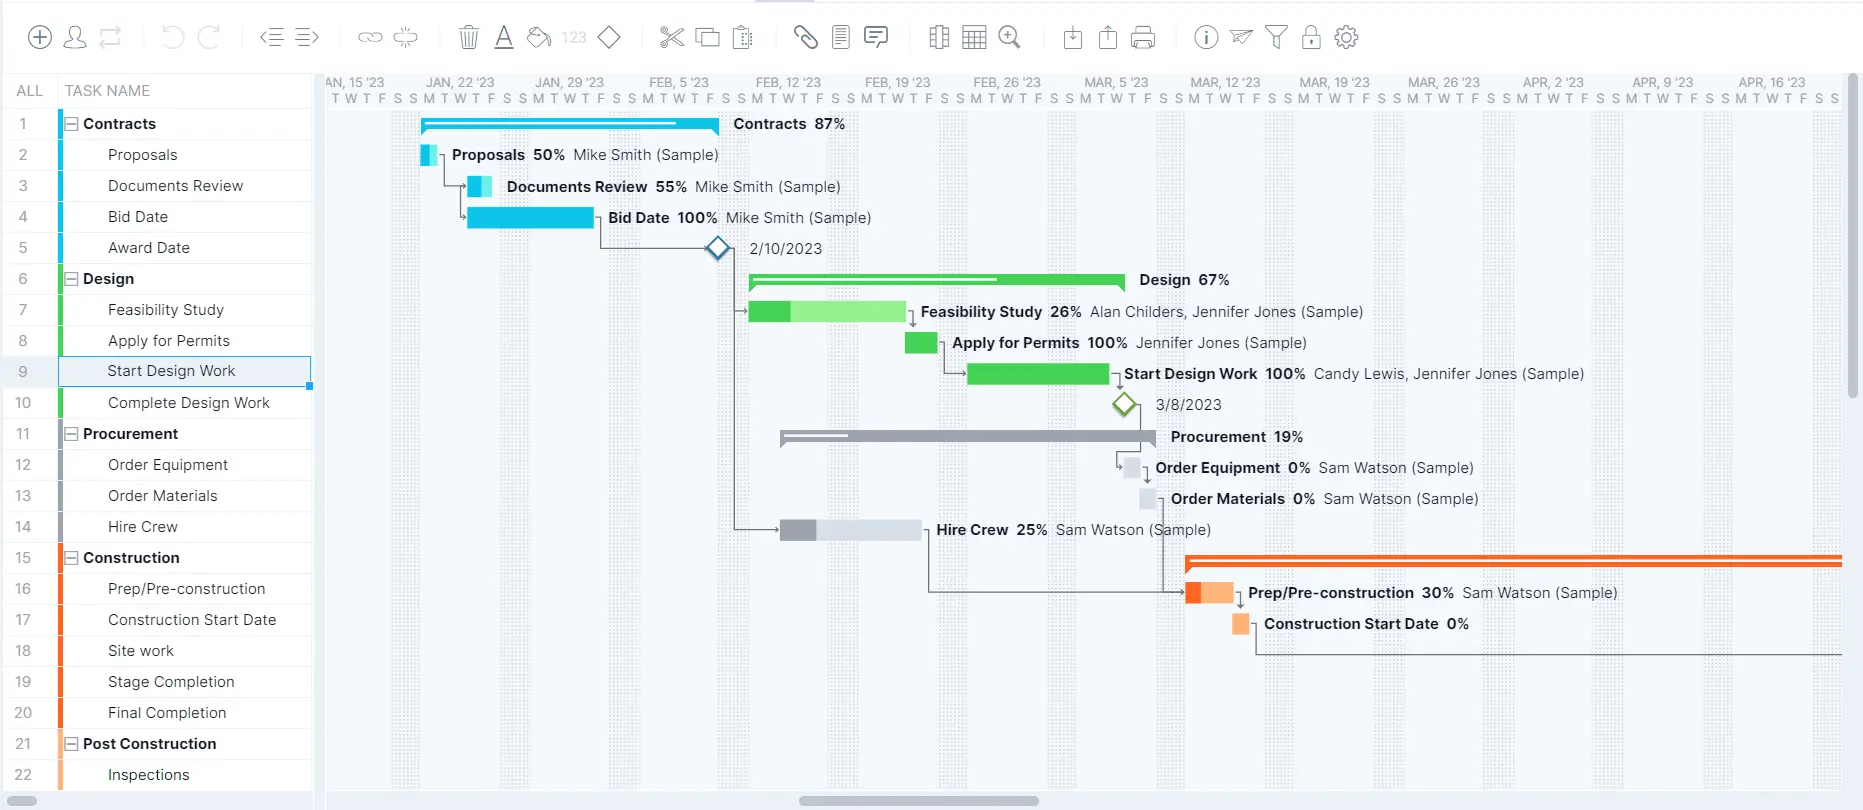
In construction, the sequence of work is everything. Framing can’t start until the foundation is poured. Drywall can’t go up until rough-in inspections pass. ProjectManager lets construction managers set task dependencies directly on the Gantt chart – finish-to-start, start-to-start and finish-to-finish – so when one task slips, the software automatically adjusts every task that depends on it. Set a baseline at the start of the project and the Gantt chart will show actual vs. planned progress at a glance throughout the build.
Track Construction Progress in Real Time
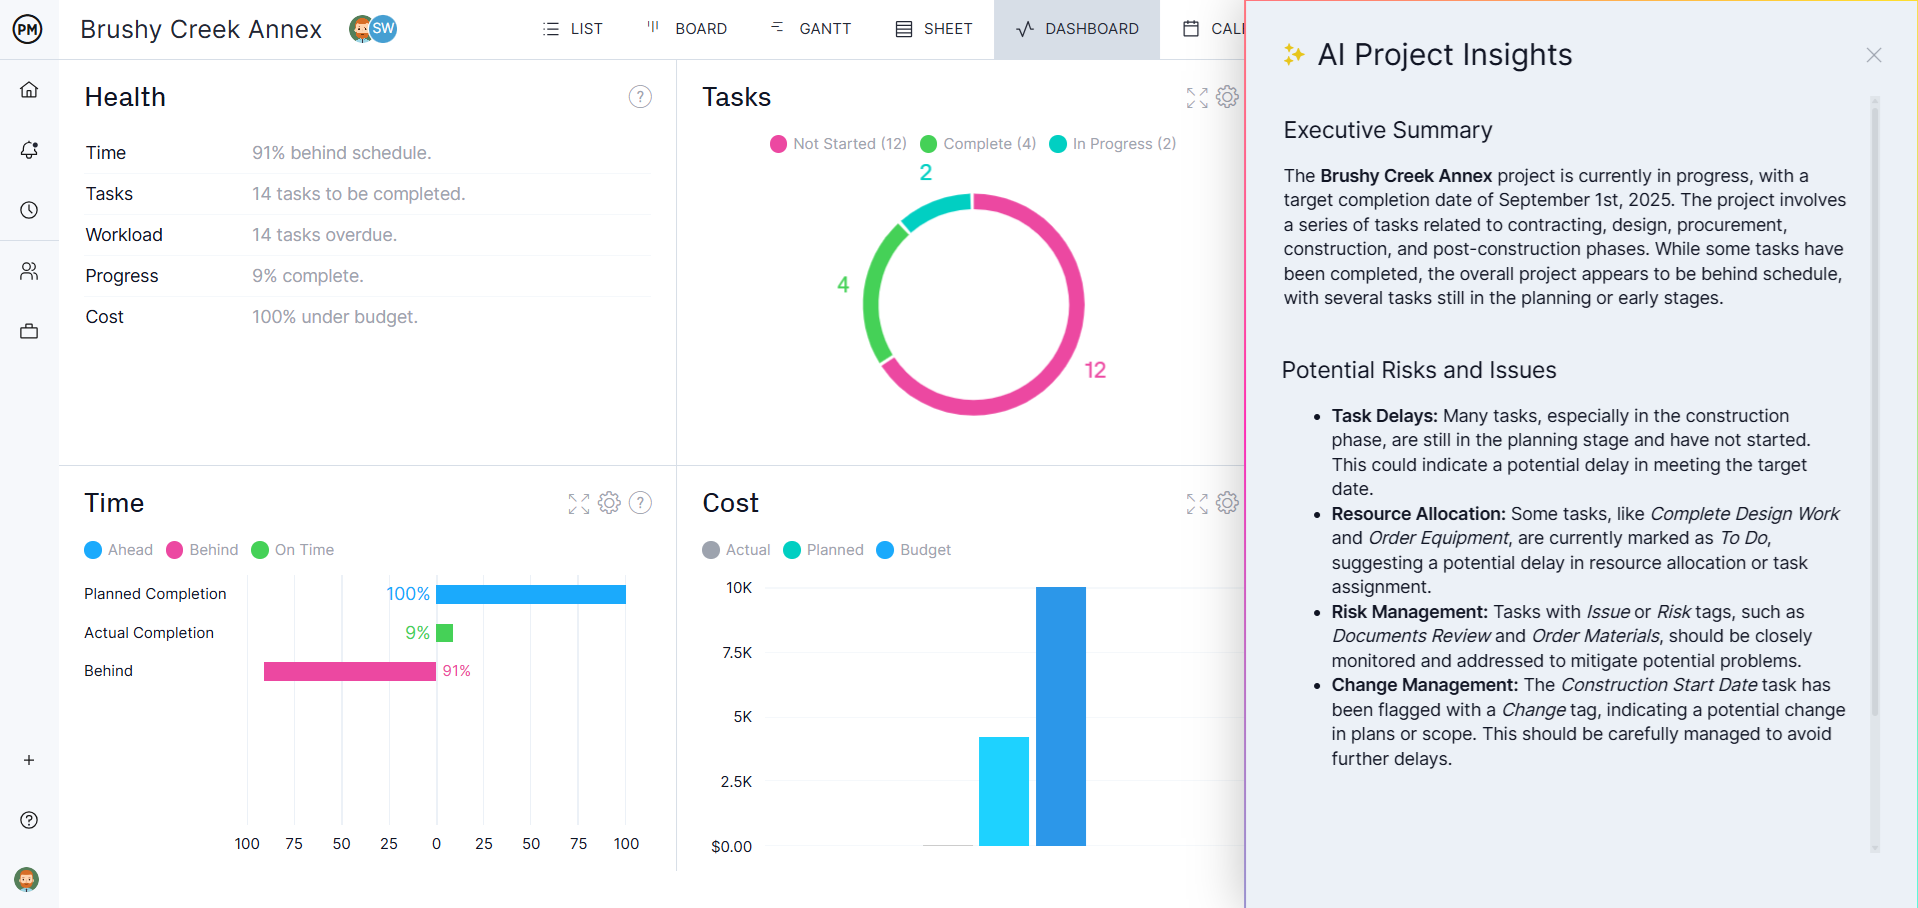
Keeping a construction project on schedule means having a clear picture of where every trade stands at any given moment. Once tasks are assigned to team members in ProjectManager, they can update their own progress from the field using any device. Project managers see those updates immediately on the Gantt chart and on the real-time project dashboard, which tracks schedule, budget, workload and cost variance in one view. Customizable reports make it easy to generate owner updates or pull a schedule-of-values snapshot without digging through spreadsheets.
Related Content
- Construction Schedule Template
- Construction Management Plan Template
- Free Gantt Chart Template for Excel
- Construction Schedule: A Guide With Examples
- Construction Project Management Guide
ProjectManager is cloud-based project and portfolio management software that connects construction teams whether they’re in the office, in the trailer or out on the job site. Crews can update task progress, share RFIs and daily reports, and stay aligned with real-time notifications. Join construction teams who use our software to keep builds on schedule and within budget. Get started with ProjectManager today for free.