Reporting takes time, but that is time well-spent, if you’re a project manager. That doesn’t mean you might be overcomplicating the process. To learn how to make project reporting easier, watch the following training video with our own Jennifer Bridges.
Here’s a shot of the whiteboard for your reference!
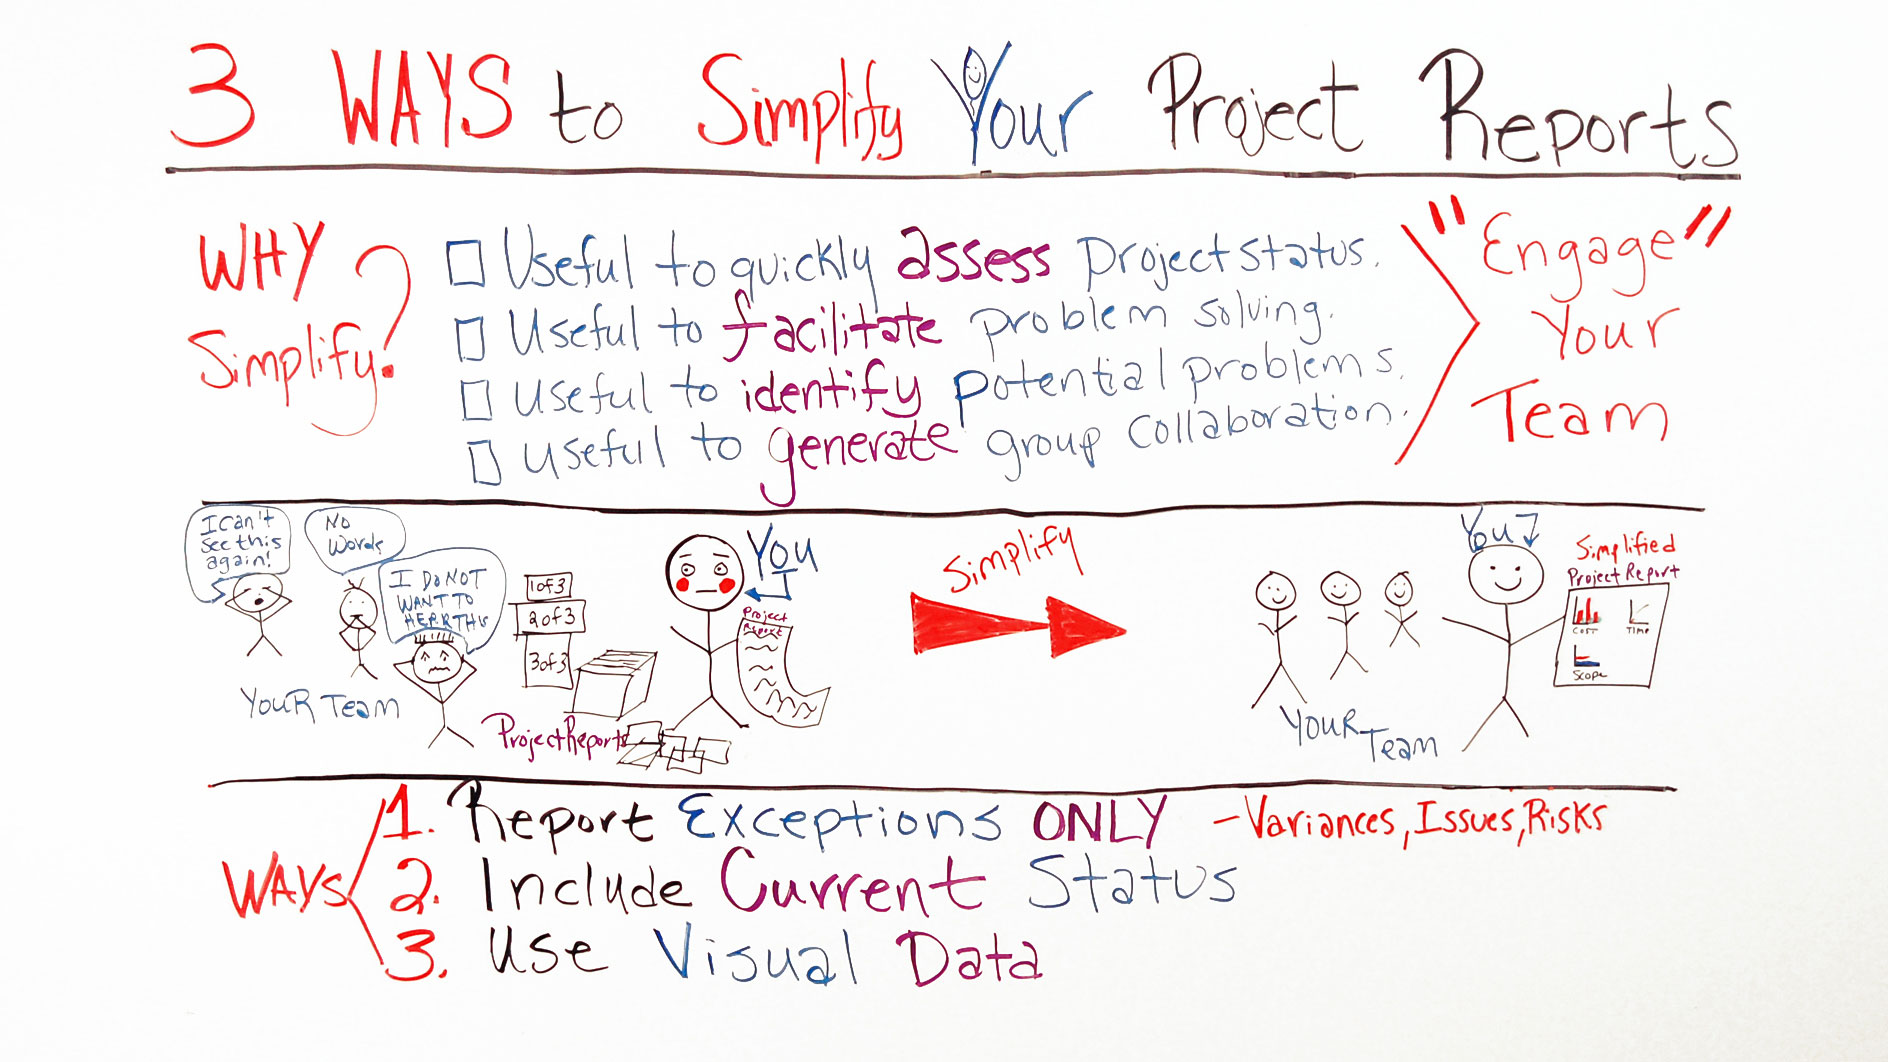
In Review: How to Simplify Your Project Reports
Jennifer discussed three ways to simplify your project reporting. She notes that some might wonder why you would simplify reporting, when the point is to demonstrate the complexities of the project data.
It’s a valid concern for anyone reporting project data to stakeholders. But effective communication means getting the relevant data to the right people. Just because you can provide a lot of in-depth data, doesn’t mean you should.
Here are Jennifer’s keys to simplifying reports:
- Report exceptions only
- Include current status
- Use visual data
That last point is key. Use graphical dashboards to reveal project data at-a-glance for visual reference.
Pro-Tip: Bring interactive reports to your next project meeting. When you control the information, you control the room. Mirror a tablet or laptop on a big screen, pop open a real-time dashboard and create custom reports on-demand. You don’t want people looking down at paper, when they should be focusing on the data.
Thanks for watching!
Video Transcription
Well, hello, everyone. Today’s whiteboard session is on Three Ways to Simplify Your Project Reports.
You may ask, “Why do I need to simplify? I mean, after all, there’s a ton of information on your project, so much about the issues, in the risk, in the activities and all the scope, and all stakeholders and resources. How do you simply all of that or why would you even want to, right? Why get rid of valuable information?”
Well, the reason we want to simplify is so you, the project manager, can quickly assess your project status. It can also help you and your team to facilitate problem-solving. When you can more easily get to information in a simplified way, then people can engage in discussions and see potential problems and maybe even alternative solutions.
It can also help you identify potential problems. If you can see that information, look more easily at any issues, any risks, maybe some things that you overlooked, you can again, alleviate or identify and alleviate potential problems.
And, more importantly, it’s useful to generate group collaboration. If it’s simple [enough] that everybody can read, and wants to get excited about, then it builds collaboration among the team and gets everybody engaged–your stakeholders and your team.
So we want to move away from all these mounds of information if you think of files and boxes and all kinds of information. Then we want to move from this to simplify to something to more visual and easy to get to.
Although there are many ways you can simplify your project reports, today, I want to focus on three, because these three can give you a really big bang for the buck.
Number one, report exceptions only. Exceptions in variances like, your cost, your time, your budget, maybe even resources or even quality, and report on any issues or potential risk. Two, also include the current status.
It’s not required to go back and rehash anything that’s old. As a matter of fact, people get bored. They’re like, “Haven’t we talked about this before?” So the team actually disengages. So we only want to focus on the current status.
Then [finally] we want to use visual data. Again, there’s so much data and it’s easier to see something visual, give a better picture of what’s happening.
So if you needed tools to help you simplify your project reports, then sign up for our software now at ProjectManager.com.
