

JOIN 35,000+ HIGHLY PRODUCTIVE TEAMS


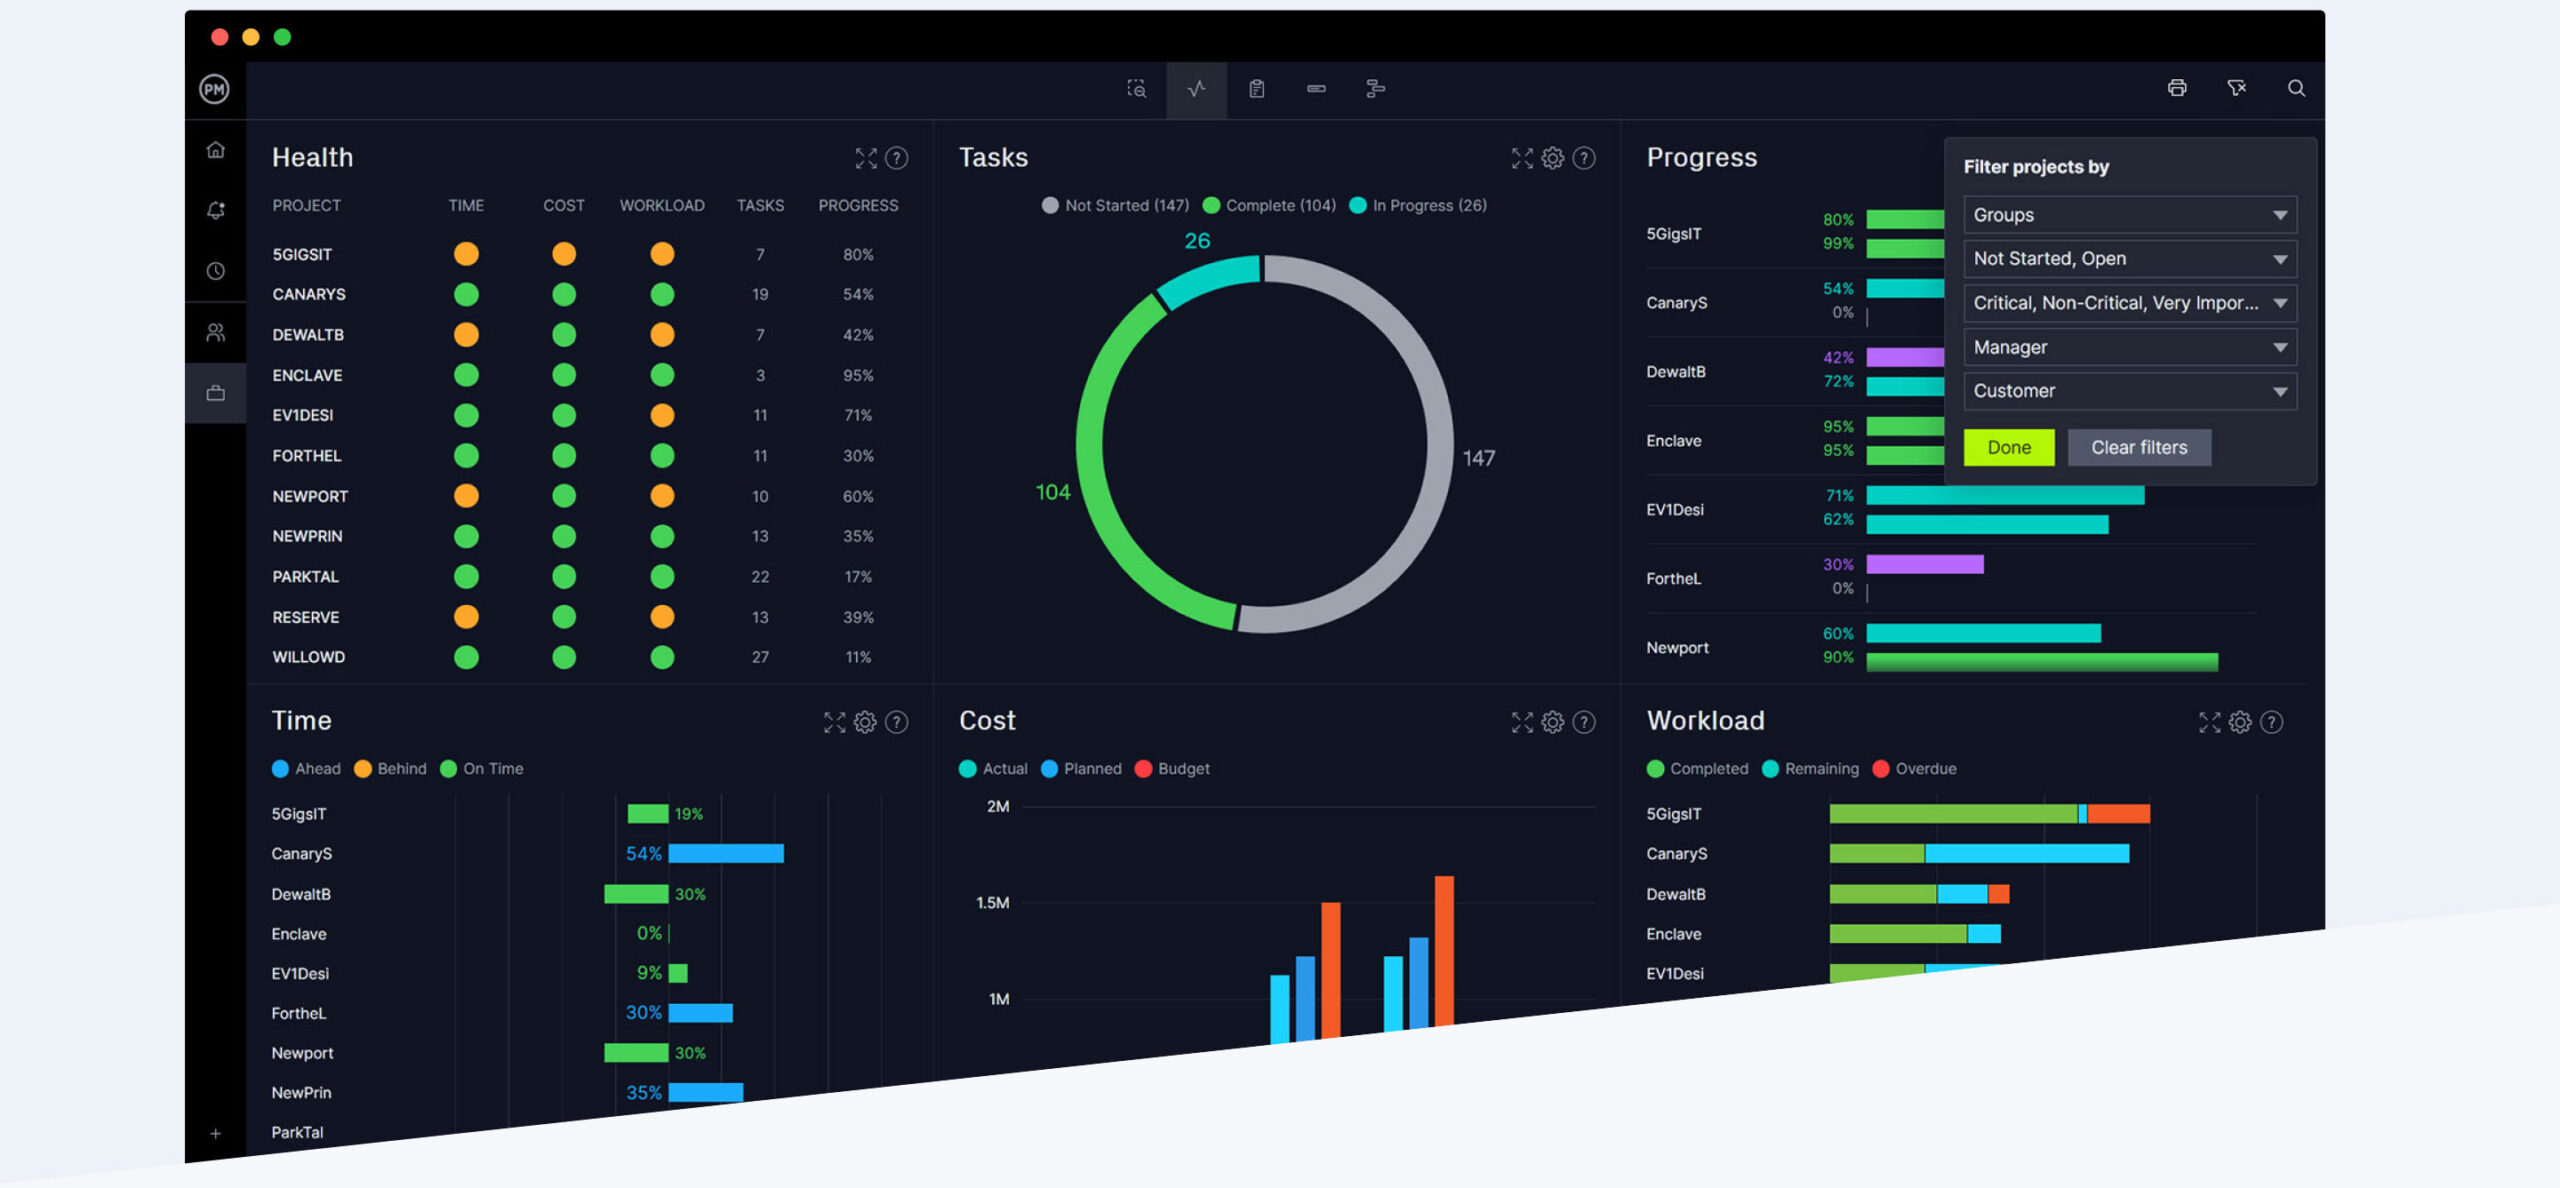
Bring agility, accuracy and insights to your project portfolios
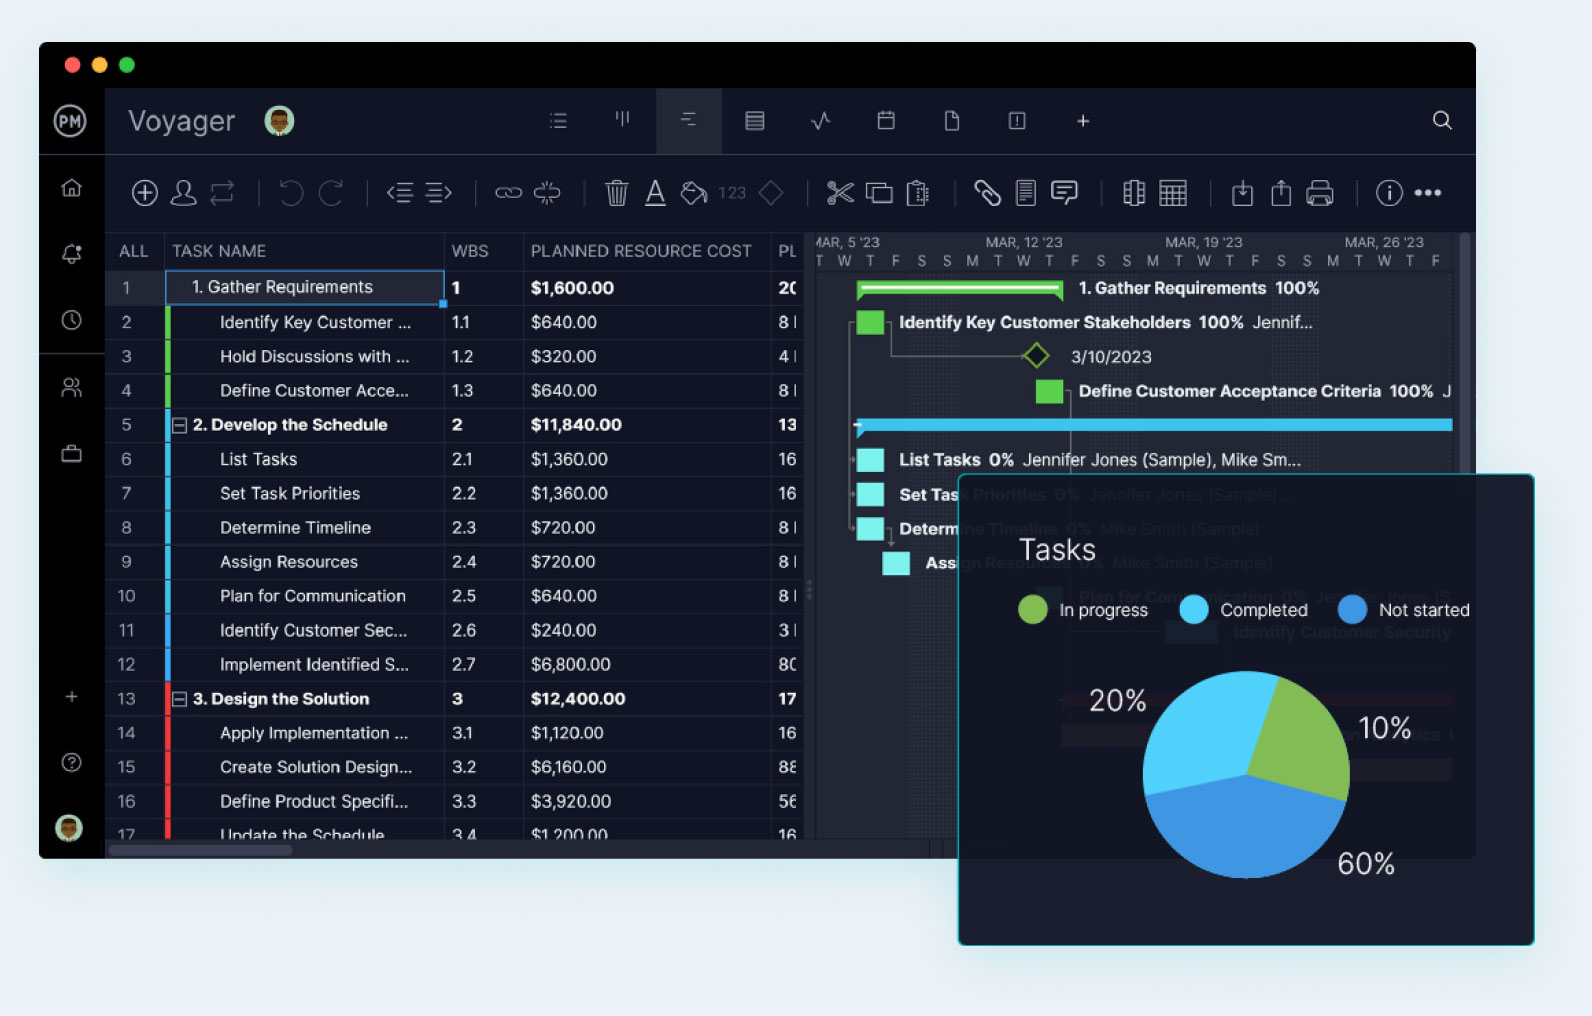
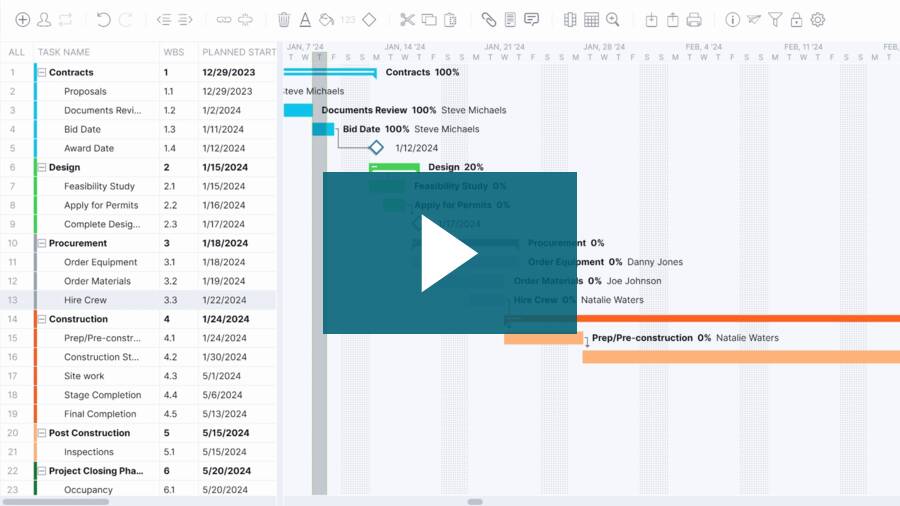
Detailed planning and execution
For projects that require vigorous planning, forecasting, cost analysis, resource allocation, task management and reporting, ProjectManager outperforms the competition.

"The value of formal project management pays for itself quickly."
Scott Lilly
Kaiser Aluminum
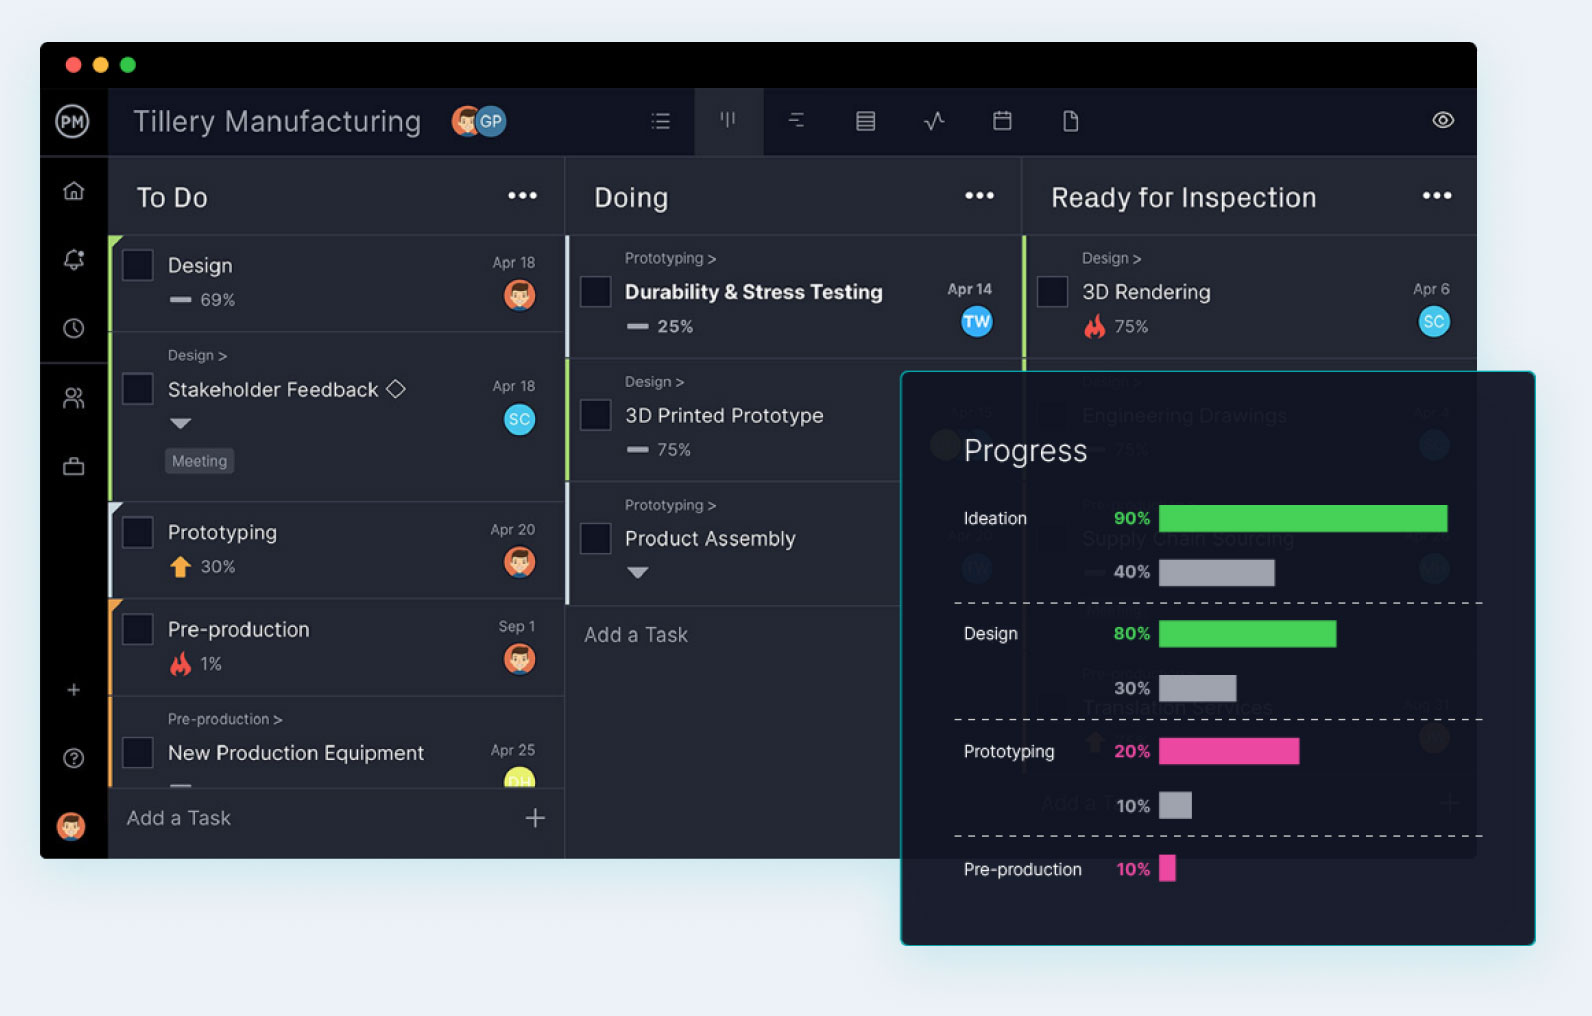
Manufacturing project management
Deliver quality products to your customers, faster. Plan jobs, evaluate performance and adapt to last minute changes as a team with the powerful flexibility of our desktop and mobile apps.

"The software helps us deliver to our customers’ objectives on time, budget and to the requisite quality."
Dan Smith
CatSci
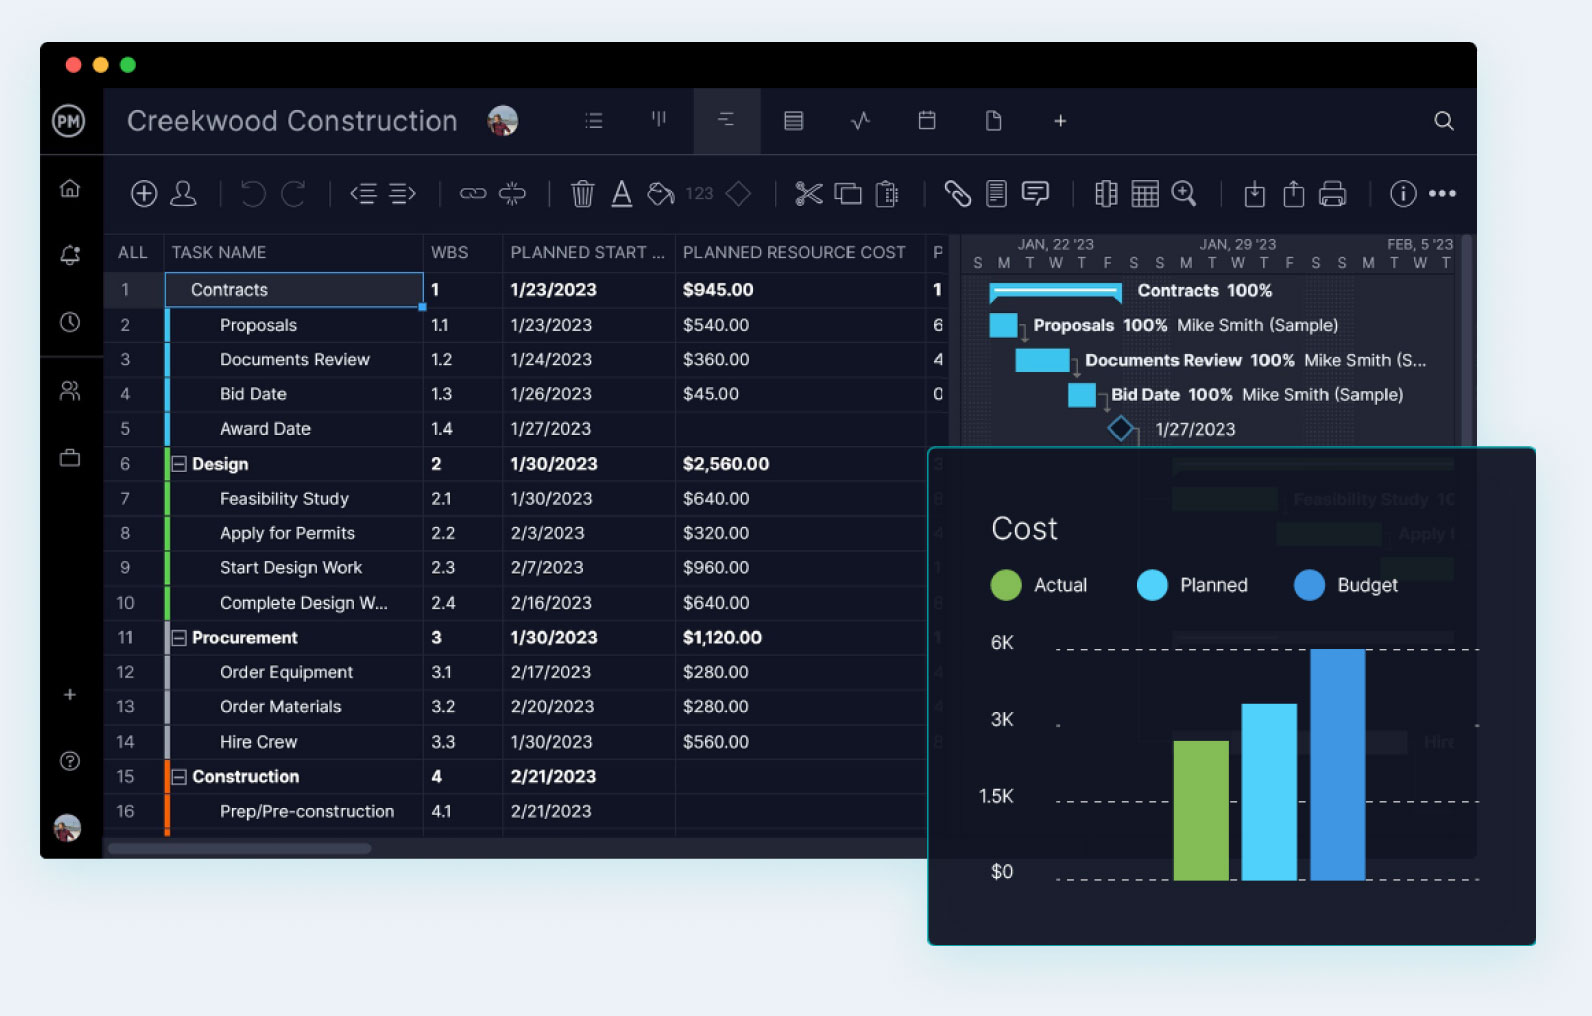
Construction projects
Keep schedules on time and under budget. Plan with dependencies, then track baselines and filter for the critical path. When it’s time to execute, field teams can update tasks on site with the mobile app.

"We could start tracking our projects to make more accurate quotes. It was fantastic."
Justin Smith
Construc Pty Ltd
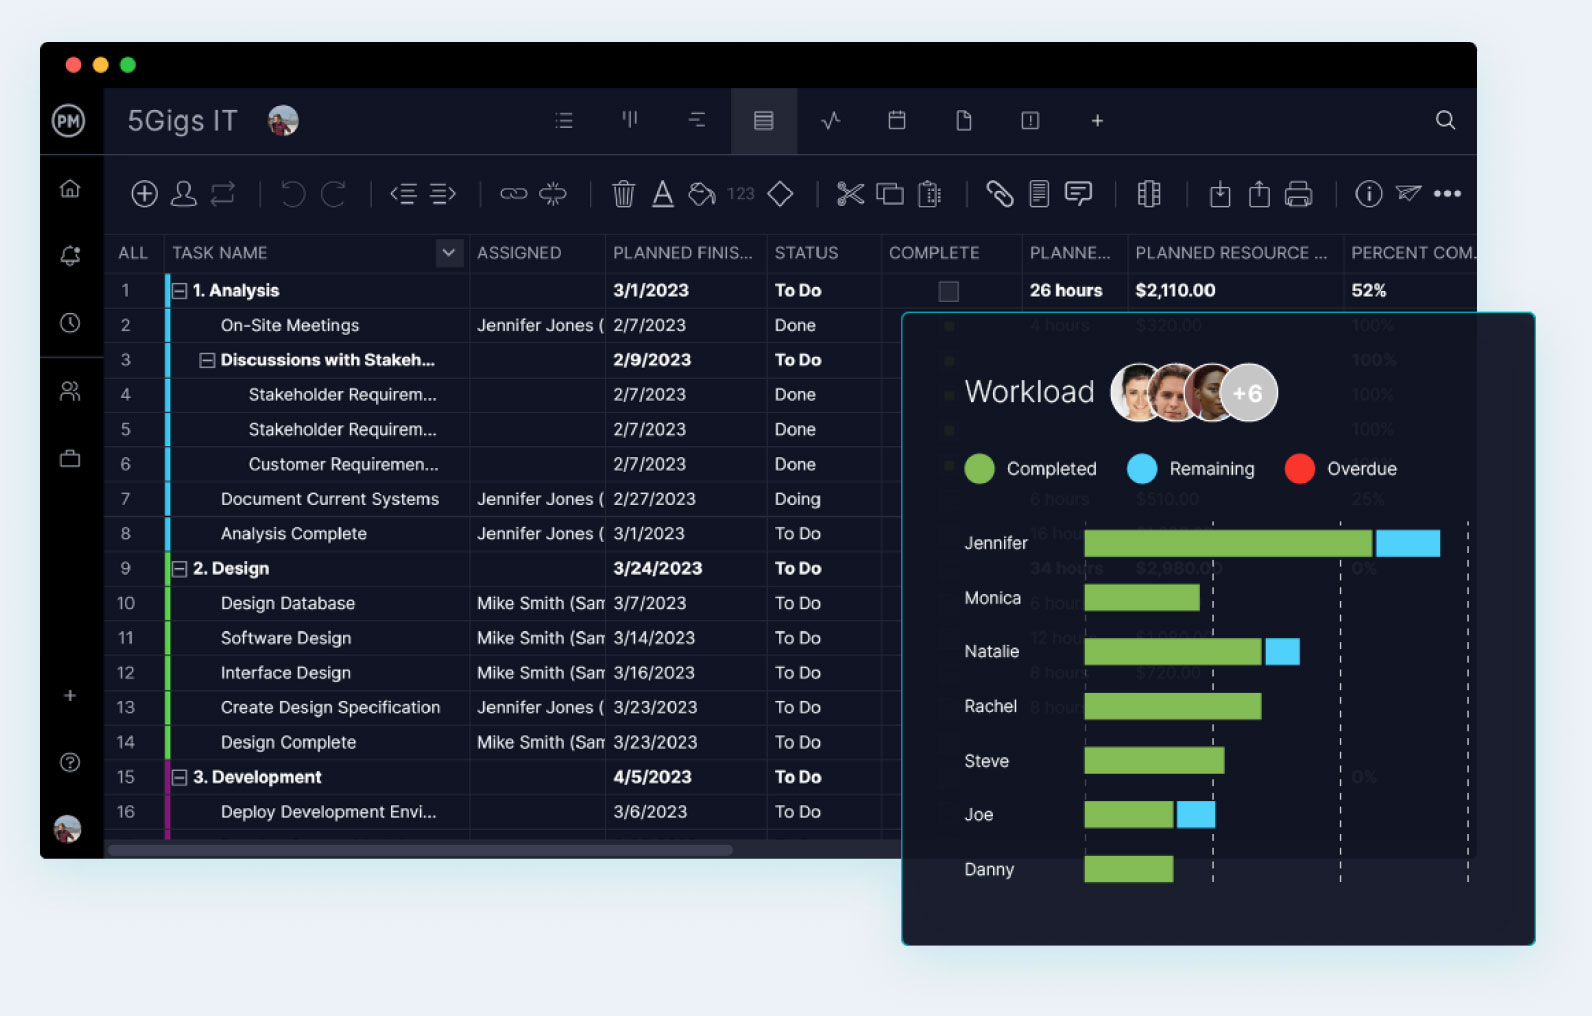
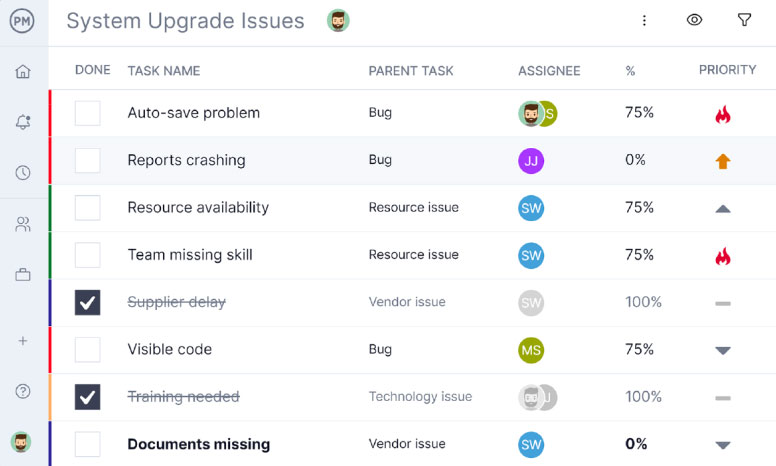
IT project management
Plan ahead while managing today’s IT needs. Tackle everything from onboarding to request management to complex waterfall projects with our unique, hybrid offering of Gantt, kanban and advanced reports.

"I get central information to schedule our people, share those schedules, comment and update them."
Mark Klady
Lightenco
Professional services
Ensure client satisfaction without sacrificing ROI. Adjust resource schedules in real time across projects, track time on tasks, monitor costs and give your client visibility into progress with a free guest license.

"We could never tackle the amount of projects we have if we didn’t have ProjectManager."
Stacy Kerns
Texas Health and Human Services

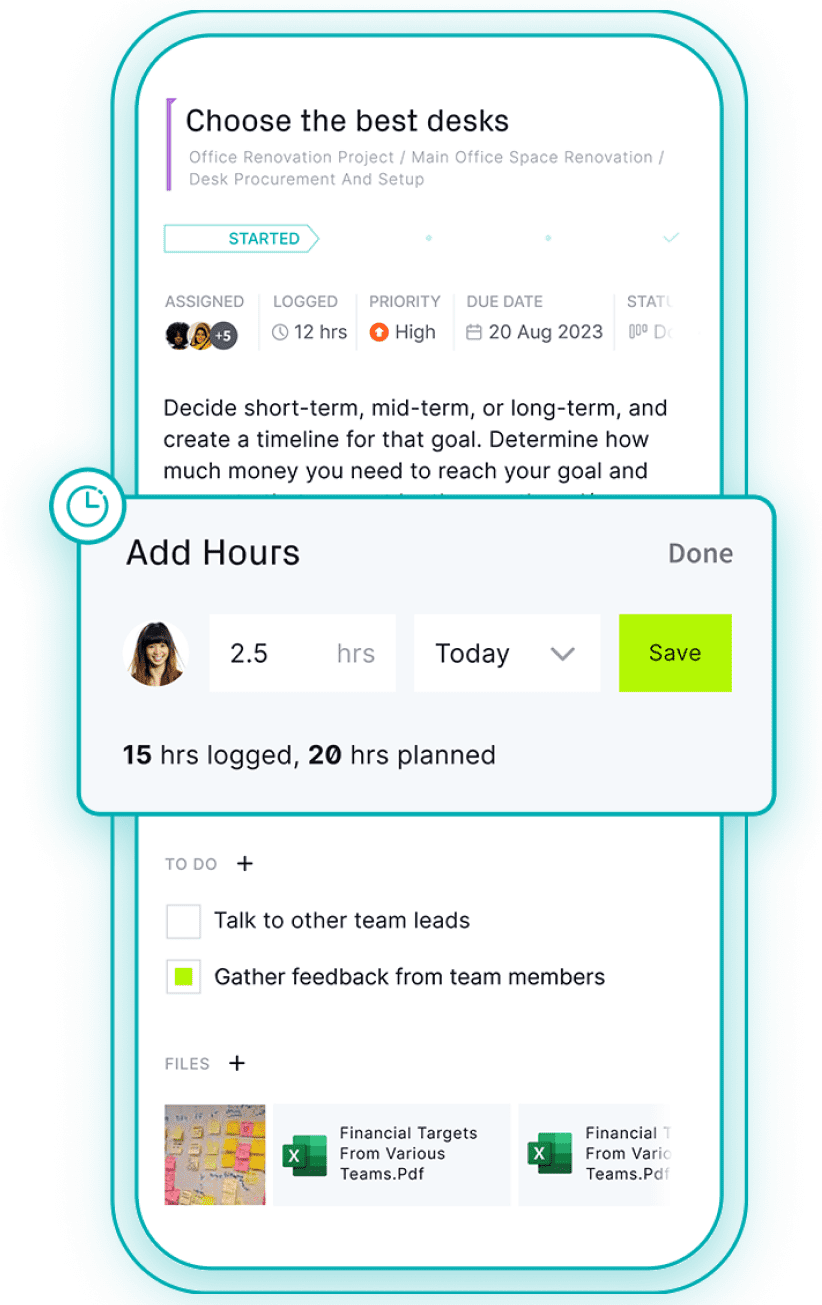
Plan in the office.
Execute in the field.
Build detailed plans that provide everything your team needs to get it right the first time. And with our mobile app, tasks can be updated immediately from the worksite or shop floor.
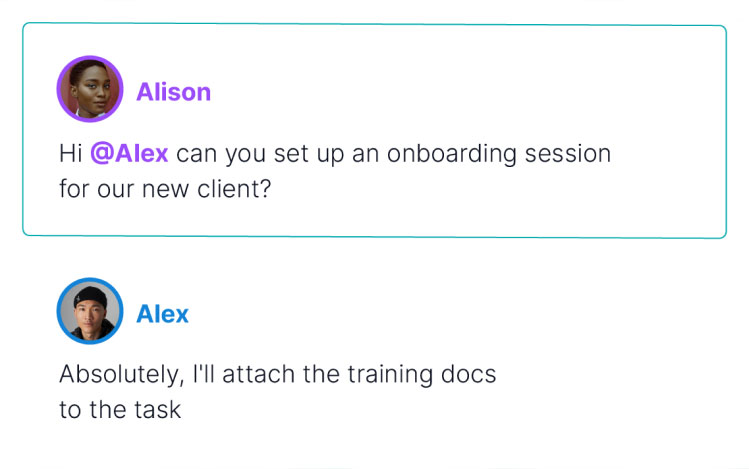
Secure collaboration
Collaborate on projects without compromising sensitive information thanks to versatile custom roles, user permissions, approval workflows, project restrictions and enterprise-level technical security with SOC 2 compliance.
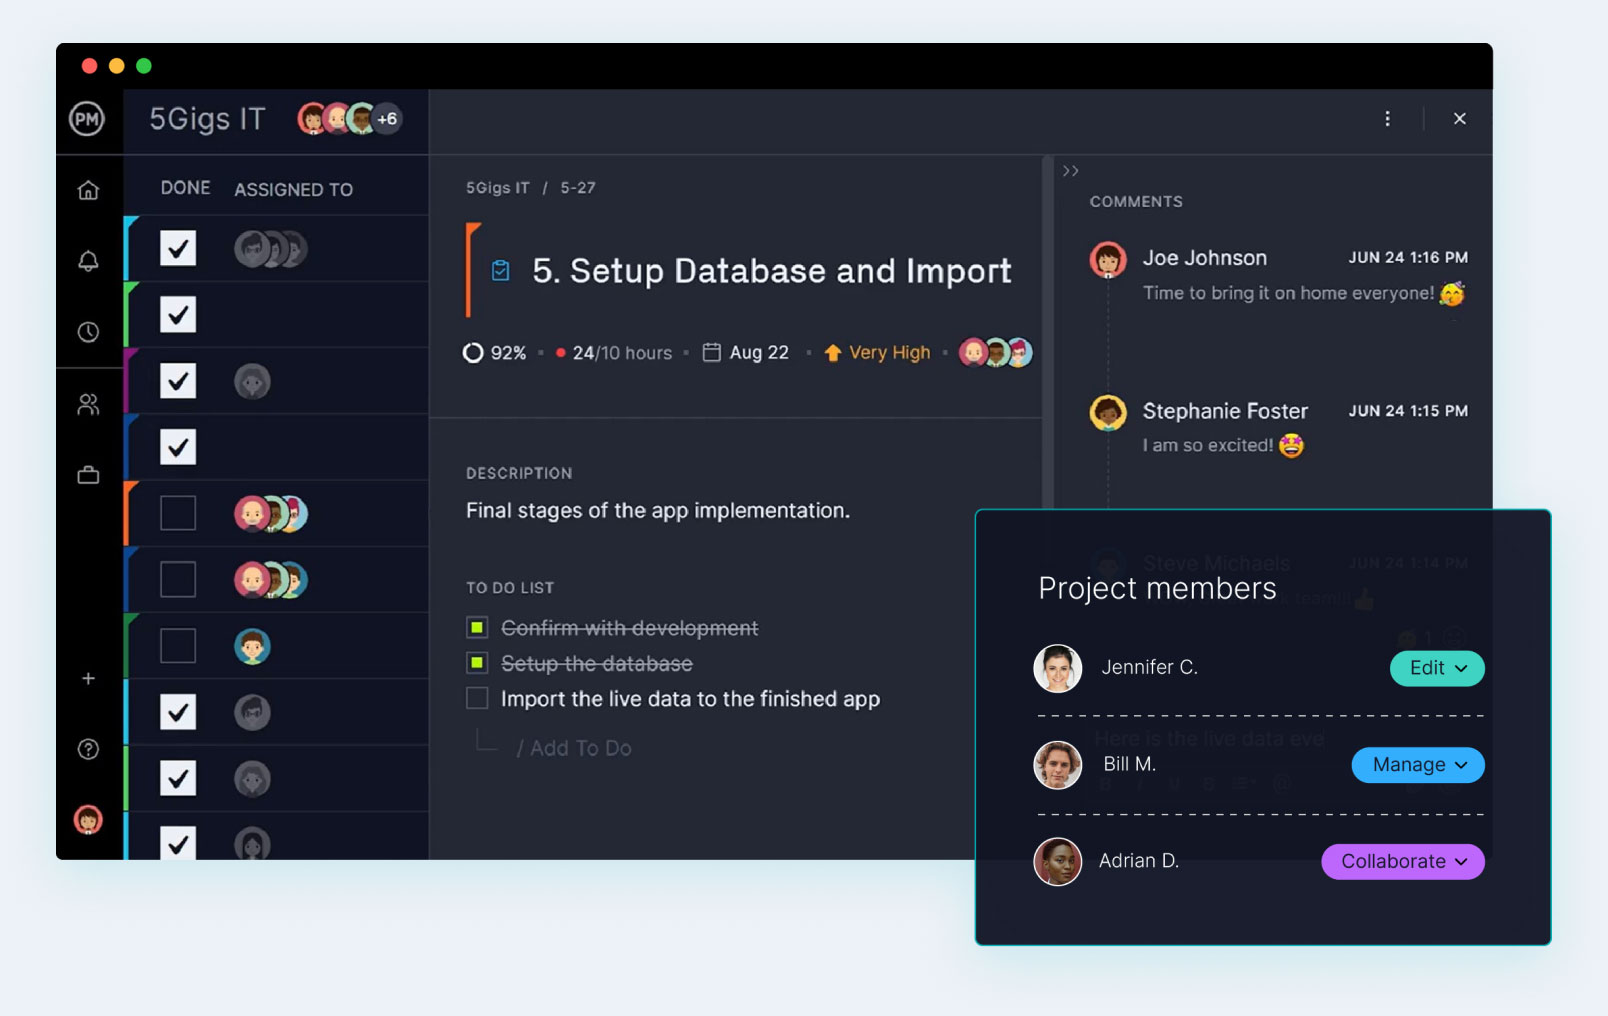
Single source of truth
Store project documents and collaborate in one secure location. No more digging through emails or messages.
Peace of mind
Set guardrails that limit a user’s ability to adjust plans, bypass approval workflows or view confidential files.
Eliminate busy work
Save hours by automating administrative work such as priority changes and approval requests.
Access from anywhere
Manage your projects no matter where your work takes you. Our desktop and mobile apps are always in sync.

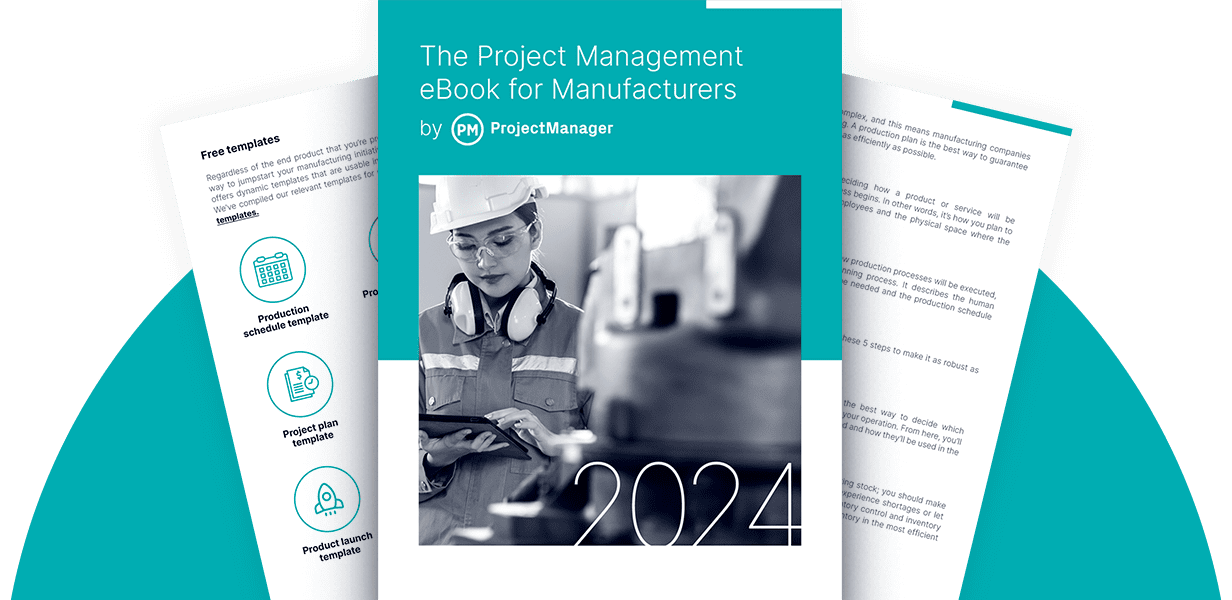
Project Management eBook for Manufacturing 2024
Master manufacturing processes, resource planning, production scheduling and more.
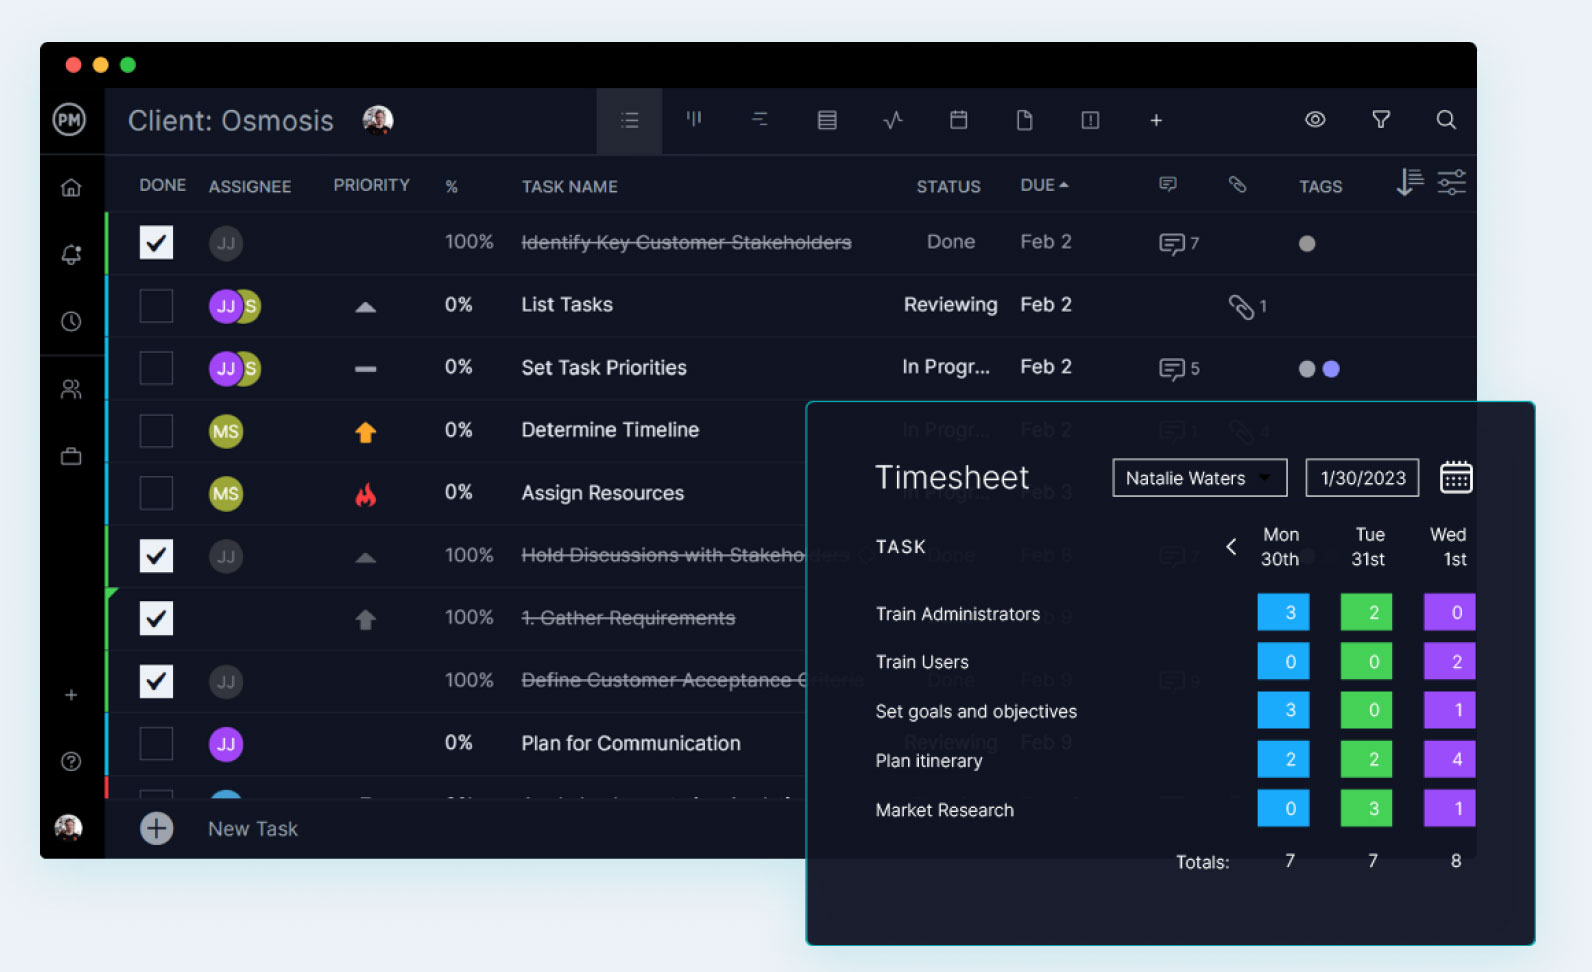
Advanced resource management
Get advanced resource management at a fraction of the cost. Schedule resources, manage workloads, submit timesheets and track it all in real time, across projects.
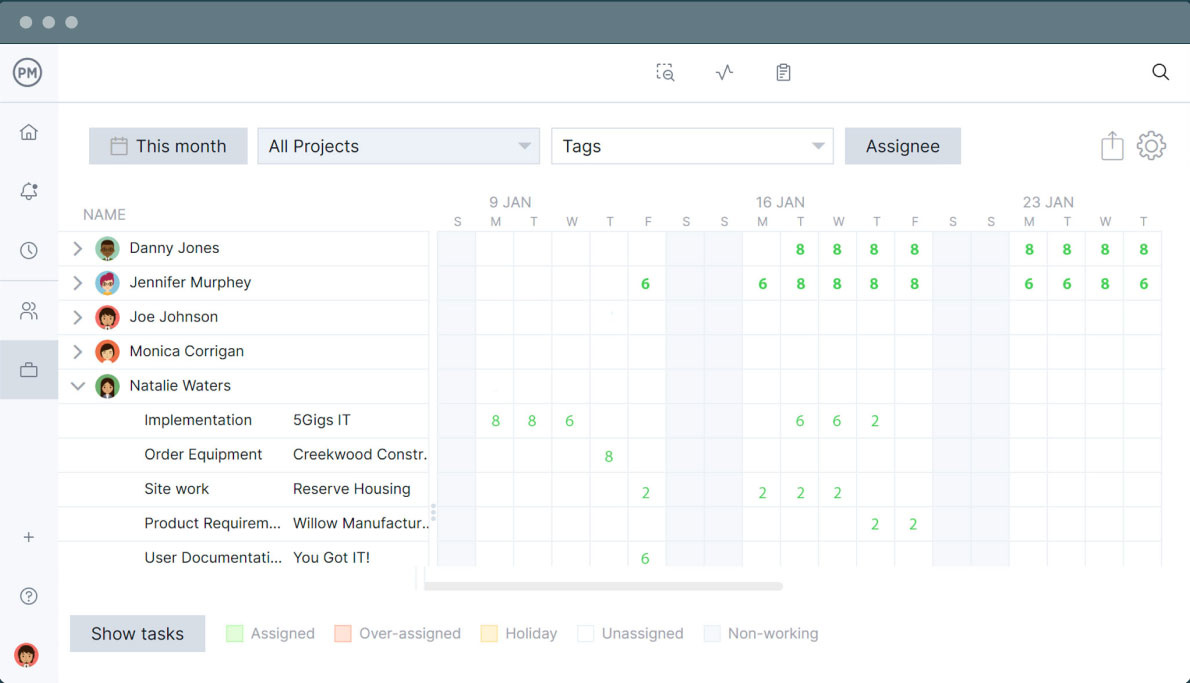
Real-time availability
Get live insights into your team’s workload. Reassign work with a simple drag and drop to eliminate resource bottlenecks.
Stress-free time tracking
Team members can log hours as they work, then use those hours to automatically populate timesheets at the end of the week.
Impactful portfolio management and reporting
Do more than just group your projects. Design custom portfolio dashboards, allocate resources, balance budgets, run in-depth reports and align everything on a roadmap.
Effortless scalability
Copy projects and make custom templates to quickly make a portfolio and ramp up in days, not weeks.
ROI insights
Pinpoint which projects yield the best results for your team by leveraging our out-of-the-box dashboards and reports.
Stakeholder management
Print or share dashboards, Gantt charts or project reports with stakeholders—or simply give them a free guest license.
Organizational alignment
When you manage teams, projects and portfolios in one software, it’s easy to align everyone to the same goals.
Integrate with over 1,000 business & project management apps

Manage tasks right in your Gmail app. Plus, sync to Google Drive & your Google Calendars.

Microsoft
Seamless importing and round-tripping of Microsoft Project plans, Excel files and CSV files.

Zapier
Keep the data flowing when you connect with Salesforce via our Zapier integration.


Powerful for managers. Flexible for teams.
Trusted by 35,000+ users worldwide.
“The reporting feature is outstanding – lets you personalize the reporting, and export it.”

“It has an excellent price if we think about all the functions that ProjectManager has.”

“I feel good about recommending ProjectManager because of the people you have in support”
Start your free 30-day trial
Deliver faster, collaborate better and innovate more effectively without the high price tag or months-long implementation required by other products.